Transcription
N E W Z E A L A N D L AW S O C I E T Y &N I C H E C O N S U LT I N G G R O U PLegal SalarySurvey 2018
LEGAL SALARY SURVEY 2018 PA G E 2ContentsForeword.Introduction.3Part 4 ‑ Salary Increase.22Did your base salary increase in the last 12 months and if so, by how much? .234Part 5 – Job TitlesPart 1 – Number of responses.5.6Do you receive benefits in addition to your base salary? . . . . . . . . . . . . . . . . . . . . .7What benefits do you currently receive? . . . . . . . . . . . . . . . . . . . . . . . . . . . . . . . . . . .8What do you estimate is the annual value of the benefits you receive? . . . . . . .11. . . . . . . . . . . . . . . . . . . . . . . . . . . . . . . . . . . . . . . . . . . . . . . . . . . . .Part 6 – Charge out ratesPart 2 – BenefitsPart 3 – Part-time vs Full-time25. . . . . . . . . . . . . . . . . . . . . . . . . . . . . . . . . . . . . . . . . . .26.27Private Practice – Small firms (fewer than 5 lawyers) . . . . . . . . . . . . . . . . . . . . . . . . .28Part 7 – Salary GuidePrivate Practice – Medium firms (5 to 20 lawyers) . . . . . . . . . . . . . . . . . . . . . . . . . . . .29Private Practice – Large firms (more than 20 lawyers) . . . . . . . . . . . . . . . . . . . . . . . .30. . . . . . . . . . . . . . . . . . . . . . . . . . . . . . . . . . . . .14Private Practice – Barristers . . . . . . . . . . . . . . . . . . . . . . . . . . . . . . . . . . . . . . . . . . . . . . . . .31Do you work full-time or part-time? . . . . . . . . . . . . . . . . . . . . . . . . . . . . . . . . . . . . . . . . .15In-house . . . . . . . . . . . . . . . . . . . . . . . . . . . . . . . . . . . . . . . . . . . . . . . . . . . . . . . . . . . . . . . . . . .32What are your hours per week (on average) if you work part-time? . . . . . . . . . . .17Salary visual comparison . . . . . . . . . . . . . . . . . . . . . . . . . . . . . . . . . . . . . . . . . . . . . . . . . . . .33What are your reasons for working part-time? . . . . . . . . . . . . . . . . . . . . . . . . . . . . . . .19
LEGAL SALARY SURVEY 2018F o r ew o r dPA G E 3ForewordThis is the fifth survey the New Zealand LawSociety has carried out on the salaries paid toemployed lawyers working in-house and in privatepractice. We believe the provision of freely availableinformation on remuneration, the hours worked,other benefits and charge-out rates is an importantresource for the legal profession.The survey was sent out by the Law Societyto all New Zealand-based lawyers who wereemployed by a law firm or who were working asin-house lawyers. It does not, therefore, includepartners and directors of law firms or barristerssole (other than barristers who are employed byanother barrister).The response rate is the best we have had forany of our salary surveys. While any survey willalways be indicative rather than conclusive, weare confident that the results provide an excellentguide to prevailing levels of salaries and employment conditions.The survey found there were no distinguishabledifference in the salaries paid to women and men intheir first decade of practice. This is encouraging,of course. It is important to note, however, thatthere are noticeable gender differences in hoursworked, the level of salary increases, benefits andother employment conditions. Women also make uponly one-third of the partners and directors in ourlaw firms, which will mean that the overall averageremuneration of a woman lawyer is below that ofthe average male lawyer. The survey indicates wehave a good starting point, but that is what it is:a starting point. Continued implementation of theLaw Society’s Gender Equality Charter will mean wewill have both a commitment from the signatoriesand also detailed research on measures to secureequality.The Law Society greatly appreciates the involvement of Niche Consulting Group in carrying outthis survey. Their expertise in analysis and theirknowledge of legal recruitment and employmentin New Zealand has resulted in the preparation ofthe most detailed report on legal salary surveysthat we have been able to provide.Kathryn BeckPresident, New Zealand Law Society
LEGAL SALARY SURVEY 2018I nt r o d u cti o nPA G E 4IntroductionNiche Consulting Group is proud to partner withthe New Zealand Law Society to present this surveyof salary and employment trends for 2018. As wellas gathering salary information, we asked questionsabout benefits, part-time work, salary increases,job titles and charge out rates.This survey was completed by over 2,500 members of the New Zealand Law Society with a broaddistribution of experience levels, locations andpractice types. This was a very pleasing response,though it should be noted that there was a relativelysmall response from lawyers with 5 to 9 years postqualification experience. This may correlate to thenumber of lawyers who are working overseas atthis stage of their career.While some reports in the media this year madeclaims of significant salary inequity between maleand female lawyers, our raw data showed no distinguishable difference by gender in the 0 to 9years PQE range. This group represents the largestnumber of respondents at 62%.However, the ‘Snapshot of the Profession’ featured in the March 2018 edition of LawTalk showsthat male lawyers make up 39% of employeesin multi-lawyer law firms, and partnerships aremade up of 73% male lawyers. In other words,even though there are more women working inthe legal profession, there are more men in senior,higher paying, roles. It would be hard to disputethat this has created a gender-based wage gap.We expect to see the gap close in coming years,as a generational shift occurs, and more womenmove into partnership and senior roles.The parameters of this survey do not allow usto draw any conclusions about pay equity for theprofession as a whole. We may expand the information gathered in future surveys to enable a moredetailed analysis of gender pay equity.The salary tables provide good insight into salaries in the legal profession, according to PQE leveland across different locations and practice types.Nevertheless, we would caution against makingsalary decisions, or petitions for an increase, basedsolely on the survey data. In some instances, a lowsample was received, and/or a very wide rangewas given. We would recommend the survey databeing used in conjunction with market informationand, where appropriate, your existing salary dataand remuneration strategy.Please feel free to contact a consultant at NicheConsulting Group to discuss any specific queries.We would like to thank all those who participatedin the survey and we hope the information providessome useful insights.Jane TemelDirector, Niche Consulting Group
LEGAL SALARY SURVEY 2018Pa r t 1 – N u mbe r o f r esp o nsesPart 1 – Number of responsesT O TA LBY T I T L E2579 Total 2193 Complete386 Partial, incomplete information1013 SolicitorBY G E N D E R1483 Women702 Men4 OtherB Y L O C AT I O N807 Auckland619 Wellington226 Christchurch47 Dunedin96 Hamilton62 Tauranga195 Other North Island Centre126 Other South Island Centre718 Solicitor249 Senior Solicitor46 Staff Solicitor330 Associate 189 Associate141 Senior Associate280 Counsel101 Legal Counsel76 General Counsel28 Senior Counsel26 Special Counsel23 Crown Counsel15 In-house counsel11 Counsel105 Lawyer 90 Lawyer15 Senior Lawyer90 Adviser 63 Senior Legal Adviser16 Legal adviser11 Adviser187 Other 65 Manager37 Barrister32 Consultant26 Principal14 Head13 DirectorPA G E 5
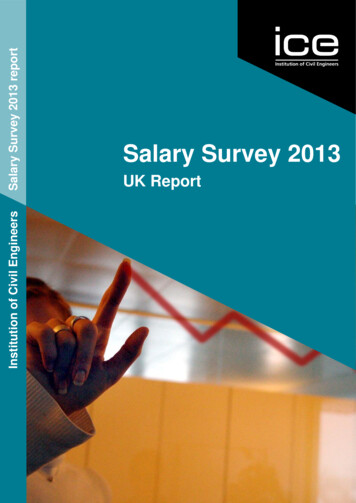
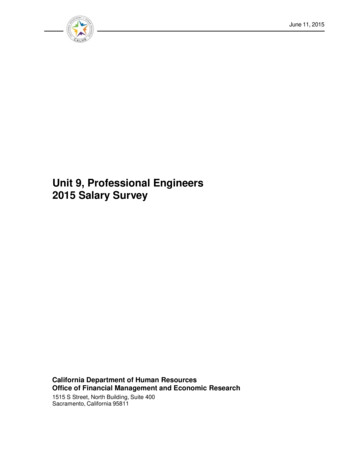
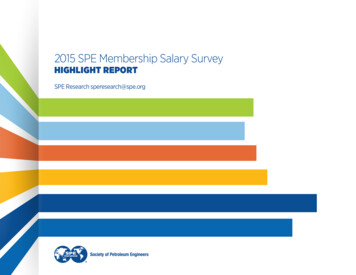
LEGAL SALARY SURVEY 2018Pa r t 2 – B enefitsPart 2 – BenefitsThe survey found that 50% of respondents receivebenefits. As might be expected, the distributionof those who receive benefits increases with PQElevel. Mobile phones and laptops/tablets are amongthe most commonly received benefits, along with‘bonus scheme’ and ‘flexible hours’. This seemsto point to a new way of working which is moreflexible, and outcome focused.As organisations aim to improve attraction andretention in an increasingly talent driven market,we have seen many organisations move awayfrom a ‘cashed up’ model and back to a ‘salaryplus benefits’ model. This is reflected in the data,which shows that 33% of respondents receive carparking, 30% receive private health insurance and20% have a social club. Other benefits such as gymmembership and ‘day off on your birthday’ featureat 17% and 13% respectively.Flexible working is offered quite evenly across alllocations. However, some locations stand out foroffering certain benefits e.g. Auckland for bonuses,Tauranga for mobile phones, Hamilton for parkingand Dunedin for free/discounted legal work.It is interesting to note that male lawyers aremore likely to have a mobile phone, bonus scheme,parking, private health insurance and gym membership than their female counterparts. Female lawyersare more likely to receive flexible hours, a laptop/tablet, discounted/free legal work and a ‘day foroff for their birthday’ than their male colleagues.Of the 50% of lawyers that receive benefits, thevalue of benefits is under 10,000 for most respondents (77%). A small number of respondents receiveover 40,000 in benefits (4%), with the highestpercentage of respondents in this group locatedin Tauranga and Auckland.The value of benefits is mostly even betweenmale and female respondents, although there was ahigher percentage of females in the lowest bracket(up to 10,000), and a higher percentage of malesin the highest bracket (over 40,000).PA G E 6
LEGAL SALARY SURVEY 2018Pa r t 2 – B enefitsPA G E 7Do you receive benefits in addition to your base salary?ALLB Y Y E A R S O F P O S T - Q U A L I F I C AT I O N E X P E R I E N C EYes0–1 years2 years3 yearsYes50%No50%4 years5 years6 yearsNo38% 62%PQE42% 58%37% 63%51% 49%47% 53%55% 45%7 years8 years64% 36%59% 41%9 years68% 32%10–14 years58% 42%15–20 years58% 42%Over 20 yearsIn-houseNo0–1 years38%62%2 years42%58%3 years37%63%4 years51%49%5 years47%53%6 years55%45%7 years64%36%8 years59%41%9 years68%32%10–14 years58%42%15–20 years58%42%Over 20 e50%50%55% 45%BY E M P L OY M E N T T Y P EPrivate practiceYes53% 47%50% 50%
LEGAL SALARY SURVEY 2018Pa r t 2 – B enefitsPA G E 8What benefits do you currently %10%Laptop /TabletFlexiblehoursBonusFree /scheme Discountedlegal workOtherCarMenFlexible hours39%42%32%50%Bonus scheme44%43%46%40%Free / Discounted legal ile Phone62%61%64%0%Laptop / Tablet45%46%42%Social Club21%20%22%Private health %20%10%2%1%0%PrivateGym /Dayhealth Gym mem- off forinsurance bership e /scheme Discountedlegal work46%Flexiblehours60%40%16%21%1%BY G E N D E Laptop /TabletSocialclubPrivateGym /Dayhealth Gym mem- off forinsurance bership birthdayOther0%Gym / Gym membership17%16%20%Day off for birthday16%17%13%Other21%20%21%
LEGAL SALARY SURVEY 2018Pa r t 2 – B enefitsPA G E 9What benefits do you currently receive?BY E M P L OY M E N T T Y P EPrivate usFree /scheme Discountedlegal workCarParkingMobilephoneLaptop /TabletSocialclubPrivateGym /Dayhealth Gym mem- off forinsurance bership %61%70%Other0%PrivatepracticeIn-houseFlexible hours29%55%Bonus scheme42%50%Free / Discounted legal work41%1%0%3%Parking35%30%Mobile Phone56%74%Laptop / Tablet35%61%Social Club27%11%Private health insurance29%33%Gym / Gym membership22%9%Day off for birthday22%5%Other15%29%BenefitCar
LEGAL SALARY SURVEY 2018Pa r t 2 – B enefitsPA G E 1 0What benefits do you currently receive?OtherSouth IslandDunedinChristchurchOtherNorth IslandWellingtonTaurangaHamiltonAucklandB Y L O C AT I O NSCALEFlexible hours0%25%50%75%100%Bonus schemeFree/discountedlegal workThe size and colour of each circle relates to the percentage of lawyers in each subset.CarParkingMobile phoneLaptop/TabletSocial clubPrivate healthinsuranceGym/gymmembershipDay off for exible hours38%38%36%41%40%44%35%35%Bonus scheme59%19%46%37%34%38%17%35%Free/discounted legal g30%71%50%16%50%43%35%53%Mobile %43%35%38%7%38%Social Club21%27%4%22%11%26%24%12%Private health insurance31%29%18%38%21%22%48%15%Gym/gym membership21%0%0%20%14%6%7%24%Day off for %25%21%12%BenefitCar
LEGAL SALARY SURVEY 2018Pa r t 2 – B enefitsPA G E 1 1What do you estimate is the annual value of the benefits you receive?ALL 30k– 40k1% 20k– 30k5%B Y L O C AT I O NUp to 10kOver 40k4% 10k– 20k 20k– 30k 30k– 40kOver 40kAucklandHamilton 10k– 20k13%TaurangaWellingtonOther N.I.ChristchurchDunedinOther S.I.0%Up to 10k77%10%20%30%40%50%60%70%80%90%100%LocationUp to 10k 10k– 20k 20k– 30k 30k– 40kOver 79%11%4%0%7%Wellington77%11%7%1%4%Other North Island 3%3%3%0%0%Other South Island centre88%6%6%0%0%
LEGAL SALARY SURVEY 2018Pa r t 2 – B enefitsPA G E 1 2What do you estimate is the annual value of the benefits you receive?B Y Y E A R S O F P O S T - Q U A L I F I C AT I O N E X P E R I E N C EUp to 10k 10k– 20k 20k– 30k 30k– 40k Over 40kBY G E N D E RWomenMen0–1 years0%2 years3 years10%20%30%40%50%60%70%80%90%100%GenderUp to 10k 10k– 20k 20k– 30k 30k– 40kOver 40kWomen79%13%4%1%3%Men74%13%6%2%5%PQEUp to 10k 10k– 20k 20k– 30k 30k– 40kOver 40k0–1 years96%3%1%0%0%9 years2 years93%6%1%0%0%10–14 years3 years88%9%3%0%0%4 years5 years6 years7 years8 years15–20 yearsOver 20 years0%10%20%30%40%50%60%70%80%90%100%4 years86%12%2%0%0%5 years89%5%4%0%2%6 years82%14%4%0%0%7 years88%11%2%0%0%8 years65%23%7%0%5%9 years71%20%7%0%2%10–14 years72%14%8%1%5%15–20 years59%19%10%4%8%Over 20 years62%18%5%4%11%
LEGAL SALARY SURVEY 2018Pa r t 2 – B enefitsPA G E 1 3What do you estimate is the annual value of the benefits you receive?BY E M P L OY M E N T T Y P EUp to 10k 10k– 20k 20k– 30k 30k– 40k Over 40kPrivate practiceIn-house0%10%20%30%40%50%60%70%80%Up to 10k 10k– 20k 20k– 30k 30k– 40kOver 40kPrivate practice88%9%3%0%0%In-house59%20%9%3%9%Employment type90%100%
LEGAL SALARY SURVEY 2018Pa r t 3 – Pa r t - time v s F u ll - timePart 3 – Part-time vs Full-timeThe survey shows 85% of respondents work fulltime and 15% of respondents work part-time. 96% ofmen work full-time and 4% of men work part-time.80% of women work full-time and 20% of womenwork part-time.Of those working part-time, most are workingbetween 21–30 hours per week, or more than 30hours per week. This seems to support the mostcommon reason for working part-time which was‘caregiving’ at 72%, where there is a preference forworking 3–4 days or school hours.The number of lawyers working part-timeincreases significantly from 9 years PQE onwards.When analysed by gender, 77% of women and10% of men work part-time to enable caregiving.The main reasons for men choosing to work parttime are ‘don’t need to work full-time’ (28%) and‘to pursue other interests and hobbies’ (25%).It was interesting to note that smaller centresoffer the greatest percentage of part-time rolesat 21% and 22% of roles in their centres. Part-timeroles in Auckland and Wellington account for 13%and 12% of roles respectively.The data confirms how challenging it can be forjunior lawyers to secure their first role, with 50%of respondents in the 0–1 PQE range citing theirreason for working part-time as ‘can’t find a suitablepermanent role’. The other half of respondents inthe 0–1 PQE group gave ‘other’ as the reason forworking part-time, which may be due to continuingstudy.PA G E 1 4
LEGAL SALARY SURVEY 2018Pa r t 3 – Pa r t - time v s F u ll - timePA G E 1 5Do you work full-time or part-time?ALLB Y L O C AT I O NFull-timePart-time15%Part-timeAuckland87% 13%Hamilton87% 13%Tauranga86% 15%Wellington87% 13%Other N.I.Full-time85%79% 22%Christchurch82% 19%Dunedin81% 19%Other S.I.BY G E N D E RFull-timePart-timeWomen80% 20%Men96% 4%GenderFull-timePart-timeWomen80%20%Men96%4%78% n87%13%Tauranga86%15%Wellington87%13%Other North Island centre79%22%Christchurch82%19%Dunedin81%19%Other South Island centre78%22%
LEGAL SALARY SURVEY 2018Pa r t 3 – Pa r t - time v s F u ll - timePA G E 1 6Do you work full-time or part-time?B Y Y E A R S O F P O S T - Q U A L I F I C AT I O N E X P E R I E N C EFull-timePart-timePQE95% 5%0–1 years2 years83% 17%Full-timePart-time0–1 years95%5%2 years83%17%3 years74%26%3 years74% 26%4 years75%25%4 years75% 25%5 years64%36%6 years52%48%7 years55%45%8 years46%54%9 years36%64%10–14 years29%71%15–20 years32%68%Over 20 years35%65%5 years64% 36%6 years52% 48%7 years55% 45%8 years46% 54%9 years36% 64%10–14 years29% 71%15–20 years32% 68%Over 20 years35% 65%BY E M P L OY M E N T T Y P EFull-timePrivate practiceIn-housePart-time86% 14%84% 16%Employment typeFull-timePart-timePrivate practice86%14%In-house84%16%
LEGAL SALARY SURVEY 2018Pa r t 3 – Pa r t - time v s F u ll - timePA G E 1 7What are your hours per week (on average) if you work part-time?ALLB Y L O C AT I O N 10 hours 10hours3% 11–20hours14% 30hours52%11–20 hours21–30 hours 30 hoursAucklandHamiltonTaurangaWellingtonOther N.I.21–30hours52%ChristchurchDunedinOther S.I.0%10%20%30%40%50%60%70%80%90%100%BY G E N D E R 10 hours11–20 hours21–30 hours 30 tion 10 hours11–20 hours21–30 hours 30 %0%56%11%Wellington4%17%47%32%Other North Island 4%0%4%70%26%Gender 10 hours11–20 hours21–30 hours 30 hoursWomen3%15%52%30%Dunedin11%7%46%36%Other South Island centreMen
LEGAL SALARY SURVEY 2018Pa r t 3 – Pa r t - time v s F u ll - timePA G E 1 8What are your hours per week (on average) if you work part-time?BY E M P L OY M E N T T Y P E 10 hours11–20 hours21–30 hours 30 hoursPrivate practiceIn-house0%10%20%Employment type30%40%50%60%70%80%90%100% 10 hours11–20 hours21–30 hours 30 hoursPrivate practice4%16%53%27%In-house2%12%50%37%
LEGAL SALARY SURVEY 2018Pa r t 3 – Pa r t - time v s F u ll - timeWhat are your reasonsfor working part-time?PA G E 1 9B Y L O C AT I O NCaregiverDon't need to work full-timeHave other part-time workALLHave otherCan't find suitablepart-time work permanent role Other2%1%9%To pursue other interests / hobbiesCan't find a suitable permanent roleOtherAucklandHamiltonTaurangaTo pursue otherinterests / hobbies6%WellingtonOther N.I.ChristchurchDon't need towork full-time10%DunedinOther ocationCaregiverDon'tneed toHobbiesOtherP/T workCan'tfind er North Island centre58%10%5%3%3%23%Other South Island centre71%7%4%7%0%11%
LEGAL SALARY SURVEY 2018Pa r t 3 – Pa r t - time v s F u ll - timePA G E 2 0What are your reasons for working part-time?B Y Y E A R S O F P O S T - Q U A L I F I C AT I O N E X P E R I E N C EBY G E N D E R0–1 yearsWomen2 yearsMen0%3 years10%4 years5 years6 years20%30%40%50%Don'tneed to Hob bies60%70%80%OtherCan'tP/T find F/T90%100%GenderCare giverWomen78%8%4%1%1%8%Men11%29%25%14%0%21%PQECare giverOtherCan'tP/T find F/TOtherOther7 years8 years9 years10–14 years15–20 years0–1 yearsOver 20 years0%10%Caregiver20%30%40%50%60%70%Don't need to work full-timeTo pursue other interests / hobbiesHave other part-time workCan't find a suitable permanent roleOther80%90%100%Don'tneed to Hob bies0%0%0%0%50%50%2 years40%30%0%0%0%30%3 years80%0%10%0%10%0%4 years71%0%0%0%0%29%5 years82%0%9%0%0%9%6 years85%0%0%0%0%15%7 years91%0%9%0%0%0%8 years83%17%0%0%0%0%9 years79%11%5%0%5%0%10–14 years86%5%1%0%0%8%15–20 years79%5%7%2%0%8%Over 20 years37%27%16%10%0%11%
LEGAL SALARY SURVEY 2018Pa r t 3 – Pa r t - time v s F u ll - timePA G E 2 1What are your reasons for working part-time?BY E M P L OY M E N T T Y P ECaregiverDon't need to work full-timeHave other part-time workTo pursue other interests / hobbiesCan't find a suitable permanent roleOtherPrivate aregiverDon'tneed toHobbiesOtherP/T workCan'tfind F/TOtherPrivate ment type
LEGAL SALARY SURVEY 2018Pa r t 4 ‑ S ala r y I nc r easePart 4 ‑ Salary IncreaseIn the last 12 months, the majority of respondentsreceived either no salary increase (25%) or 1–3%increase (29%).A higher percentage of part-time workers compared to full-time workers received a nil or 1–3%increase, whereas a greater percentage of full-timeworkers compared to part-time workers receivedan increase of 7–10% or ‘more than 10%’. This datasuggests it is more difficult to achieve a good salaryincrease as a part-time worker.When salary increase is analysed by gender, wesee that female lawyers registered 6 percentagepoints higher than male lawyers for a 1–3% increaseand male lawyers registered 5 percentage pointshigher than female lawyers for a ’more than 10%’increase. This data, combined with the informationrelating to part-time workers, suggests that womencould be significantly disadvantaged when it comesto achieving salary increases.PA G E 2 2
LEGAL SALARY SURVEY 2018Pa r t 4 ‑ S ala r y I nc r easePA G E 2 3Did your base salary increase in the last 12 months and if so, by how much?ALLB Y L O C AT I O NNil1–3%4–6%7–10% 10%Auckland 10%24%HamiltonNil25%TaurangaWellingtonOther edin1–3%Other BY H O U R S W O R K E %20%Wellington23%36%13%10%18%Other North Island edin35%31%10%6%17%Other South Island centre33%23%9%10%25%0%10%20%30%Hours40% 10%50%60%70%80%90%100%Nil1–3%4–6%7–10% 10%Full-time ( 37.5 hours)23%28%11%12%26%Part-time ( 37.5)38%37%10%7%8%4–6% 7–10% 10%
LEGAL SALARY SURVEY 2018Pa r t 4 ‑ S ala r y I nc r easePA G E 2 4Did your base salary increase in the last 12 months and if so, by how much?BY W O R K P L A C ENil1–3%4–6%7–10% 10%Small ( 5 solicitors)WorkplaceMedium (5–20 solicitors)Large ( 20 solicitors)BarristerCommercial / CorporateCentral GovernmentLocal GovernmentNot for profitCommunity % 7–10% 10%Small ( 5 solicitors)39%16%9%15%22%Medium (5–20 solicitors)31%18%11%12%28%Large ( 20 mmercial / Corporate24%46%11%7%13%Central Government25%52%12%4%8%Local Government19%51%6%10%14%Not for Profit22%50%19%6%3%Community Law44%33%0%11%11%
LEGAL SALARY SURVEY 2018Pa r t 5 – J o b T itlesPA G E 2 5Part 5 – Job TitlesTitleThe most commonly occurring legal job titles areSolicitor, Staff Solicitor and Senior Solicitor followedby Associate, Senior Associate, Legal Counsel,Senior Legal Counsel and Lawyer.There were also a range of titles that includedthe word “Adviser”, such as Legal Adviser andChief Legal Adviser, and “Manager”, such as TeamManager, Trust Manager and Senior Manager.CountAverage PQEAverage salary bracketSolicitor7070–1 years 50,000– 59,999Senior Solicitor24910–14 years 100,000– 109,999Associate16610–14 years 80,000– 89,999Senior Associate14110–14 years 150,000– 199,999Legal Counsel91Over 20 years 80,000– 89,999Lawyer64Over 20 years 80,000– 89,999Barrister492 years 50,000– 59,999General Counsel3215–20 years 150,000– 199,999
LEGAL SALARY SURVEY 2018Pa r t 6 – C ha r ge o u t r atesPA G E 2 6Part 6 – Charge out rates 61510–14 years 42 353 64015–20 years 52 351 62520 years 56 340 560LowerMeanUpper 40k 15 149 350 40k– 49k 23 175 345 50k– 59k 24 220 400 60k– 69k 32 235 410 70k– 79k 37 258 475 80k– 89k 42 301 495 90k– 99k 125 307 500 100k– 109k 52 320 555 110k– 119k 130 352 600 120k– 129k 126 371 475 130k– 139k 56 355 525 140k– 149k 134 386 555 150k– 159k 85 438 680 100 470 640 700 363 700 134 650 5459 years 650 346 600 125 600 6808 years 550 329 550 39 500 6007 years 500 327 450 136 450 5006 years 400 303 400 120 350 4555 years 350 279 300 125 300 4754 years 250 252 250 23 200 4953 years 200 290 236 150 190 26 150 232 years 1000–1 years 100Upper 50Mean 50Lower 0PQE 0B Y Y E A R S O F P O S T - Q U A L I F I C AT I O N E X P E R I E N C EBY S A L A RYSalary 200k
LEGAL SALARY SURVEY 2018Pa r t 7 – S ala r y G u idePart 7 – Salary GuideWith around 2500 respondents, the salary tablesprovide good insight into salaries in the legal profession, according to PQE level and across differentlocations and practice types.We would caution against making salary decisions, or petitions for an increase, based solelyon the survey data, as in some instances a lowsample was received, and/or a very wide rangewas given. We would recommend this data beingused in conjunction with market information and,where appropriate, your existing salary data andremuneration strategy.We would encourage you to contact a consultantat Niche Consulting Group to discuss any specificqueries.PA G E 2 7
Pa r t 7 – S ala r y G u idePA G E 2 8South Island 40,000 50,000 89,000 40,000 48,000 69,000 40,000 58,000 89,0002 years 40,000 64,000 89,0003 years 40,000 62,000 89,0003 years 40,000 62,000 79,0004 years 40,000 79,500 99,0004 years 40,000 77,500 129,0005 years 50,000 75,000 99,0005 years 60,000 77,000 89,0006 years 60,000 90,000 109,0006 years * 60,000 85,000 99,0007 years 50,000 71,000 89,0007 years–––8 years 50,000 86,000 129,0008 years * 50,000 95,000 129,000 70,000 83,000 109,0009 years–––10–14 years 40,000 94,000 199,00010–14 years 70,000 110,000 199,00015–20 years 40,000 94,000 199,00015–20 years 70,000 90,000 109,00020 years 50,000 90,000 200,00020 years * 50,0000–1 years 40,000 50,000 89,0000–1 years * 40,000 55,000 69,0002 years 40,000 68,000 89,0002 years 40,000 53,000 69,0003 years 40,000 60,000 79,0003 years 50,000 65,000 89,0004 years 40,000 82,500 199,0004 years * 50,000 85,000 119,0005 years 50,000 67,000 89,0005 years * 90,000 95,000 99,0006 years * 70,000 80,000 109,0006 years–––7 years * 50,000 62,000 79,0007 years–––8 years * 50,000 80,000 99,0008 years–––9 years * 70,000 88,000 109,0009 years–––10–14 years 50,000 89,000 129,00010–14 years 90,000 105,000 129,00015–20 years 40,000 80,000 89,00015–20 years 80,000 115,000 199,00020 years * 40,000 72,000 99,00020 years * 60,000 85,000 109,0000–1 years 40,000 47,000 59,000Christchurch 0–1 years * 40,000 45,000 49,0002 years 40,000 52,000 69,0002 years * 40,000 60,000 89,0003 years * 60,000 65,000 69,0003 years * 50,000 62,000 69,0004 years * 70,000 75,000 79,0004 years * 60,000 65,000 69,0005 years * 70,000 85,000 99,0005 years * 70,000 75,000 79,0006 years–––6 years * 80,000 95,000 109,0007 years 80,000 85,000 89,0007 years * 80,000 85,000 89,0008 years–––8 years–––9 years * 70,000 75,000 79,0009 years–––10–14 years 50,000 77,000 119,00010–14 years–––15–20 years–––15–20 years––– 80,000 85,000 89,000 70,000 85,000 99,00020 years *Wellington20 years * 134,000 200,000 200k 180k 160k 140kUpper 120k0–1 yearsMean 100kAucklandLower 80kPQE 60kSubset 40k 200k 160k 180k 140k 120k* Fewer than 5 respondents2 years9 yearsNorth IslandUpper 100k0–1 yearsMean 80kAll NZLower 60kPQE 40kSubset 20kPrivate Practice – Small firms (fewer than 5 lawyers) 20kLEGAL SALARY SURVEY 2018
Pa r t 7 – S ala r y G u idePA G E 2 9South Island 40,000 53,000 79,0002 years 40,000 65,500 129,000 139,0003 years 50,000 79,000 139,000 119,0004 years 60,000 89,000 119,000 89,000 129,0005 years 60,000 102,000 129,000 50,000 93,000 199,0006 years 60,000 104,000 199,0007 years 60,000 98,000 199,0007 years 80,000 118,000 199,0008 years 70,000 114,000 199,0008 years 70,000 136,000 199,0009 years 70,000 117,000 200,0009 years 90,000 130,000 200,00010–14 years 50,000 117,00015–20 years 40,000 199,00010–14 years 50,000 139,000 113,000 200,00015–20 years 70,000 142,000 200,00020 years 60,000 130,000 199,00020 years 60,000 109,000 199,0000–1 years 199,000 40,000 49,000 79,0000–1 years 40,000 51,000 69,0002 years 40,000 57,000 99,0002 years 50,000 61,000 79,0003 years 40,000 63,000 99,0003 years 50,000 67,000 79,0004 years 40,000 66,000 99,0004 years * 70,000 75,000 89,0005 years 60,000 71,000 79,0005 years 70,000 83,000 109,0006 years 60,000 88,000 119,0006 years 80,000 109,000 199,0007 years 60,000 77,000 89,0007 years * 80,000 97,500 109,0008 years 70,000 92,000 119,0008 years 70,000 115,000 149,0009 years 70,000 97,000 129,0009 years * 80,000 118,000 199,00010–14 years 50,000 108,000 199,00010–14 years 70,000 126,000 199,00015–20 years * 60,000 87,500 119,00015–20 years 40,000 72,000 99,00020 years 70,000 96,000 129,00020 years–––0–1 yearsChristchurch 0–1 years 59,000Wellington 40,000 47,000 69,000 40,000 44,0002 years 40,000 55,000 69,0002 years 40,000 60,000 89,0003 years 50,000 63,000 89,0003 years 50,000 69,000 109,0004 years 40,000 68,000 89,0004 years 50,000 71,000 89,0005 years * 40,000 72,000 89,0005 years * 60,000 88,000 119,0006 years 50,000 76,000 109,0006 years–––7 years * 70,000 85,000 99,0007 years–––8 years * 80,000 98,000 129,0008 years 70,000 75,000 79,0009 years * 110,000 11
LEGAL SALARY SURVEY 2018 INTroDuCTIoN PAGE 4 Niche Consulting Group is proud to partner with the New Zealand Law Society to present this survey of salary and employment trends for 2018. As well as gathering salary information, we asked questions about benefits, part-time work, salary increases, job titles and charge out rates.