Transcription
State of Washington2016 STATE SALARY SURVEYParticipant Report of ResultsApril 2016Copyright 2016 by The Segal Group, Inc. All rights reserved.
Dear Survey Participant:In gratitude for your participation, we are pleased to present these results of the State of Washington 2016 State Salary Survey. This reportreflects results of all 62 participating organizations, which include: 23 private sector employers located in Washington State 26 public sector employers located in Washington State 13 state governmentsWhere applicable, we have segmented the survey results by these three categories.The report contains information regarding: Salary ranges for 183 benchmark jobs in 15 job families Compensation program policies and practices Health and wellness programs Paid leave program policies and practicesSegal Waters Consulting and State Human Resources, Office of Financial Management collaboratively designed the survey questions.SurveyConnect, Inc. developed the website and administered the online survey tool. The survey was distributed on September 21, 2015 andwas closed on October 28, 2015. Segal Waters’ staff audited the data and analyzed the survey responses. All collected data are presented inthis report. The survey requested data in effect as of July 2015.With 24 offices in North American, The Segal Group provides human resources advice and actuarial services to public sector and privatesector employers nationwide. You can learn more about our firm at www.segalco.com.SurveyConnect, Inc. provides 360 assessment and survey applications and services to the Human Resource, Talent Management, OD andCustomer Relationship Management markets. You can learn more about SurveyConnect at www.surveyconnect.com.We hope that this information is useful to your organization. If you have any questions regarding the methodology or study results, pleasecontact me at hkazemi@segalco.com.Thank you!Heather Kazemi, CCP, SPHRVice PresidentBenefits, Compensation and HR Consulting. Member of The Segal Group. Offices throughout the United States and Canada
Ta b l e o f C o n t e n t sState of Washington 2016 State Salary SurveyParticipant Report of ResultsBackground and Methodology . 1Background . 1Participants and Data Sources . 1Benchmarks. 2Study Methodology . 11Section 1 – Organizational Characteristics . 14Participant Type. 14Sector . 14Industry . 15Location . 16Organization Size . 17Union Representation . 19Work Schedule . 21Section 2 – Compensation Practices . 23FY2016 Pay Increases . 23Pay Differentials and Pay Supplements . 32Performance-Based Pay . 45Other Incentive Pay . 53Reimbursements and Perquisites . 60Section 3 – Health and Wellness Programs . 63Prevalence of Health and Wellness Programs, Activities, and Services . 63Wellness Program Participation Rates . 71Impact of Wellness Programs on Health Benefit Claims . 73Metal Tier of Medical Plan . 75i
Section 4 – Paid Leave Practices . 77Type of Program . 77Paid Time Off (PTO) Programs . 79Vacation . 85Sick Leave . 90Holidays . 94Personal Days . 95Section 5 Benchmark Pay Ranges . 96Administrative and Other Support Services . 96Agriculture or Forest Services/Products . 99Arts, Entertainment, or Recreation . 101Construction . 102Educational or Library Services . 105Finance or Insurance . 106Health Care or Social Services/Assistance . 109Hospitality, Accommodation, Food Services, Personal Services . 119Information, IT Services, Media, Communications . 120Professional, Scientific or Technical Services . 122Public Administration . 129Real Estate . 133Retail Trade . 133Transportation or Warehousing . 134Utilities . 137Appendix A – List of Survey Participants . 139Appendix B – Benchmark Job Summaries . 140ii
Background and MethodologyBackgroundState Human Resources, Office of Financial Management is required to conduct a salary survey per RCW 41.06.160. Theprimary purpose of the State Salary Survey is to determine the prevailing pay rates and compensation practices among publicsector and private sector employers.Participants and Data SourcesFor the 2016 survey, invitations went to 133 employers, including 114 entities located in Washington State (73 private sector and41 public sector) and 19 other state governments. We received responses from 62 surveyed organizations, for a total responserate of 47%, as shown in the table below.Organization Type# Surveyed# of ResponsesResponse RatePrivate Sector, In-State732332%Public Sector, In-State412663%State Governments191368%All1336247%A complete list of survey participants is shown in Appendix A starting on page 139.State of Washington 2016 State Salary Survey Participant ReportApril 20161
BenchmarksThe survey included 183 benchmark jobs grouped by the following 15 job families.Job FamilyAdministrative and Other Support Services# of Benchmarks14Agriculture or Forest Services/Products6Arts, Entertainment, or Recreation4ConstructionEducational or Library Services115Finance or Insurance13Health Care or Social Services/Assistance48Hospitality, Accommodation, Food Services, Personal Services3Information, IT Services, Media, Communications8Professional, Scientific or Technical Services34Public Administration17Real Estate1Retail Trade2Transportation or WarehousingUtilitiesTotalState of Washington 2016 State Salary Survey Participant ReportApril 20161161832
Benchmark Job TitlesJob Family and Benchmark TitleAdministrative and Other Support ServicesAdministrative Assistant 3Custodian 2Customer Services Specialist 2Events Coordinator 3Forms & Records Analyst 2Grant & Contract CoordinatorHuman Resource Consultant 2Industrial Relations Agent 2Mail Carrier – DriverManagement Analyst 3PBX & Telephone OperatorProcurement & Supply Specialist 3Program Specialist 2Secretary SeniorAgriculture or Forest Services/ProductsAgricultural Inspector 2Forest Crew Supervisor 1Forest Cruiser & Crafts TechnicianForest Nursery LaborerGrounds & Nursery Services Specialist 2HorticulturistState of Washington 2016 State Salary Survey Participant ReportApril 2016Page # for Result9696969696979797979798989898999999991001003
Job Family and Benchmark TitleArts, Entertainment, or RecreationGraphic DesignerPreservation & Museum Specialist 3Recreation & Athletics Specialist 2Sports Equipment TechnicianConstructionCarpenterConstruction And Maintenance Superintendent 2Construction Project Coordinator 2ElectricianEquipment Operator 2Maintenance Mechanic 2Maintenance Technician n MechanicWelder - FabricatorEducational or Library ServicesCurriculum AdvisorDeaf Interpreter 3Early Childhood Program Specialist 2Instruction & Classroom Support Technician 3Library & Archival Professional 2State of Washington 2016 State Salary Survey Participant ReportApril 2016Page # for 41051051051051054
Job Family and Benchmark TitleFinance or InsuranceActuary 2Audit Specialist - DOT 2Auditor 2Budget Analyst 2Cashier 2Contracts Specialist 2Financial Examiner 3Financial Legal Examiner 2Financial Services Specialist 3Fiscal Technician 2Industrial Insurance Appeals Judge 3Revenue Agent 2Tax Information Specialist 1Health Care or Social Services/AssistanceAdult Training Specialist 3Anesthesiology Technician 2Attendant Counselor 2Clinical Cytogenetic TechnologistClinical/Medical Technologist 2Dental Hygienist 2DentistDiagnostic Medical SonographerDietitian 1Electrocardiograph Technician 2Epidemiologist 1Health Services Consultant 2State of Washington 2016 State Salary Survey Participant ReportApril 2016Page # for 91091091091101101101101101111115
Job Family and Benchmark TitleHistotechnologistHospital Central Services Technician 1Imaging Technologist 2Laboratory Technician 3Licensed Practical Nurse 2Medical Transcriptionist 2Mental Health PractitionerNursing AssistantOccupational Therapist 3Optician, Licensed – DispensingOrthopaedic Technician 1Patient Services CoordinatorPharmacist 2Pharmacy Technician 2Physical Therapist 2Physical Therapy Assistant 2Physician 2Physician 3Physician Asst Certified/Advanced Registered Nurse Practitioner LeadPsychiatric Child Care Counselor 1Psychiatrist 4Psychology AssociatePsychometrist 2Public Health Advisor 2Radiation Therapy DosimetristRegistered Nurse 2Research Technologist 2State of Washington 2016 State Salary Survey Participant ReportApril 2016Page # for 41141141141151151151151151161161161166
Job Family and Benchmark TitleResidential Rehabilitation Counselor 2Respiratory Care SpecialistSafety & Health Specialist 2Social Service Specialist 3Social Worker 2 - Academic Medical CentersSpeech Pathologist/Audiologist Specialist 1Support Enforcement Officer 2Toxicologist 2Vocational Rehabilitation Counselor 2Hospitality, Accommodation, Food Services, Personal ServicesCook 2Food Service Manager 2Laundry Worker 1Information, IT Services, Media, CommunicationsCommunications Consultant 3Communications Officer 1Communications Systems DesignerCommunity Outreach & Environmental Education Specialist 2Digital Printing OperatorElectronic Media ProducerLaw Enforcement Equipment Technician 2Photographer 2State of Washington 2016 State Salary Survey Participant ReportApril 2016Page # for 01201201201211217
Job Family and Benchmark TitleProfessional, Scientific or Technical ServicesArchitect 1Automotive MechanicCartographer 3Chemist 2Civil Engineer 3Claims Officer 2 - Social And Health ServicesDrafting Technician 2Electrical Engineer 3Electronics Technician 2Engineering Technician 2Environmental Control Technician 2Equipment Technician 3Facilities Engineer 2Fish And Wildlife Biologist 2Forensic Scientist 3Hearings Examiner 2Hydrogeologist 3Industrial Hygienist 2Instrument Maker 2Labor Relations Adjudicator/Mediator 2Land Surveyor 3Legal Assistant 2LocksmithMicrobiologist 2Natural Resource Scientist 2 (Or Environmental Scientist)Natural Resource Specialist 2State of Washington 2016 State Salary Survey Participant ReportApril 2016Page # for 41251251251251251261261261261261278
Job Family and Benchmark TitleNatural Resource Technician 2Paralegal 2Property and Evidence CustodianRadiation Health Physicist 3Research Analyst 2Scientific Technician 2Transportation Specialist 2Veterinary Specialist 2Public AdministrationAssistant Fire ChiefCampus Police OfficerCommerce Specialist 2Consumer Program Specialist 2 – UTCCorrections and Custody Officer 2Corrections Specialist 1Elevator Inspector 1Emergency Management Program Specialist 2Employment Security Program Coordinator 2Investigator 2Licensing Services Representative 2Regulatory Analyst 2Retirement Specialist 2Security Guard 2Weights & Measures Inspector 2Workers' Compensation Adjudicator 2Worksource Specialist 2State of Washington 2016 State Salary Survey Participant ReportApril 2016Page # for 01301301311311311311311321321329
Job Family and Benchmark TitleReal EstateProperty & Acquisition Specialist 3Retail TradeLottery District Sales RepresentativeRetail Clerk 2Transportation or WarehousingAircraft MechanicAircraft Pilot 2Commercial Vehicle Enforcement Officer 1Environmental Engineer 3Ferry OperatorMarine EngineerMechanical Engineer SeniorTraffic Safety Systems Operator 3Transportation Planning Specialist 3Truck Driver 2Warehouse Operator 2UtilitiesEnergy/Utilities Engineer 2Nuclear EngineerPlant Manager 2Stationary Engineer 2Utility Worker 2Wastewater Treatment Plant Operator 2Page # for 7137137137137138Benchmark job summaries are in Appendix B starting on page 140.State of Washington 2016 State Salary Survey Participant ReportApril 201610
Study MethodologyAuditing of DataEach survey response was audited for reasonableness, consistency, and clarity. The effective date of the data is July 2015.CalculationsAverage Salary Minimum Sum of all reported salary minimum rates / total number of data pointsAverage Salary Maximum Sum of all reported salary maximum rates / total number of data pointsSalary Midpoint for each respondent (Salary range minimum salary range maximum) / 2Average Salary Midpoint Sum of all salary midpoints / total number of data pointsThe averages for each market segment and the All Respondents average are calculated by calculating the sum of all data pointsin each category (minimum, midpoint, and maximum) and dividing by the total number of data points.Definitions and AcronymsUnion Responses related to employees that are represented by a labor organizationNon-Rep Responses related to employees that are not represented by a labor organizationOT OvertimeOT Eligible Eligible for overtime compensation under the Fair Labor Standards ActOT Exempt Exempt from overtime compensation under the Fair Labor Standards Act# Number of survey responses% Percent of survey responsesState of Washington 2016 State Salary Survey Participant ReportApril 201611
Published DataIn addition to the data collected from individual employers, we also used available market data from the following published datasources: Economic Research Institute’s (ERI) 2015 Salary Assessor Towers Watson Data Services 2015 Compensation Surveys Milliman 2015 Northwest Health Care Salary SurveyAll of the data used from the published sources represent pay data applicable to Washington. The data tables in this reportindicate which benchmark titles include data from these published sources.Rounding of TotalsIn a few instances, the column and row totals in the analysis do not appear to add to 100% due to rounding of the figures.State Government DataThis report includes findings from 13 state governments. These states were chosen based on similarity to Washington in termsof population size and a variety of economic criteria.To account for geographic cost differences between Washington and the surveyed state governments, we applied adjustmentfactors to each state’s reported salary data based on the 2013 Regional Price Parity (RPP) Index produced by the FederalBureau of Economic Analysis.Regional Price Parities (RPPs) measure geographic differences in the price levels of consumption goods and services relative tothe national average. For more information about the RPP index, go p newsrelease.htmState of Washington 2016 State Salary Survey Participant ReportApril 201612
The table below shows the adjustment factors applied to each state’s salary data. To calculate the adjustment factor, we dividedthe Washington State RPP index by each state’s Index. For example, 103.2 (Washington’s RPP Index) divided by 89.2(Missouri’s RPP Index) is 1.156951. We rounded this figure to 1.157 and then multiplied Missouri’s pay rates by this factor. Forexample, if the State of Missouri reported a salary of 40,000, the adjusted salary used in the analysis would be 46,280( 40,000 times 1.157).Regional Price Parity Index and Adjustment th sin92.9111.09%New JerseyWashington1AdjustmentFactor103.2The Bureau of Economic Analysis (BEA) Regional Price Parity (RPP) Index measures geographic differences in the price levels of consumption goods and servicesrelative to the national average. For more information, go to https://www.bea.gov/newsreleases/regional/rpp/rpp newsrelease.htmState of Washington 2016 State Salary Survey Participant ReportApril 201613
Section 1 – Organizational CharacteristicsThe survey included the following questions regarding the survey participants’ organization.Participant TypeParticipant Type# ofResponses% ofResponsesIn-State Private Sector2337%In-State Public Sector2642%State Governments1321%All62100%SectorIs your organization a public sector (governmental) organization or private sector entity?Sector# ofResponses% ofResponsesPrivate Sector2337%Public Sector3963%All62100%State of Washington 2016 State Salary Survey Participant ReportApril 201614
IndustryWhich category most closely reflects your organization's primary industry?Industry# ofResponses% ofResponsesAgriculture or Forest Services/Products (NAIC 11)23%Construction (NAIC 23)23%Educational or Library Services (NAIC 61)58%Health Care or Social Services/Assistance (NAIC 62)610%Manufacturing (NAIC Code: 31-33)23%Professional, Scientific or Technical Services (NAIC 54)46%2744%Retail Trade (NAIC 44-45)23%Transportation or Warehousing (NAIC 48-49)711%Utilities (NAIC 22)58%62100%Public Administration (NAIC 92)AllState of Washington 2016 State Salary Survey Participant ReportApril 201615
LocationIn which location does your organization have the largest number of employees?All Survey Respondents# ofResponsesLocation% ofResponsesPuget Sound Area (King, Pierce, Snohomish counties)Western Washington (excluding the Puget Sound area)Eastern WashingtonOut of State306131348%10%21%21%All62100%In-State Private Sector Respondents# ofResponsesLocation% ofResponsesPuget Sound Area (King, Pierce, Snohomish counties)Western Washington (excluding the Puget Sound area)Eastern Washington171574%4%22%All23100%In-State Public Sector RespondentsLocation# ofResponses% ofResponsesPuget Sound Area (King, Pierce, Snohomish counties)Western Washington (excluding the Puget Sound area)Eastern Washington135850%19%31%All26100%State of Washington 2016 State Salary Survey Participant ReportApril 201616
Organization SizeWhich category includes the total number of paid, full-time equivalent employees (FTEs) in your organization (all locations)?All Survey Respondents# ofResponses% ofResponsesFewer than 199 FTEs1016%200 to 999 FTEs2134%1,000 to 4,999 FTEs1118%5,000 or more FTEs2032%All62100%Size CategoryIn-State Private Sector Respondents# ofResponses% ofResponses522%1043%1,000 to 4,999 FTEs313%5,000 or more FTEs522%23100%Size CategoryFewer than 199 FTEs200 to 999 FTEsAllState of Washington 2016 State Salary Survey Participant ReportApril 201617
In-State Public Sector Respondents# ofResponses% ofResponses519%1142%1,000 to 4,999 FTEs831%5,000 or more FTEs28%26100%Size CategoryFewer than 199 FTEs200 to 999 FTEsAllState Government RespondentsSize Category# ofResponses% ofResponsesFewer than 199 FTEs00%200 to 999 FTEs00%1,000 to 4,999 FTEs00%5,000 or more FTEs13100%All13100%State of Washington 2016 State Salary Survey Participant ReportApril 201618
Union RepresentationApproximately what percentage of your workforce is union represented?All Survey Respondents# ofResponses% ofResponsesNone (0%)1829%Less than 50%1219%Between 51% and 66%1524%Between 67% and 100%1727%All62100%Percent UnionizedIn-State Private Sector Respondents# ofResponses% ofResponses1148%Less than 50%522%Between 51% and 66%522%Between 67% and 100%29%23100%Percent UnionizedNone (0%)AllState of Washington 2016 State Salary Survey Participant ReportApril 201619
In-State Public Sector RespondentsPercent Unionized# ofResponses% ofResponsesNone (0%)28%Less than 50%519%Between 51% and 66%935%Between 67% and 100%1038%All26100%State Government Respondents# ofResponses% ofResponsesNone (0%)538%Less than 50%215%Between 51% and 66%18%Between 67% and 100%538%13100%Percent UnionizedAllState of Washington 2016 State Salary Survey Participant ReportApril 201620
Work ScheduleWhat is the length of regular workweek for most full-time employees (excluding uniformed public safety personnel)?All Survey RespondentsHours per Week# ofResponses% ofResponses35 hours12%37½ hours711%40 hours5487%All62100%In-State Private Sector RespondentsHours per Week# ofResponses% ofResponses35 hours00%37½ hours14%40 hours2296%All23100%State of Washington 2016 State Salary Survey Participant ReportApril 201621
In-State Public Sector RespondentsHours per Week# ofResponses% ofResponses35 hours00%37½ hours28%40 hours2492%All26100%State Government RespondentsHours per Week# ofResponses% ofResponses35 hours18%37½ hours431%40 hours862%13100%AllState of Washington 2016 State Salary Survey Participant ReportApril 201622
Section 2 – Compensation PracticesThe survey included questions regarding the survey participants’ compensation policies and practices. FY2016 Pay IncreasesShift Differentials, Stand-by Pay and Call-Back PayPerformance Pay and Incentive PayReimbursements and PerquisitesFY2016 Pay IncreasesWhat is your organization’s Total Base Pay Increase in FY2016 (not including promotions) for civilian positions in the followingemployee groups?In-StatePrivate SectorIn-StatePublic SectorStateGovernmentsAllRespondents#%#%#%#%OT Eligible, union417%28%215%813%OT Exempt, union626%935%215%1727%OT Eligible, non-rep14%312%215%610%OT Exempt, non-rep29%28%215%610%OT Eligible, union00%00%18%12%OT Exempt, union00%00%18%12%OT Eligible, non-rep00%00%18%12%OT Exempt, non-rep00%00%18%12%Pay IncreaseEmployee GroupNone (0%) 1% of PayState of Washington 2016 State Salary Survey Participant ReportApril 201623
In-StatePrivate SectorIn-StatePublic SectorStateGovernmentsAllRespondents#%#%#%#%OT Eligible, union313%312%18%711%OT Exempt, union14%28%18%46%OT Eligible, non-rep14%312%18%58%OT Exempt, non-rep14%312%18%58%OT Eligible, union14%1038%215%1321%OT Exempt, union14%415%323%813%OT Eligible, non-rep626%519%323%1423%OT Exempt, non-rep626%415%431%1423%OT Eligible, union313%415%00%711%OT Exempt, union313%00%00%35%OT Eligible, non-rep522%415%00%915%OT Exempt, non-rep522%415%00%915%OT Eligible, union00%00%00%00%OT Exempt, union00%00%00%00%OT Eligible, non-rep00%00%00%00%OT Exempt, non-rep00%00%00%00%Pay IncreaseEmployee Group1% 2% of Pay2% 3% of Pay3% 4% of Pay4% 5% of PayState of Washington 2016 State Salary Survey Participant ReportApril 201624
In-StatePrivate SectorIn-StatePublic SectorStateGovernmentsAllRespondents#%#%#%#%OT Eligible, union14%00%00%12%OT Exempt, union00%00%00%00%OT Eligible, non-rep14%00%00%12%OT Exempt, non-rep00%00%00%00%OT Eligible, union417%727%323%1423%OT Exempt, union29%935%323%1423%OT Eligible, non-rep626%1142%538%2235%OT Exempt, non-rep730%1246%538%2439%OT Eligible, union730%00%431%1118%OT Exempt, union1043%28%323%1524%OT Eligible, non-rep313%00%18%46%OT Exempt, non-rep29%14%00%35%Pay IncreaseEmployee Group5% or more of PayTo Be DeterminedNo ResponseState of Washington 2016 State Salary Survey Participant ReportApril 201625
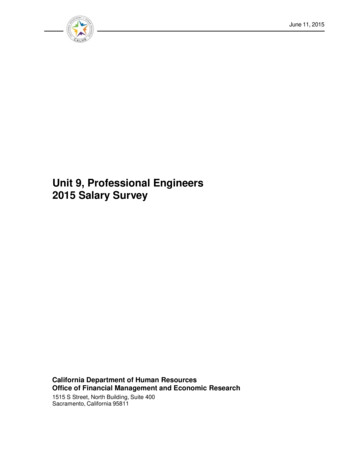
FY2016 Pay Increases forOvertime EligibleUnion Represented Employees40%38%35%31%30%30%27%Percent of %13%8%4%5%4%0% 0%0%None(0%) 1%of Pay0%1% 2%of Pay2% 3%of PayIn-StatePrivateState of Washington 2016 State Salary Survey Participant ReportApril 20163% 4%of PayIn-StatePublic0% 0% 0%4% 5%of Pay0% 0%5%or more0%TBDNo ResponseStateGovernments26
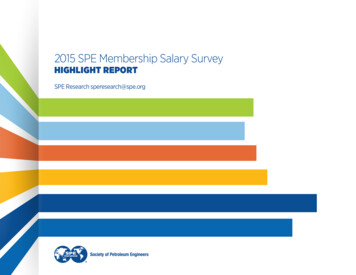
FY2016 Pay Increases forOvertime EligibleNon-Represented Employees45%42%40%38%35%30%26%Percent of 6%8%4%8%8%4%4%0% 0%0%None(0%) 1%of Pay0%1% 2%of Pay2% 3%of PayIn-StatePrivateState of Washington 2016 State Salary Survey Participant ReportApril 20163% 4%of PayIn-StatePublic0% 0% 0%4% 5%of Pay0% 0%5%or more0%TBDNo ResponseStateGovernments27
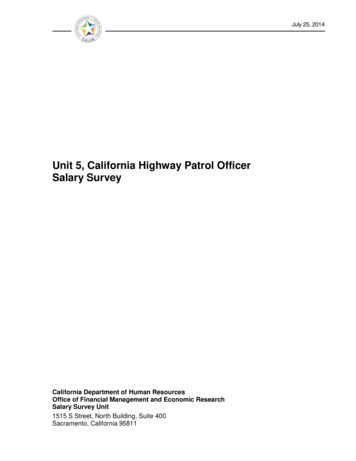
FY2016 Pay Increases forOvertime ExemptUnion Represented Employees50%45%43%40%35%35%35%30%Percent of 9%8% 8%4%0% 0%0%None(0%) 1%of Pay0% 0%1% 2%of Pay2% 3%of PayIn-StatePrivateState of Washington 2016 State Salary Survey Participant ReportApril 20168%3% 4%of PayIn-StatePublic0% 0% 0%0% 0% 0%4% 5%of Pay5%or moreTBDNo ResponseStateGovernments28
FY2016 Pay Increases forOvertime ExemptNon-Represented Employees50%46%45%40%38%35%31%30%30%Percent of %4%5%4%0% 0%0%None(0%) 1%of Pay0%1% 2%of Pay2% 3%of PayIn-StatePrivateState of Washington 2016 State Salary Survey Participant ReportApril 20163% 4%of PayIn-StatePublic0% 0% 0%0% 0% 0%4% 5%of Pay5%or more0%TBDNo ResponseStateGovernments29
FY2016 Pay
State of Washington 2016 State Salary Survey Participant Report April 2016 1 Background and Methodology Background State Human Resources, Office of Financial Management is required to conduct a salary survey per RCW 41.06.160. The primary purpose of the State Salary Survey is to determine the prevailing pay rates and compensation practices .