Transcription
ADVANCINGADVANCINGH EE DESalary Survey 2016Analysis of the pay and benefits received by professionalchemical engineers based in the UK
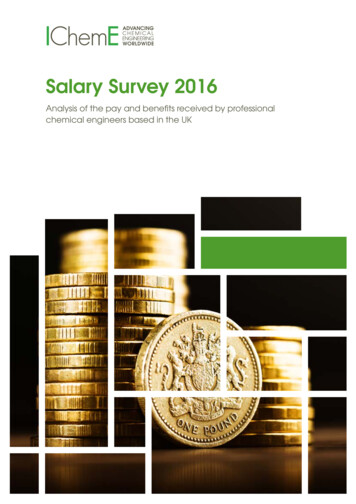
RESOLVE YOUR RECRUITMENT HEADACHESWITH NES GLOBAL TALENTWORLD-LEADERS IN RECRUITMENT FOR THE CHEMICAL INDUSTRYTo find the right people with thespecialist skills, you need thesupport of a talent provider withexperience, expertise and anunrivalled understanding of theChemical Industry.Why NES? The Global RecruitmentPartner for IChemE45 offices across 28 countries500 discipline specific consultantsOver 35 years of Scientific& Engineering experienceWinner of ‘International Recruitmentfirm of the year’ 2015Redefining recruitmentNES Global Talent can offer a full rangeof staffing solutions: Contract, Permanent (Direct) Hire, Managed Solutions, contingencyand project-based, Fully outsourced service.Beyond recruitmentThese services are complemented byan industry leading support service andmobility package to ensure clients keephold of the top talent in a compliantmanner for as long as they need it.Are you looking for. Maintenance Project Services Engineering Production / Operations Safety Construction Commissioning Research andDevelopment.NES can help T: 44 (0)161 942 4000 E: icheme@nesglobaltalent.comWWW.NESGLOBALTALENT.COM
The information in this report is given in good faith and belief in its accuracy, but does not imply the acceptance of anylegal liability or responsibility whatsoever, by the Institution, or by the author, for the consequences of its use or misusein any particular circumstances. This disclaimer shall have effect only to the extent permitted by any applicable law.All rights reserved. No part of this publication may be reproduced or transmitted, in any form or by any means,electronic, mechanical, photocopying, recording or otherwise, without the prior permission of the publisher.Published by:Institution of Chemical Engineers (IChemE)Davis Building, Railway Terrace,Rugby, CV21 3HQ, UKIChemE is a registered charity in England and Wales (214379), and a charity registered in Scotland (SC 039661)IChemE offices in Kuala Lumpur, London, Melbourne, Rugby, Singapore and Wellington 2016 Institution of Chemical EngineersISBN 978-1-911446-00-2in association with:33
ContentsIntroduction5Summary of key findings6Analysis8UK Salary Survey sample12UK Salary Survey notes14Section A15Classified by age, sex, 2015 graduationand highest qualificationTable 1 – employment status16Table 2 – current annual salary or self-employedearnings17Table 3 – benefits in kind for salaried employees19Table 4 – salary or self-employed earnings bymembership grade and sex20Table 5 – salary or self-employed earnings byhighest qualification21Table 6 – salary or self-employed earnings by levelof responsibility – Chartered Membersor Fellows22Table 7 – salary or self-employed earnings by levelof responsibility – Associates23Table 8 – salary or self-employed earnings byindustry sector24Table 9 – salary or self-employed earnings by typeof work26Section B27Classified by membership grade, class ofemployment and level of responsibilityTable 8A – salary or self-employed earnings byindustry sector36Table 8B – salary or self-employed earnings byindustry sector37Table 8C – salary or self-employed earnings byindustry sector38Table 9 – salary or self-employed earnings by typeof work39Section C40Classified by regionTable 1 – employment status41Table 2 – current annual salary or self-employedearnings42Table 3 – benefits in kind for salaried employees44Table 4 – salary or self-employed earnings bymembership grade and sex45Table 5 – salary or self-employed earnings byhighest qualification46Table 6 – salary or self-employed earnings by levelor responsibility – Chartered Membersor Fellows47Table 7 – salary or self-employed earnings by levelof responsibility – Associates48Table 8A – salary or self-employed earnings byindustry sector49Table 8B – salary or self-employed earnings byindustry sector50Table 8C – salary or self-employed earnings byindustry sector5152Table 1 – employment status28Table 9 – salary or self-employed earnings by typeof workTable 2 – current annual salary or self-employedearnings29Section DTable 3 – benefits in kind for salaried employees31Table 4 – salary or self-employed earnings bymembership grade and sex32Table 5 – salary or self-employed earnings byhighest qualification53Classified by industry sectorTable 1A – employment status54Table 1B – employment status5533Table 2A – current annual salary or self-employedearnings56Table 6 – salary or self-employed earnings by levelof responsibility – Chartered Membersor Fellows34Table 2B – current annual salary or self-employedearnings58Table 3A – benefits in kind for salaried employees60Table 7 – salary or self-employed earnings by levelof responsibility – Associates35Table 3B – benefits in kind for salaried employees61
IntroductionIn January 2016, IChemE conducted a salarysurvey of members in the UK. This report containsthe salary data collected and a short summarycomparing the 2016 data to that of previous years.Table 4A – salary or self-employed earningsmembership grade and sex62Table 4B – salary or self-employed earningsmembership grade and sex63Table 5A – salary or self-employed earnings byhighest qualification64Table 5B – salary or self-employed earnings byhighest qualification65Table 6A – salary or self-employed earnings bylevel of responsibility – CharteredMembers or Fellows66Table 6B – salary or self-employed earnings bylevel of responsibility – CharteredMembers or Fellows67Questionnaires were sent to eligible members inJanuary. 1,682 members participated in the survey.Of these, 54% of participants were CharteredMembers.Table 7A – salary or self-employed earnings bylevel of responsibility – Associates68DefinitionsTable 7B – salary or self-employed earnings bylevel of responsibility – Associates69Table 8A – salary or self-employed earnings bytype of work70Table 8B – salary or self-employed earnings bytype of work71Section E72Classified by type of workTable 1 – employment status73Table 2 – current annual salary or self-employedearnings74Table 3 – benefits in kind for salaried employees76Table 4 – salary or self-employed earnings bymembership grade and sex77Table 5 – salary or self-employed earnings byhighest qualification78Table 6 – salary or self-employed earnings bylevel of responsibility – CharteredMembers or Fellows79Table 7 – salary or self-employed earnings bylevel of responsibility – Associates80Table 8A – salary or self-employed earnings byindustry sector81Table 8B – salary or self-employed earnings byindustry sector82Table 8C – salary or self-employed earnings byindustry sector83The survey was also extended to members inAustralia, Malaysia, Ireland, the US, Singapore,South Africa, Canada, United Arab Emirates,India and New Zealand. The sample sizes forthese countries were too small to make accurateassumptions and therefore no reports are available.The basic measure of the survey is the median,which is the half way point: in any chosen group,50% of the group earn more than the median, 50%earn less. The earning distributions of any groupare likely to be skewed – that is, a few in the groupmay earn very high salaries – but it is unlikely thatmany earn much less than the salary offered tonew graduates. Because of the skew, the averageor mean is likely to be higher than the median. Themedian therefore gives a fairer indication of what atypical member of the group is earning. Within anygroup, 10% are paid less than the first decile, 50%are paid more than the median, and 10% are paidmore than the ninth decile.Disclaimer:Where a total doesn’t reconcile, the respondentdid not provide complete information e.g. didnot indicate male or female, age, employmentstatus etc. Please note that this did not impact onthe salary reported, only the overall participationnumber.5
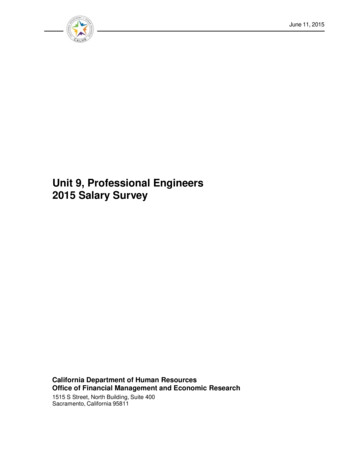
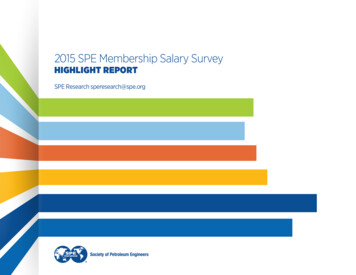
Summary of key findingsSalaries and progressionThe median salary for chemical engineers is 57,000/y (2015: 55,600/y). Since 2006median salaries have increased by 24% (seechart 1). The median salary for a chemicalengineer graduating in 2015 is 28,350 (2014: 30,000/y). This represents a 5.8% decreasefrom 2014, however chemical engineeringremains the best paid engineering disciplinefor UK domiciled students.Gender gapThe percentage of female respondents heldsteady at 18%. Median salaries for women arelargely identical to their male counterparts inthe earlier stages of their career, but widenmarkedly beyond the age of 30 . Caution isadvised due to lower sample sizes of older,female chemical engineers.EducationThe median salaries of Chartered ChemicalEngineers with a first degree ( 76,000/y)are the same as those with a doctorate( 76,000/y). Associate Members with a firstdegree ( 52,000/y) out-earn those with adoctorate ( 45,500/y).Industry comparisonsMedian salaries are highest in the finance andinsurance sector ( 130,000/y), followed bymining and minerals ( 78,363/y), oil refining( 75,000/y) and oil and gas exploration andproduction ( 75,000/y). Graduate chemicalengineers participating in the survey hadmost commonly secured employment in theoil and gas exploration and production sector,followed by chemical and allied products,consulting and oil refining.
Impact of job roleSurvey participants working in a finance orfinancial services role reported the highestmedian salary of 130,000/y. However therelatively small sample size (14) means thatcaution is advised. The 2015 median salariesfor those in the same type of work was 110,000/y. Elsewhere, survey participantsworking in marketing and sales reporteda median salary of 79,425/y (2015: 70,700/y). Those working in constructionand installation roles reported a mediansalary of 68,000/y (2015: 63,500/y).Regional variationThe highest paid chemical engineers can befound in the South East with median salariesof 65,000/y. Survey participants basedin Scotland ( 60,000/y) and North East( 58,000/y) also ranked highly.The highest concentration of chemical andprocess engineers responding were in SouthEast England. The top three industry sectorsin this region are oil and gas exploration andproduction, contracting, and consultancy.North West is where you will find the secondhighest concentration of chemical engineers.The top industry sectors for this region areconsulting and chemical and allied products.Scotland had the third highest concentrationof chemical engineers, with oil andgas exploration and productionfeaturing strongly.Other benefits30% of survey participants reportedreceiving a company final salary or definedbenefit pension, which as significantly lowerthan 46% in 2015. Conversely, companymoney purchase pensions were up to 60%,compared to 42% in 2015. 7% of participantsreported receiving no pension relatedbenefits.75% of participants reported that theiremployer paid their IChemE membershipfees and 60% had their dental andmedical insurance paid. 7
AnalysisChart 1 – 2015 graduatesalaries by industry sector 37.5kOil & gas exploration andproductionAll data refers to k median salary/yChart 2 – ‘The value of the letters’: Chartered engineerversus non-Chartered comparisions 1996–2016 30.0k40.0k2016Pharmaceuticals andpersonal care products mical & allied products 24.2k65.0k37.0k201060.4k36.0k2008Consultancy 27.0k 26.5kWater33.1k200620042002Food and 7k42.5k25.5k40.5k23.5knon-Chartered36.5kChartered
Chart 3 – Salary comparison and year-on-year trend by sector 2015–2016*new industry category introduced in 2016Oil and gas exploration andproductionBiochemical engineeringChemical and alliedproductsConsultancyConsumer productsContractingEducation/UniversitiesFinance, insurance and riskFood and drinkHealth, safety andenvironmentIndustrial gasesIron, steel and other metalsMining and minerals 56.0k 55.0k 51.0k 42.5k 70.0k 55.0k 130.0k 55.0k 63.5k 57.5k 40.0k 78.3k7%Oil refining6%Petrochemicals7%Pharmaceuticals andpersonal care products42%PlasticsPower generation – fossil fuels9%Power generation – nucleardecommissioning10%Power generation – nucleargeneration16%Power generation – renewables16%Process plant and equipment11%Public sector*13%Waste management36%WaterChart 4 – Chemical engineering salary trends 2006–2016Top Decile 120.0k 75.0k 75.0k 61.0k 47.0k 68.0k 58.0k 54.0k 45.0k 58.0k 45.0k 45.5k 59.0k 45.1k 115.0k2%11%3%9%20%8%4%2%3%4%17% 120.0kMedianBottom Decile 96.0k 96.0k 88.0k 78.0k 43.2k 26.0k 47.0k 27.3k 50.0k 28.5k 53.0k 28.8k 56.0k 31.0k 55.6k 30.7k 57.0k 31.0k32006 2008 2010 2012 2014 2015 2016
Chart 5 – Comparison by typeof work 20162015Finance/procurementand supply 110.0kvs2016AnalysisAll data refers to k median salary/y 130.0kChart 6 – Median salaries compared by UK regionMarketing and sales 70.8k 79.4kProject management/general administration/management services 69.0 k 66.7kConstruction andinstallation 63.5k 68.0kProcess safety/safety, health andthe environment 63.0k 63.0k 60.0kEducation and training 62.0k 60.0kOperations 57.1k 59.0k 58.0k 45.0k 57.0kAsset management 55.2k 65.2kManufacture andproduction 55.0k 50.0kBusiness systems/IT and software 54.9k 50.0k 49.0k 54.0k 50.0kRegulatory andcompliance 50.5k 48.0kDesign 50.1k 52.0k 57.0k 65.0k 45.0kResearch anddevelopment 48.0k 55.0k 49.0k
Chart 7 – Female and male salaries compared by age 80.0k45 – 49 61.8k45 – 49 60.0k35 – 39 55.0k35 – 3930 – 34Under 25 48.0k30 – 34 29.0kUnder 25 50.2k 30.0kChart 8 – Chartered engineer v non-Chartered salaries compared by age 85.0k 77.2k 79.6k 74.0k 66.2k 62.0k 62.5k 57.0k 51.5k 46.5k 49.0 45.0kCharterednon-Chartered 36.7k25–29330–3435–3940–4445–4950–54
UK 2016 IChemE SurveyQuestions1. What is your grade ofIChemE membership?6. Where is your primaryplace of work?– Chartered Member or Fellow– Scotland8. What is the mainsector in which youwork?– Associate Member– North East– Biochemical engineering– Affiliate or other– North West– Chemical and allied products– Yorkshire & Humberside– Consultancy– West Midlands– Consumer products– Male– East Midlands– Contracting– Female– East of England– Education/Universities3. What was your age on1 January 2016?– South West– Finance, insurance and risk– South East– Food and drink– Wales– Health, safety and environment– Northern Ireland– Industrial gases2. What is your gender?– Under 25– 25-29– 30-34–Iron, steel and other metals– 35-397. What is your level ofresponsibility?– 40-44– Engineering technician– 45-49– Graduate in training/Engineer intraining/Postdoctoral– Oil refining– Engineer/Supervised teammember/Lecturer– Petrochemicals– 50-54– 55-59– 60-64– 65 4. What is the highestqualification you haveattained?– Doctorate– Senior engineer/Senior lecturer– Manager/Site r/Principal processengineer– Senior manager/Director/Dean/Head of department– Bachelor’s degree– Chairman/Managing director/Chief executive/Vice chancellor/Vice president– Non-graduate, diplomas etc– Consultant5. When did yougraduate?– Other– Master’s degree– In 2015– Before 2015– Non-graduate– Mining and minerals– Oil and gas exploration andproduction– Paper and packaging– Pharmaceuticals and personal careproducts– Plastics– Power generation – fossil fuels– Power generation – nucleardecommissioning– Power generation – nucleargeneration– Power generation – renewables– Process plant and equipment– Public sector (including defence,government and regulatoryauthorities)– Waste management– Water– Other (If other please specify)
9. What is your main type of work?– Asset management– Business systems, IT and software12. What was your total earnedincome (including bonuses), beforetax, in 2015? eg 56000 (no commas,decimal places, , , etc.)– Construction and installation– Design– Finance/financial services/procurement/supply13. What pension related benefitsin kind do you receive from youremployer?– Manufacture and production– Defined benefit pension/company final salary scheme– Marketing and sales– Operations– Defined contribution pension/company moneypurchase scheme– Process safety/safety health and environment– Non-contributory pension– Project management/general administration/management services– Superannuation (Australia/NZ)– Regulations/regulatory compliance– 401k savings plan (US)– Research and development– None– Education and training– Central Providence Fund (Singapore)– Other (If other please specify)10. What is the status of youremployment?14. What other benefits in kind do youreceive from your employer?– Medical and dental insurance– Full time– Car and car allowance– Part time– Company share scheme– Life insurance11. (for those who answered ‘part time’)How many hours per 4 week perioddid you typically work in 2015?(Nearest to the whole number, nodecimals allowed)– Loans– IChemE membership fees– Other professional membership fees– Childcare– None– Other (If other please specify)313
Salary survey notesI. Level of responsibility Engineering technician: A member in employment, likely to be working in a process engineering support role suchas technician or operator but without a formal chemical engineering undergraduate degree-level qualification.Graduate in training/Engineer in training/ Postdoctoral: A member in employment receiving training. Work isdefined in detail and calculation and designs are subject to checking.Engineer/Supervised team member/Lecturer: A member who has completed practical training and now works ina chosen field, generally as a member of a project team, or supervised by a section leader - spot checks are made onthe work, may have technicians or artisans reporting to him or her for experimental work.Senior engineer/Senior lecturer: A member working alone or as a member of a project team with responsibility forthe major part of the project. Only work affecting major areas of safety are checked, responsibility for expenditurewithin the budget. In addition, one who is a senior teacher or lecturer at a college or university with responsibility fora particular course or subject.Manager/Site manager/Project manager/Professor/Associate professor/Principal engineer: A memberworking as a section leader/project manager with responsibility for a major project or section includingresponsibility for the work of the section and for expenditure, i.e. sets the budgets for subordinates. Also professor.Senior manager/Director/Dean/Head of department: A member working as a manager or director withresponsibility for several sections/projects, responsible for expenditure and profit as well as technical aspects of theproject. In addition, one who is a vice-principal at a college or head of department or dean at a university.Chairman/ Managing director/Chief executive/Vice chancellor/Vice president: A member working as amanaging director or chief executive with total responsibility for policy, technical and administrative work, or onewho is principal of a college or vice-chancellor of a university. (‘The buck stops here’).Consultant:. A member who is either self-employed, or employed by others, providing professional advice andservices to another party (client).II. Total earned income - salaried employmentPlease enter the rate of annual earnings in the specified currency on the 1 January 2016 from salaried employment inaccordance with the notes below:1. Income Tax and National Insurance contributions or contributions you make under a group superannuation schemeshould be included.2. Any insurance or superannuation contribution paid by an employer should be excluded.3. Benefits in kind (e.g. employer contributions to pension schemes, use of car, sickness or accident insurance cover,accommodation at a nominal rent) should be excluded.4. ‘Current Annual Salary’ should be taken to mean:a) the basic rate of annual salary received from the sole or principal employer on 1 January 2016; plusb) bonus payments including ‘thirteenth month’ payments. Director’s or manager’s fees, share of profits, commission,and other honoraria received from the sole or principal employer, during 2015.5. Refunds of expenses incurred should be excluded.
Section AClassified by age, sex, 2015graduation and highestqualification15
Section A Classified by age, sex, 2015 graduation and highestqualificationSECTION A / TABLE 1 : EMPLOYMENT STATUSTotalTotalFull timePart timeAge BandUnder 2525-2930-3435-3940-4445-4950-5455-5960-6465 Graduate 2015Highest 5%6%4%4%23%70%0%9%3%5%0%3%12%16
Section A Classified by age, sex, 2015 graduation and highestqualificationSECTION A / TABLE 2 : CURRENT ANNUAL SALARY OR SELF EMPLOYED EARNINGSTotalAge BandGraduate2015GenderHighest QualificationUnder 2525-2930-3435-3940-4445-4950-5455-5960-6465 16821393092131982042082031246420 16K10411001111 16K220000000 18K31000000 19K1100000 20K623000 21K30101 22K54000 23K3200 24K521 25K189 26K116 27K5 28K30 29K 30K 31K18761012100024122099 32K351119310000103129502312 0010011732550276 34K2461042000020221840186 35K2871650000000012430235 36K39426321201001033602910 37K3041772000000112450246 38K2831363102000022330208 39K191104220000016130013 40K13810532819123101113169329010632 45K11912633221683361111693728435 50K107019271912157323013603318621 55K11801716271518101041113614229622 60K950419141511161141012414208312 65K7802121015151473007314006117 70K79011191116141430010293916811 75K6700681416146210620410616 80K60114101112126210922290537 85K4501278983610914220414 90K5100271512105000421260474 95K35000951045111314180323 100K300044285430177160273 105K2900036765110111170290 110K230012542351031190212 115K180001437210006120180SECTION A / TABLE 2 : CURRENT ANNUAL SALARY OR SELF EMPLOYED EARNINGSTotalCont'dGraduate2015Age BandUnder 2525-2930-3435-3940-4445-4950-5455-5960-6465 6Highest adMaleFemale 120K370123411113200714160343 125K200001259210119100191 130K15001260231000690150 135K12010111142101470111 140K13000120820004450130 145K700001222000142070 150K41001069165400317192401 200K17000042442101691161 60,1861st 0032,40028,0009th 130,000160,000125,00080,00045,00017
75K6700681416146210620410616 80K60114101112126210922290537 716027310111170290 90K 95K 100K 105K 110K35000510451SectionA Classifiedbyage,94 sex, fication51 06120180SECTION A / TABLE 2 : CURRENT ANNUAL SALARY OR SELF EMPLOYED EARNINGSTotalCont'dGraduate2015Age BandHighest QualificationGenderUnder 2525-2930-3435-3940-4445-4950-5455-5960-6465 DoctorateMastersBachelorsNon-gradMaleFemale 120K370123411113200714160343 125K200001259210119100191 130K15001260231000690150 135K12010111142101470111 140K13000120820004450130 145K700001222000142070 150K41001069165400317192401 200K 0047,50071,00055,00060,18645,0001st 0032,40028,0009th 130,000160,000125,00080,00018
Section A Classified by age, sex, 2015 graduation and highestqualificationSECTION A / TABLE 3 : BENEFITS IN KIND FOR SALARIED EMPLOYEESTotal401k savings plan (US)Age BandUnder 2525-2930-3435-3940-4445-4950-5455-5960-6465 Graduate 2015Highest %0%0%0%1%0%2%0%0%0%0%1%0%0%0%Central Providence %0%0%0%0%5%0%0%0%0%0%0%0%Defined benefit pension/Companyfinal salary 1320065%Defined contributionpension/Company money purchaseschemeNon-contributory pensionNoneMedical and dental insuranceCar or car allowanceCompany share schemeLife insuranceLoansIChemE membership feesOther professional 4112%3%5%5%2%3%3%3%3%2%2%10%4%3%3%3%36%3%4%19
Section A Classified by age, sex, 2015 graduation and highestqualificationSECTION A / TABLE 4 : SALARY OR SELF EMPLOYED EARNINGS BY GRADE AND SEXTotalTotalChartered MembersMale30-3435-3940-4445-4950-5455-5960-6465 Graduate 2015Highest 4,40692,367112,02792,37162,2961st 0047,50036,0579th 16730,26452,91442,71163,02569,10050,20043,2551st 029,00026,0009th 9869,65030,87675,27765,65487,01280,80775,0241st 0032,4009th lNon-Chartered MembersAge BandUnder 6651,73245,21765,62350,9081st ,73636,000135,00024,50030,00028,00033,00028,0009th 0
Section A Classified by age, sex, 2015 graduation and highestqualificationSECTION A / TABLE 5 : SALARY OR SELF EMPLOYED EARNINGS BY LEVEL OF RESPONSIBILITY - HIGHEST dAge BandUnder 2525-2930-3435-3940-4445-4950-5455-5960-6465 01014362325291695Graduate 2015GenderHighest 0,0001st ,00048,00050,00028,00038,00040,00030,0009th 0Total8951182631589498605
UK Salary Survey noest Section A Classified by age, sex, 2015 graduation and highest qualification Table 1 - employment status Table 2 - current annual salary or self-employed . In January 2016, IChemE conducted a salary survey of members in the UK. This report contains the salary data collected and a short summary