Transcription
Regression-BasedTests for ModerationBrian K. Miller, Ph.D.1Presentation Objectives1. Differentiate between mediation & moderation2. Differentiate between hierarchical and stepwiseregression3. Run and interpreting hierarchical regression in SPSS4. Compute interaction terms5. Mean center variables6. Graphing interactions21
1. Differentiate betweenmediation and moderation3Moderation vs. Mediation§ : third variable that affects strength ofrelationship between two other variables§ Ex: relationship between performance and salarygender§ Ex: relationship between X1 and Y is strong, especially ifX2 is also strong§ : third variable that acts asbetween two other variables§ Ex: performance mediates relationship between jobknowledge and salary§ Ex: X1 “causes” X2 which “causes” Y42
n63
2. Differentiate betweenhierarchical regression &stepwise regression7Hierarchical Regression§ Variables entered in equation at various stages§ Important statistics and tests§ Change in R2 (i.e. )§ Change in F-score (i.e. ΔF)§ Overall equation§ Uses:§ variables§ Interaction terms§ NOT same as regression84
Stepwise Regression§ All variables entered at one stage§ Software enters every of variables§ Seeks to R2§ Capitalizes on chance characteristics of THISsample L § Like throwing spaghetti against the wall to see whatsticks L § Not recommended by some journals93. Run hierarchicalregression in SPSS105
SPSS Example #1§ § § Click “Analyze” / “Regression” / “Linear”Choose “DV1” as Dependent VariableChoose “Control1”, “Control2” as IVs§ § § § § § § Is there theoretical rationale for these control variables?However, no need for stated hypothesesClick “Next”Choose “IV1”, “IV2” as Independent VariablesClick “Statistics”Put check in box for “R squared change”Click “Continue”, click “OK”11126
4. Compute InteractionTerms13Review DiagramIV 1DV 1147
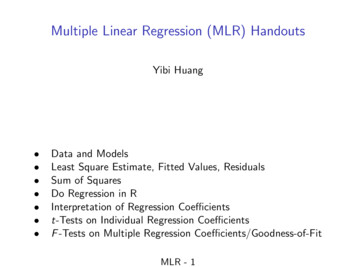
Reconceptualizing Diagram as 2 x 2HighLowDVMedium DVMedium DVDVLowIV 1HighIV 215Caution!§ Never continuous variables (e.g.cutting in half at the median)§ Results in loss of useful information§ Treats scores close to each other as if far from eachother§ In , no need to dichotomize since allIVs are categorical§ subsumes ANOVA§ But, different method of creating interaction termsneeded168
# ObservationsProblem:Continuous Variable1561017DV ScoresModeration Effects§ Strength of relationship between IV and DVModerator§ If one is low on the moderator (IV2) the correlationbetween IV1 and DV is different from same correlationfor those high on moderator (IV2)§ In regression§ § correlations manifest themselves as , orof lines§ So slope of lines is different based upon gender§ Caution: Moderating variables is ALSO an IV189
Moderation Effects (cont’d)§ MUST include bot (i.e.both IVs) in regression before including(cross product ofIV1 and IV2)§ Hierarchical regression model 1 has bothmain effects but NO interaction term§ Hierarchical regression model 2 has maineffects PLUS interaction term19Example Hypothesis1. There is an interaction effect between IV1and IV2 in the prediction of DV, such thathigh levels of IV1 combined with high levelsof IV2 will lead to higher levels of DV thanwill low levels of either or both of IV1 andIV2.2010
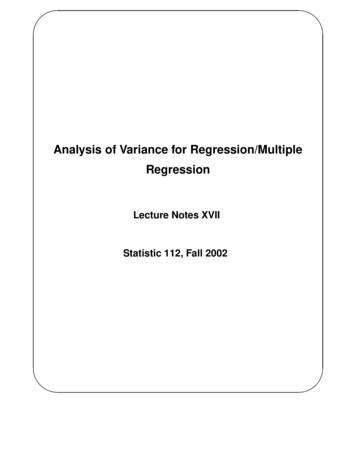
Alternatively Written Hypotheses2. The strength of the relationship between IV1and DV depends upon IV2, such that IV1 isstrongest when IV2 is high and weakestwhen IV2 is low.3. There is a positive relationship between IV1and DV especially if IV2 is also high.21Plotting Interactions(r .6)DV(r -.2)IV12211
Creating Multiplicative Terms§ Most (but not all!) IVs in regression are§ For 2 IVs, create third term that serves asinteraction§ Simply both IVs to create new term§ Heads up: sometimes new term iswith component terms23Collinearity Issues§ Product of two variables is almost always collinearwith its§ When two variables are so strongly correlated witheach other that they affect interpretation ofregression§ Can make exceed 1.0L § Tolerance / (VIF)§ Tolerance is reciprocal of VIF§ Collinearity indicated if:§ § Tolerance .10, or VIF 102412
SPSS Example #2:Moderated Multiple Regression§ § § § § § § § § Click Analyze/Regression/Linear or Dialog Recall buttonClick “Reset” to start with all new variables (i.e. remove thecontrol variables previously used)Choose “DV1” as DVChoose “IV1” and “IV2” as IVsClick “Next”Choose new term “IV1xIV2” (interaction term alreadycreated from product of two IVs above) as only IV in secondstep of hierarchical regression modelClick “Statistics”Put check in boxes for “R square change” and “CollinearityDiagnostics”Click “Continue”, click “OK”252613
5. Mean CenteringVariables27Mean Centering Variables§ Mean centering of variables reduces impact of§ This is NOT same as variables!§ Allows for better interpretation of regression weights§ Requires:§ Calculation of of the variable§ Creation of new variable that § is between measured variable and meanof variable2814
293015
316. Graphing Interactions3216
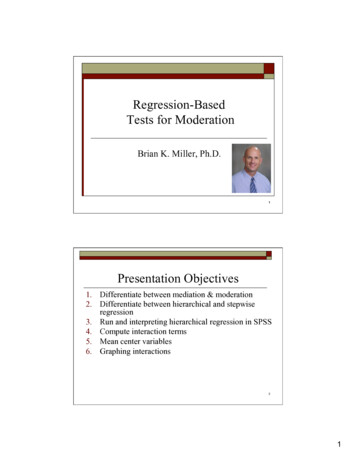
Graphing Interactions§ DV on (Y) axis§ IV on (X) axis§ Calculate values of Moderator (other IV) 1 sd aboveand below mean§ Calculate values of IV 1 sd above and below mean§ Insert value of Moderator at lower sd in§ Insert value of Moderator at upper sd in regressionequation33Using Regression Formula toPlot InteractionsUse the regression equation:Y 2.708 - .667IV1 - .333IV2 .481IV1IV2Find 4 different values (points) for Y3417
Using Regression Formula (cont’d)§ Calculate one equation for:§ § § Insert value of IV2 at 1sd above meanInsert value of IV1 at 1sd above meanCalculate another equation for:§ § § Insert value of IV2 at 1sd below meanInsert value of IV1 at 1sd below meanCalculate one equation for:§ § § Insert value of IV2 at 1sd above meanInsert value of IV1 at 1sd below meanCalculate another equation for:§ § § Insert value of IV2 at 1sd below meanInsert value of IV1 at 1sd above meanConnect the dots (i.e. draw the line segments)35Sample Graph5Dependent variable4.543.53Low IV2High IV22.521.51Low IV1High IV13618
Using Online Calculators Instead§ See http://www.jeremydawson.co.uk/slopes.htm373819
Things We Learned1. Mediation and moderation are very different2. Hierarchical regression is NOT stepwiseregression3. Interpreting hierarchical regression output iseasy4. Computing interaction terms is just simplemultiplication5. Mean centered variables offset collinearity6. Graphing interactions is easier with Excel39That’s all folks!!!BrianMillerPhD@gmail.com4020
Regression-Based Tests for Moderation Brian K. Miller, Ph.D. 2 Presentation Objectives 1. Differentiate between mediation & moderation 2. Differentiate between hierarchical and stepwise regression 3. Run and interpreting hierarchical regression in SPSS 4. Compute interaction terms 5. Mean center variables 6. Graphing interactions