Transcription
Multilevel Modeling With LatentVariables Using MplusLinda K. MuthénBengt MuthénCopyright Muthén & Muthénwww.statmodel.com1Table Of ContentsGeneral Latent Variable Modeling FrameworkAnalysis With Multilevel DataMultilevel Regression AnalysisNumerical IntegrationTwolevel Path AnalysisTwolevel Factor AnalysisTwolevel SEMMultilevel EstimationPractical Issues Related To The Analysis Of Multilevel DataMultivariate Modeling of Family MembersTwin ModelingMultilevel Mixture ModelingMultilevel Growth ModelsMultilevel Two-Part Growth ModelingMultilevel Growth Mixture ModelingMultilevel Discrete-Time Survival 32
General Latent Variable Modeling Framework3General Latent Variable Modeling Framework4
Analysis With Multilevel DataUsed when the data have been obtained by cluster samplingand/or unequal probability sampling to avoid biases inparameter estimates, standard errors, and tests of model fitand to learn about both within- and between-clusterrelationships.Analysis Considerations Sampling perspective Aggregated modeling – SUDAAN TYPE COMPLEX– Stratification, sampling weights, clustering(Asparouhov, 2005)5Analysis With Multilevel Data (Continued) Multilevel perspective Disaggregated modeling – multilevel modeling TYPE TWOLEVEL Multivariate modeling TYPE GENERALAnalysis Areas Multilevel regression analysis Multilevel path analysis Multilevel factor analysis Multilevel SEM Multilevel latent class analysis Multilevel growth modeling Multilevel 2-part growth modeling Multilevel growth mixture modeling6
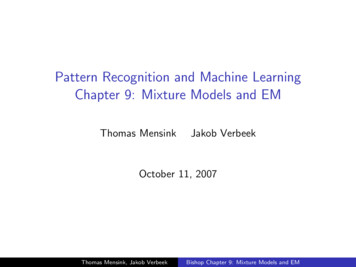
Cluster-Specific Regressionsyij ß0j ß1j xij rijß0j γ00 γ01 wj u0jß1j γ10 γ11 wj u1jβ0yj 1j 2j 3β1wxw7Multilevel Regression Analysis With RandomIntercepts And Random Slopes In Multilevel TermsTwo-level analysis (individual i in cluster j):yij : individual-level outcome variablexij : individual-level covariatewj : cluster-level covariateRandom intercepts, random slopes:Level 1 (Within) : yij ß0j ß1j xij rij ,Level 2 (Between) : ß0j γ00 γ01 wj u0j ,Level 2 (Between) : ß1j γ10 γ11 wj u1j .(8)(9)(10) Mplus gives the same estimates as HLM/MLwiN ML (not REML): V (r)(residual variance for level 1), γ00 , γ01, γ10 , γ11 , V(u0), V(u1), Cov(u0, u1) Centering of x: subtracting grand mean or group (cluster) mean Model testing with varying covariance structure, marginal covariance matrixfor y8
WithinfemaleBetweenper advam92privates1catholics2s1m92s2stud sesmean ses9Input For Multilevel Regression ModelTITLE:multilevel regressionDATA:FILE IS completev2.dat;! National Education Longitudinal Study (NELS)FORMAT IS f8.0 12f5.2 f6.3 f11.4 23f8.2f18.2 f8.0 4f8.2;VARIABLE: NAMES ARE school r88 m88 s88 h88 r90 m90 s90 h90 r92m92 s92 h92 stud ses f2pnlwt transfer minor coll aspalgebra retain aca back female per mino hw timesalary dis fair clas dis mean col per high unsafenum frie teaqual par invo ac track urban size ruralprivate mean ses catholic stu teac per adva tea excetea res;USEV m92 female stud ses per adva private catholicmean ses;!per adva percent teachers with an MA or higherWITHIN female stud ses;BETWEEN per adva private catholic mean ses;MISSING blank;CLUSTER school;CENTERING GRANDMEAN (stud ses);10
Input For Multilevel Regression ModelANALYSIS: TYPE TWOLEVEL RANDOM MISSING;MODEL:%WITHIN%s1 m92 ON female;s2 m92 ON stud ses;%BETWEEN%s1 WITH m92; s2 WITH m92;m92 s1 s2 ON per adva private catholic mean ses;OUTPUT:TECH8 SAMPSTAT;11Output Excerpts For Multilevel RegressionModel (Continued)N 10,933Summary of DataNumber of clusters902Size (s) Cluster ID with Size 91047555806758774585412
Output Excerpts For Multilevel RegressionModel 5164375115Average cluster sizeEstimated 7212.187Correlations for the Y VariablesIntraclassVariable CorrelationM92130.107Output Excerpts For Multilevel RegressionModel (Continued)Tests of Model FitLoglikelihoodH0 Value-39390.404Information CriteriaNumber of Free parameters21Akaike (AIC)78822.808Bayesian (BIC)78976.213Sample-Size Adjusted BIC78909.478(n* (n 2) / 24)Model ResultsEstimatesWithin LevelResidualVariancesM92Between LevelS1ONPER ADVAPRIVATECATHOLICMEAN 4
Output Excerpts For Multilevel RegressionModel (Continued)S2ONPER ADVAPRIVATECATHOLICMEAN SESM92ONPER ADVAPRIVATECATHOLICMEAN SESS1WITHM92S2WITHM92InterceptsM92S1S2Residual 5278.6494.0660.58315Random Slopes In single-level modeling random slopes ßi describe variation acrossindividuals i,yi αi ßi xi εi ,(100)αi α ζ0i ,(101)ßi ß ζ1i ,(102)Resulting in heteroscedastic residual variances(103)V ( yi xi ) V ( ßi ) xi2 θ . In two-level modeling random slopes ßj describe variation acrossclusters jyij aj ßj xij εij ,(104)aj a ζ0j ,(105)ßj ß ζ1j ,(106)A small variance for a random slope typically leads to slow convergence of theML-EM iterations. This suggests respecifying the slope as fixed.Mplus allows random slopes for predictors that are Observed covariates Observed dependent variables (Version 3) Continuous latent variables (Version 3)16
Numerical IntegrationNumerical integration is needed with maximum likelihoodestimation when the posterior distribution for the latent variablesdoes not have a closed form expression. This occurs for models withcategorical outcomes that are influenced by continuous latentvariables, for models with interactions involving continuous latentvariables, and for certain models with random slopes such asmultilevel mixture models.When the posterior distribution does not have a closed form, it isnecessary to integrate over the density of the latent variablesmultiplied by the conditional distribution of the outcomes given thelatent variables. Numerical integration approximates this integrationby using a weighted sum over a set of integration points (quadraturenodes) representing values of the latent variable.17Numerical Integration (Continued)Numerical integration is computationally heavy and thereby timeconsuming because the integration must be done at each iteration,both when computing the function value and when computing thederivative values. The computational burden increases as a functionof the number of integration points, increases linearly as a functionof the number of observations, and increases exponentially as afunction of the dimension of integration, that is, the number of latentvariables for which numerical integration is needed.18
Practical Aspects Of Numerical Integration Types of numerical integration available in Mplus with orwithout adaptive quadrature Standard (rectangular, trapezoid) – default with 15 integrationpoints per dimension Gauss-Hermite Monte Carlo Computational burden for latent variables that need numericalintegration One or two latent variablesLight Three to five latent variablesHeavy Over five latent variablesVery heavy19Practical Aspects Of Numerical Integration(Continued) Suggestions for using numerical integration Start with a model with a small number of random effects andadd more one at a time Start with an analysis with TECH8 and MITERATIONS 1 toobtain information from the screen printing on the dimensionsof integration and the time required for one iteration and withTECH1 to check model specifications With more than 3 dimensions, reduce the number ofintegration points to 5 or 10 or use Monte Carlo integrationwith the default of 500 integration points If the TECH8 output shows large negative values in thecolumn labeled ABS CHANGE, increase the number ofintegration points to improve the precision of the numericalintegration and resolve convergence problems20
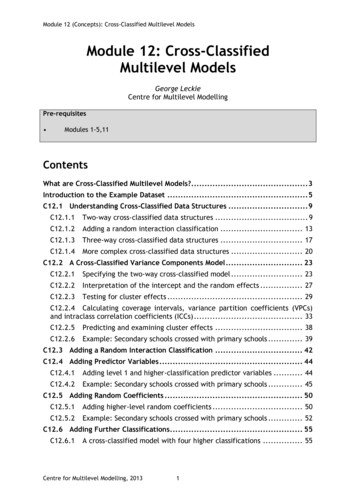
WeightNumerical IntegrationPointsWeightNonparametric Estimation Of TheRandom Effect DistributionPoints21Twolevel Path AnalysisWith Categorical Outcomes22
Logistic tdroptht7hispblackmath7math10Path tht7hispblackmath7hsdropmath10hsdrop23Two-Level Path ophsdrop24
Input For A Twolevel Path Analysis Model WithA Categorical Outcome And Missing Data OnThe Mediating VariableTITLE:DATA:VARIABLE:ANALYSIS:a twolevel path analysis with a categorical outcomeand missing data on the mediating variableFILE lsayfull dropout.dat;NAMES female mothed homeres math7 math10 expelarrest hisp black hsdrop expect lunch droptht7schcode;MISSING ALL (999);CATEGORICAL hsdrop;CLUSTER schcode;WITHIN female mothed homeres expect math7 lunchexpel arrest droptht7 hisp black;TYPE TWOLEVEL MISSING;ESTIMATOR ML;ALGORITHM INTEGRATION;INTEGRATION MONTECARLO (500);25Input For A Twolevel Path Analysis Model WithA Categorical Outcome And Missing Data OnThe Mediating Variable (Continued)MODEL:%WITHIN%hsdrop ON female mothed homeres expect math7 math10lunch expel arrest droptht7 hisp black;math10 ON female mothed homeres expect math7 lunchexpel arrest droptht7 hisp black;%BETWEEN%hsdrop*1; math10*1;OUTPUT:PATTERNS SAMPSTAT STANDARDIZED TECH1 TECH8;26
Output Excerpts A Twolevel Path Analysis ModelWith A Categorical Outcome And Missing DataOn the Mediating VariableSummary Of DataNumber of patternsNumber of clustersSize (s)1213363839404142434445244Cluster ID with Size 4127Output Excerpts A Twolevel Path Analysis ModelWith A Categorical Outcome And Missing DataOn the Mediating Variable (Continued)Size (s)4647495051525355575859738993118Cluster ID with Size 0512111910430230911511830113628
Output Excerpts A Twolevel Path Analysis ModelWith A Categorical Outcome And Missing DataOn the Mediating Variable (Continued)Model ResultsWithin 18-0.086S.E. 40.1210.0070.074-0.016-0.01329Output Excerpts A Twolevel Path Analysis ModelWith A Categorical Outcome And Missing DataOn the Mediating Variable 369S.E. 010-0.00930
Output Excerpts A Twolevel Path Analysis ModelWith A Categorical Outcome And Missing DataOn the Mediating Variable (Continued)EstimatesResidual VariancesMATH1062.010Between LevelMeansMATH10ThresholdsHSDROP 1VariancesHSDROPMATH10S.E. 2482.1503.0110.2863.7571.0001.00031Twolevel Factor AnalysisWith Categorical Outcomes32
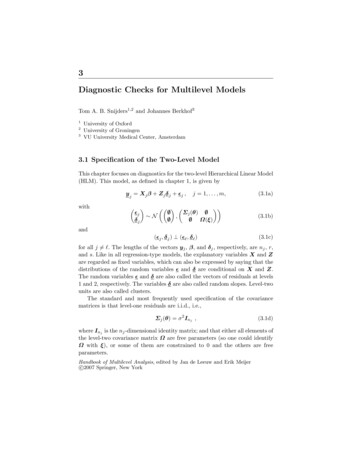
Withinu1u2u3fwBetweenu4u1u2u3u4fb33Input For A Two-Level Factor Analysis ModelWith Categorical OutcomesTITLE:DATA:VARIABLE:ANALYSIS:this is an example of a two-level factor analysismodel with categorical outcomesFILE catrep1.dat;NAMES ARE u1-u6 clus;CATEGORICAL u1-u6;CLUSTER clus;TYPE TWOLEVEL;ESTIMATION ML;ALGORITHM INTEGRATION;MODEL:%WITHIN%fw BY u1@1u2 (1)u3 (2)u4 (3)u5 (4)u6 (5);34
Input For A Two-Level Factor Analysis ModelWith Categorical OutcomesOUTPUT:%BETWEEN%fb BY u1@1u2 (1)u3 (2)u4 (3)u5 (4)u6 (5);TECH1 TECH8;BWλ fij λ (f j f ij)35Output Excerpts Two-Level Factor AnalysisModel With Categorical OutcomesTests Of Model FitLoglikelihoodHO ValueInformation CriteriaNumber of Free ParametersAkaike (AIC)Bayesian (BIC)Sample-Size Adjusted BIC(n* (n 2) / 24)-3696.117137418.2357481.5057440.21736
Output Excerpts Two-Level Factor AnalysisModel With Categorical Outcomes (Continued)Model ResultsEstimatesS.E. Est./S.E.Within 16.4496.439VariancesFW0.8340.1914.36037Output Excerpts Two-Level Factor AnalysisModel With Categorical Outcomes (Continued)Between LevelFBBYU1U2U3U4U5U6ThresholdsU1 1U2 1U3 1U4 1U5 1U6 1VariancesFBEstimatesS.E. .4960.1393.56238
Two-Level Factor Analysis with y4y5y5y6y639NELS Data The Data—National Education Longitudinal Study(NELS:88) Base year Grade 8—followed up in Grades 10 and 12 Student sampled within 1,035 schools—approximately26 students per school Variables—reading, math, science, history-citizenshipgeography, and background variables Data for the analysis—reading, math, science, historycitizenship-geography, gender, individual SES, schoolSES, and minority status40
1 m2 m3 m4maths1s2 s3 s4sch1 h2 h3hcgsesgenderWithin41Twolevel SEM: Random SlopesFor Regressions Among Factors42
y3y7y4y8xs43Input For A Twolevel SEMWith A Random SlopeTITLE:a twolevel SEM with a random slopeDATA:FILE etaeta3.dat;VARIABLE:NAMES ARE y1-y8 x clus;CLUSTER clus;BETWEEN x;ANALYSIS:TYPE TWOLEVEL RANDOM MISSING;ALGORITHM INTEGRATION;44
Input For A Twolevel SEMWith A Random Slope (Continued)MODEL:%WITHIN%f1w BY y1@1y2 (1)y3 (2)y4 (3);f2w BY y5@1y6 (4)y7 (5)y8 (6);s f2w ON f1w;OUTPUT:%BETWEEN%f1b BY y1@1y2 (1)y3 (2)y4 (3);f2b BY y5@1y6 (4)y7 (5)y8 (6);f2b ON f1b;s ON x;TECH1 TECH8;45Output Excerpts Twolevel SEMWith A Random SlopeTests Of Model FitLoglikelihoodHO ValueInformation CriteriaNumber of Free ParametersAkaike (AIC)Bayesian (BIC)Sample-Size Adjusted BIC(n* (n 2) / 24)-12689.5573025439.11425585.12225489.84346
Output Excerpts Twolevel SEMWith A Random Slope (Continued)Model ResultsEstimatesWithin LevelF1WBYY1Y2Y3Y4F2WBYY5Y6Y7Y8F1WWITHF2WS.E. 47Output Excerpts Twolevel SEMWith A Random Slope dual 2Y70.941Y81.076S.E. 718.29216.19117.83548
Output Excerpts Twolevel SEMWith A Random Slope (Continued)(EstimatesBetween LevelF1BBYY1Y2Y3Y4F2BBYY5Y6Y7Y8F2BONF1BS.E. 849Output Excerpts Twolevel SEMWith A Random Slope (Continued)(EstimatesSS.E. 1BResidual 0.0560.0884.2114.75650
Multilevel Modeling With A RandomSlope For Latent VariablesStudent (Within)y1y2y3School (Between)y2ibsby3y4y4ssiwy1sww51Multilevel Estimation, Testing, Modification,And IdentificationEstimators Muthén’s limited information estimator (MUML) – randomintercepts ESTIMATOR MUML Muthén’s limited information estimator for unbalanced data Maximum likelihood for balanced data Full-information maximum likelihood (FIML) – randomintercepts and random slopes ESTIMATOR ML, MLR, MLF Full-information maximum likelihood for balanced andunbalanced data Robust maximum likelihood estimator MAR missing data Asparouhov and Muthén52
Multilevel Estimation, Testing, Modification,And Identification (Continued)Tests of Model Fit MUML – chi-square, robust chi-square, CFI, TLI,RMSEA, and SRMR FIML – chi-square, robust chi-square, CFI, TLI,RMSEA, and SRMR FIML with random slopes – no tests of model fitModel Modification MUML – modification indices not available FIML – modification indices availableModel identification is the same as for CFA for both thebetween and within parts of the model.53Practical Issues Related To TheAnalysis Of Multilevel DataSize Of The Intraclass Correlation Small intraclass correlations can be ignored but importantinformation about between-level variability may be missedby conventional analysis The importance of the size of an intraclass correlationdepends on the size of the clusters Intraclass correlations are attenuated by individual-levelmeasurement error Effects of clustering not always seen in intraclasscorrelations54
Practical Issues Related To TheAnalysis Of Multilevel Data (Continued)Within-Level And Between-Level Variables Variables measured on the within-level can be used in boththe between-level and within-level parts of the model oronly in the within-level part of the model (WITHIN ) Variables measured on the between-level can be used onlyin the between-level part of the model (BETWEEN )Sample Size There should be at least 30-50 between-level units(clusters) Clusters with only one observation are allowed55Steps In SEM Multilevel AnalysisFor Continuous Outcomes Explore SEM model using the sample covariance matrixfrom the total sample Estimate the SEM model using the pooled-within samplecovariance matrix Investigate the size of the intraclass correlations andDEFF’s Explore the between structure using the estimated betweencovariance matrix Estimate and modify the two-level model suggested by theprevious steps56
Multivariate Modeling of Family Members Multilevel modeling: clusters independent, model forbetween- and within-cluster variation, units within acluster statistically equivalent Multivariate approach: clusters independent, model for allvariables for each cluster unit, different parameters fordifferent cluster units.– used in the latent variable growth modeling, where thecluster units are the repeated measures over time– allows for different cluster sizes by missing datatechniques– more flexible than the multilevel approach, butcomputationally convenient only for applications withsmall cluster sizes (e.g. twins, spouses)57Figure 1. A Longitudinal Growth Model of HeavyDrinking for Two-Sibling FamiliesOlderSibling VariablesO18 O19 O20 O21 O22O30 O31 FH123FH1FH23YoungerSibling VariablesFamily VariablesBlackMaleESHSDrpY18 Y19 Y20 Y21 Y22Y30 Y31 Y32Source: Khoo, S.T. & Muthen, B. (2000). Longitudinal data on families: Growth modeling alternatives. MultivariateApplications in Substance Use Research, J. Rose, L. Chassin, C. Presson & J. Sherman (eds.), Hillsdale, N.J.: Erlbaum,58pp. 43-78.
Input For Multivariate ModelingOf Family DataTITLE:Multivariate Modeling Of Family DataOne Observation Per FamilyDATA:FILE IS multi.dat;VARIABLE:NAMES ARE o18-o32 y18-y32 omale oes ohsdrop ymale yoesyhsdrop black hisp fh123 fh1 hf123;MODEL:s21o BY o18-o32@1;lrateo BY o18@0 o19@1 o20@2 o21@3 o22@4 o23@5 o24@6o25@7 o26@8 o27@9 o28@10 o29@11 o30@12 o31@13 o32@14;qrateo BY o18@0 o19@1 o20@4 o21@9 o22@16 o23@25 o24@36o25@49 o26@64 o27@81 o28@100 o29@121 o30@144 o31@169o32@196;s21y BY y18-y32@1;lratey BY y18@0 y19@1 y20@2 y21@3 y22@4 y23@5 y24@6y25@7 y26@8 y27@9 y28@10 y29@11 y30212 y31@13 y32@14;qratey BY y18@0 y19@1 y20@4 y21@9 y22@16 y23@25 y24@36y25@49 y26@64 y27@81 y28@100 y29@121 y30@144 y31@169y32@196;s21o ON omale oes ohsdrop black hisp fh123 fh1 fh23;221y ON ymale yes yhsdrop black hisp fh123 fh1 fh23;s21y ON s21o;lratey ON s21o lrateo;qratey ON s21o lrateo qrateo;[o18-y32@0 s21o-qratey];59Input For Multivariate ModelingOf Family Data (Continued)!New Version 3 Language For Growth Models!MODELs21o lrateo qrateo o18@0 o19@1 o20@2 o21@3 o22@4o23@5 o24@6 o25@7 o26@8 o27@9 o28@10 o29@11 o30@12o31@13 o32@14;s21y lratey qratey y18@0 y19@1 y20@2 y21@3 y22@4 y23@5y24@6 y25@7 y26@8 y27@9 y28@10 y29@11 y30@12y31@13 y32@14;s12o ON omale oes ohsdrop black hisp fh123 fh1 fh23;221y ON ymale yes yhsdrop black hisp fh123 fh1 fh23;s21y ON s21o;lratey ON s21o lrateo;qratey ON s21o lrateo qrateo;60
Twin Modeling61aA1Twin1Twin2y1y2cC1eaE11.0 for MZ0.5 for DZA2cC2eE21.062
Multilevel Mixture Modeling63Two-Level Regression Mixture Modeling:Group-Randomized CACEIndividual level(Within)cyCluster level(Between)ycClass-varyingxwtx64
Two-Level Latent Class level Growth Models66
Growth Modeling Approached in Two Ways:Data Arranged As Wide Versus Long Wide: Multivariate, Single-Level Approachyyti ii si x timeti εtiii regressed on wisi regressed on wiisw Long: Univariate, 2-Level Approach (cluster id)WithinBetweenitimesiwys67Growth Modeling Approached in Two Ways:Data Arranged As Wide Versus Long (Continued) Wide (one person):t1Person i: t2t3 t1t2t3idy1 y2y3 x1 x2 x3idididy1 x1y2 x2y3 x3wwwwLong (one cluster):Person i:t1t2t368
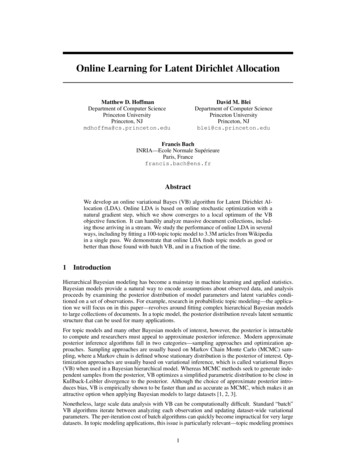
Three-Level Modeling In Multilevel TermsTime point t, individual i, cluster j.ytija1tija2tijxijwj: individual-level, outcome variable: individual-level, time-related variable (age, grade): individual-level, time-varying covariate: individual-level, time-invariant covariate: cluster-level covariateThree-level analysis (Mplus considers Within and Between)Level 1 (Within) : ytij π0ij π1ij a1tij π2tij a2tij etij ,(1)π 0ij ß00j ß01j xij r0ij ,π 1ij ß10j ß11j xij r1ij ,π 2tij ß20tj ß21tj xij r2tij .(2)Level 2 (Within) :Level 3 (Between) :ß00j γ000 γ001 wj u00j ,ß10j γ100 γ101 wj u10j ,ß20tj γ200t γ201t wj u20tj ,ß01j γ010 γ011 wj u01j ,ß11j γ110 γ111 wj u11j ,ß21tj γ2t0 γ2t1 wj u2tj .(3)69Two-Level Growth Modeling(3-Level Modeling)Withiny1y2iwswxy3Betweeny4y1y2ibsby3y4w70
ath1071Input For LSAY Two-Level Growth ModelWith Free Time Scores And CovariatesTITLE:LSAY two-level growth model with free time scoresand covariatesDATA:FILE IS lsay98.dat;FORMAT IS 3f8 f8.4 8f8.2 3f8 2f8.2;VARIABLE: NAMES ARE cohort id school weight math7 math8 math9math10 att7 att8 att9 att10 gender mothed homeres;USEOBS (gender EQ 1 AND cohort EQ 2);MISSING ALL (999);USEVAR math7-math10 mothed homeres;CLUSTER school;ANALYSIS: TYPE TWOLEVEL;ESTIMATOR MUML;72
Input For LSAY Two-Level Growth Model WithFree Time Scores And Covariates (Continued)MODEL:%WITHIN%iw BY math7-math10@1;sw BY math7@0 math8@1math9*2 (1)math10*3 (2);iw sw ON mothed homeres;%BETWEEN%ib BY math7-math10@1;sb BY math7@0 math8@1math9*2 (1)math10*3 (2);[math7-math10@0 ib sb];ib sb ON mothed homeres;OUTPUTSAMPSTAT STANDARDIZED RESIDUAL;73Input For LSAY Two-Level Growth Model WithFree Time Scores And Covariates (Continued)Version 3!!!!!!!!!!%WITHIN%iw sw math7@0math9*2 (1)math10*3 (2);iw sw ON mothed%BETWEEN%ib sb math7@0math9*2 (1)math10*3 (2);ib sb ON mothedmath8@1homeres;math8@1homeres;74
Output Excerpts LSAY Two-Level Growth ModelWith free Time Scores And CovariatesSummary of DataNumber of clustersSize (s)1267891415161718192050Cluster ID with Size utput Excerpts LSAY Two-Level Growth ModelWith free Time Scores And Covariates (Continued)Size (s)Cluster ID with Size 71082913533115341043930940302Average cluster size 18.627Estimated Intraclass Correlations for the Y riableMATH9IntraclassCorrelation0.16876
Output Excerpts LSAY Two-Level Growth ModelWith free Time Scores And Covariates (Continued)Tests Of Model FitChi-square Test of Model FitValue24.058*Degrees of Freedom14P-Value0.0451CFI / TLICFI0.997TLI0.995RMSEA (Root Mean Square Error Of Approximation)Estimate0.028SRMR (Standardized Root Mean Square Residual)Value for Between0.048Value for Within0.00777Output Excerpts LSAY Two-Level Growth ModelWith free Time Scores And Covariates (Continued)Model ResultsWithin 224.0440.2730.273IW78
Output Excerpts LSAY Two-Level Growth ModelWith free Time Scores And Covariates (Continued)HOMERES WITHMOTHEDResidual tput Excerpts LSAY Two-Level Growth ModelWith free Time Scores And Covariates (Continued)EstimatesS.E.Est./S.E. StdStdYXBetween ONMOTHEDHOMERESSBWITHIB80
Output Excerpts LSAY Two-Level Growth ModelWith free Time Scores And Covariates (Continued)HOMERES WITHMOTHEDResidual 09.9090.8309.9090.83081Output Excerpts LSAY Two-Level Growth ModelWith free Time Scores And Covariates (Continued)R-SquareWithin 70.03682
Output Excerpts LSAY Two-Level Growth ModelWith free Time Scores And Covariates (Continued)R-SquareBetween 5Undefined0.23207E 0183Two-Level, Two-Part Growth ubu1u2y3y4u3u4wiuwsuwu1u2u3u484
Multilevel Growth Mixture Modeling85Growth Mixture Modeling:LSAY Math Achievement Trajectory ClassesAnd The Prediction Of High School DropoutDropout:89Grades 7-101069%1008040407Good Development: 52%6080100Moderate Development: 28%60806040Math Achievement100Poor Development: 20%789Grades 7-10108%789Grades 7-10101%86
Multilevel Growth Mixture Mother’s Ed.High SchoolDropoutHome Res.ExpectationscDrop ThoughtsArrestedibcbsbhbExpelledSchool-Level Covariates87Input For A Multilevel Growth Mixture ModelFor LSAY Math AchievementTITLE:multilevel growth mixture model for LSAY mathachievementDATA:FILE lsayfull Dropout.dat;VARIABLE:NAMES female mothed homeres math7 math8 math9 math10expel arrest hisp black hsdrop expect lunch mstratdroptht7;!lunch % of students eligible for full lunch!assistance (9th)!mstrat ratio of students to full time math!teachers (9th)MISSING ALL (9999);CATEGORICAL hsdrop;CLASSES c (3);CLUSTER schcode;WITHIN female mothed homeres expect droptht7 expelarrest hisp black;BETWEEN lunch mstrat;88
Input For A Multilevel Growth Mixture ModelFor LSAY Math Achievement (Continued)DEFINE:lunch lunch/100;mstrat mstrat/1000;ANALYSIS:TYPE MIXTURE TWOLEVEL MISSING;ALGORITHM INTEGRATION;OUTPUT:SAMPSTAT STANDARDIZED TECH1 TECH8;PLOT:TYPE PLOT3;SERIES math7-math10 (s);89Input For A Multilevel Growth Mixture ModelFor LSAY Math Achievement (Continued)MODEL:%WITHIN%%OVERALL%i s math7@0 math8@1 math9@2 math10@3;i s c#1 c#2 hsdrop ON female hisp black mothed homeresexpect droptht7 expel arrest;%c#1%[i*40 s*1];math7-math10*20;i*13 s*3;%c#2%[i*40 s*5];math7-math10*30;i*8 s*3;i s ON female hisp black mothed homeres expectdroptht7 expel arrest;90
Input For A Multilevel Growth Mixture ModelFor LSAY Math Achievement (Continued)%c#3%[i*45 s*3];math7-math10*10;i*34 s*2;i s ON female hisp black mothed homeres expectdroptht7 expel arrest;%BETWEEN%%OVERALL%ib math7-math10@1; [ib@0];ib*1; hsdrop*1; ib WITH hsdrop;math7-math10@0;ib c#1 c#2 hsdrop ON lunch mstrat;%c#1%[hsdrop 1*-.3];%c#2%[hsdrop 1*.9];%c#3%[hsdrop 1*1.2];91Output Excerpts A Multilevel Growth MixtureModel For LSAY Math AchievementSummary of DataNumber of patterns13Number of y patterns13Number of u patterns1Number of clustersSize (s)12133839404243444544Cluster ID with Size s3043
Numerical integration approximates this integration by using a weighted sum over a set of integration points (quadrature nodes) representing values of the latent variable. 18 Numerical Integration (Continued) Numerical integration is computationally heavy and thereby time-consuming because the integration must be done at each iteration,