Transcription
An introduction tostructural equation modelingHans BaumgartnerSmeal College of BusinessThe Pennsylvania State University
Structural equation modelingStructural equation modeling (SEM) also known as latent variable modeling, latent variablepath analysis, (means and) covariance (or moment)structure analysis, causal modeling, etc.; a technique for investigating relationships between latent(unobserved) variables or constructs that are measuredby (multiple) manifest (observed) variables or indicators; can be thought of as a combination of regression analysis(including systems of simultaneous equations) and factoranalysis; special cases are confirmatory factor analysis andmanifest variable path analysis; in recent years, SEM has been extended in many ways;
Structural equation modelingSEM (cont’d) two primary advantages of SEM: SEM makes it possible to study complex patterns ofrelationships among the constructs in a conceptualmodel in an integrative fashion;the measurement of unobserved (latent) variables byobserved fallible indicators can be modeled explicitly,and the effect of measurement error (both randomand systematic) on structural relationships can betaken into account;
Structural equation modelingExplaining the usage of couponsfor grocery shopping(cf. Bagozzi, Baumgartner, and Yi itudesη1Intentionsη2Coupon usageη3
Structural equation modelingGoal-directed emotions(Bagozzi, Baumgartner, and Pieters cisingbehaviorsγ72negativegoal-outcomeemotions
Structural equation modelingThe relationship between observedmeasurements and constructs of interestBrandloyalty The observed single-item brandloyalty score is a perfectmeasure of “true” brand loyalty. All of the variability in observedscores is trait (substantive)variance.Measure ofbrand loyalty(e.g., I think of myself as abrand-loyal consumer.)T
Structural equation modelingThe relationship between observedmeasurements and constructs of interest (cont’d)BrandloyaltyMeasure ofbrand loyaltyε The observed brand loyaltyscore is contaminated byrandom measurement error. If only a single measure isavailable, randommeasurement error cannotbe taken into account.
Structural equation modelingThe relationship between observedmeasurements and constructs of interest (cont’d) The total variability of observedscores consists of both trait(substantive) variance andrandom error variance.TE This results in unreliability ofmeasurement and theattenuation of observedcorrelations.E1T1T2E2
Structural equation modelingThe relationship between observedmeasurements and constructs of interest (cont’d)Solution: Use multiple indicators to measure the focalconstruct, in which case we can assess reliability andcorrect for attenuation.Brandloyaltyλ1λ2λ3Brand loyaltymeasure 1Brand loyaltymeasure 2Brand loyaltymeasure 3ε1ε2ε3
Structural equation modelingThe relationship between observedmeasurements and constructs of interest (cont’d) The total variability of observedscores consists of trait(substantive), random error, andsystematic error (method)variance.TMET1 This is likely to confound theassessment of reliability andrelationships with otherconstructs.T2E2E1M1M2 It also complicates thecomparison of means.
Structural equation modelingA comprehensive model of measurement erroryijt τijt λijt ηjt ωijt εijtsystematicerroryijt ηjt ωijtεijtλijtτijt randomerrora person’s observed score on the ith measureof construct j at time ta person’s unobserved score for construct j attime tsystematic error scorerandom error scorecoefficient (factor loading) relating yijt to ηjtintercept term (additive bias)
Structural equation modelingAttitude toward using coupons(measured at two points in time)AAt1x11x21AAt2x31x41x12x22x32x42
Structural equation modelingAttitude toward using coupons(measured at two points in time)AAt1x11x21AAt2x31x41x12x22x32x42
Structural equation modelingFactor correlationsOriginal correlationCorrected correlationExploratory factoranalysis (PFA withPromax rotation).75n.a.Confirmatory factoranalysis.90.90Correlation ofunweighted linearcomposites at t1, t2.82.819 .91.882 .911.63.626 .91.654 .719Average correlation ofindividual t1, t2 measures
Structural equation modelingAdoption of managerial innovations(Bagozzi and Phillips ccountingy5y6y7y8
Structural equation modelingAdoption of managerial innovations nalysisAccountingy5y6y7Subordinatey8
Structural equation modelingVariance partitioningTraitMethodErrorTraining-CEO (y1).78.07.15Training-Sub (y2).25.23.53Forecasting-CEO (y3).90.09.00Forecasting-Sub (y4).25.51.23Accounting-CEO (y5).68.14.17Accounting-Sub (y6).93.04.03Financial analysis-CEO (y7).62.38.00Financial analysis-Sub (y8).74.10.15
Structural equation modelingGraphical specification of a(congeneric) measurement modelϕ2111ξ1λ11 λ21ξ2λ31 λ41λ52 λ62λ72 δθ66δθ77δθ88δθ11δθ22δθ33θ44δ
Structural equation modelingNeed for Touch (NFT) scale(Peck and Childers 2003)Instrumental touch: I place more trust in products that canbe touched before purchase. I feel more comfortable purchasing aproduct after physically examining it. If I can't touch a product in the store, Iam reluctant to purchase the product. I feel more confident making apurchase after touching a product. The only way to make sure a productis worth buying is to actually touch it. There are many products that I wouldonly buy if I could handle them beforepurchase.Autotelic touch: When walking through stores, Ican't help touching all kinds ofproducts. Touching products can be fun. When browsing in stores, it isimportant for me to handle all kindsof products. I like to touch products even if Ihave no intention of buying them. When browsing in stores, I like totouch lots of products. I find myself touching all kinds ofproducts in stores.
Structural equation modelingGraphical specification of an integratedmeasurement/latent variable 2y5y6ε5ε6εθ55εθ66η31y7
Structural equation modelingMeasurement model specification issues:Reflective vs. formative measurement calconstruct
Structural equation modelingMeasurement model specification issues:Number of indicators per construct in principle, more indicators are better, but there arepractical limits; question of how explicitly single-item measures aremodeled: total aggregation modelpartial aggregation model (item parcels)total disaggregation modelfocalconstructfocalconstructfocalconstructA
Structural equation modelingLatent variable model specification issues recursive vs. nonrecursive modelsξ1η1ξ2η2ξ3 specification of plausible alternative models problem of equivalent models
Structural equation modelingThe problem of equivalent 4η2η4η2η5η5
Structural equation modelingModel identification question whether the parameters in the model areuniquely determined so that the conclusionsderived from the analysis aren’t arbitrary; a necessary condition is that the number ofparameters to be estimated doesn’t exceed thenumber of unique elements in the (co)variancematrix of the observed variables; for relatively simple models, rules of identificationare available; for more complex models, empiricalheuristics may have to be used;
Structural equation modelingModel estimation Covariance-based SEM: estimate the model parameters in such a way that thecovariance matrix implied by the estimatedparameters is as close as possible to the samplecovariance matrix;e.g., for a factor modelϕ2111ξ1x Λξ δΣ ΛΦΛ′ �55θδ66θδ77θδ88 Variance-based SEM (PLS): estimate the parameters so as to maximize theexplained variance in the dependent variables;λ82
Structural equation modelingModel testing Global fit measures: χ2 goodness of fit testalternative fit indices Local fit measures: parameter estimates, standard errors and z-valuesmeasurement model: reliability and discriminant validitylatent variable model: R2 for each structural equation Model modification: modification indices and EPC’sresiduals
Structural equation modelingTesting the overidentifying restrictionsof a �3
Structural equation modelingTesting the overidentifying restrictionsof a model γ13ξ3There are 21 distinct elements in the covariance matrix of the 6 latent variables,we estimate 14 parameters, so there are 7 overidentifying restrictions.
Structural equation modelingTesting the overidentifying restrictionsof a model 1λy62y5y6ε5ε6εθ55εθ66η31y7
Structural equation modelingTesting the overidentifying restrictionsof a model (cont’d)ξ3ξ2ξ1x1x2x3x4δ1δ2δ3δ4θδ11 θδ22θδ33 θδ44x5δ5x6δ6δθδ55 θ66η1η2x7δ7θδ77y1y2y3y4ε1ε2ε3ε4θε11 θε22η3y5y6ε5ε6y7θε55 θε66θε33 θε44There are 105 distinct elements in the covariance matrix of the 14 observedvariables, we estimate 42 parameters, so there are 63 overidentifying restrictions.
Structural equation modelingTesting the overidentifying restrictionsof a model 1λy62y5y6ε5ε6εθ55εθ66η31y7There are 105 distinct elements in the covariance matrix of the 14 observed variables, we estimate 35 parameters, so there are 70 (63 7) overidentifying restrictions.
Structural equation modelingProblems with the χ2 test it is not a robust test; it is based on the accept-support logic of testing: a model is more likely to get support when the samplesize is small and power is low (even though it is anasymptotic test);since most models are unlikely to be literally true inthe population, in large samples the model is likely tobe rejected; thus, many alternative fit indices have beensuggested;
Structural equation modelingClassification of overall fit indicesOverall fit indicesStand-alone fit indicesχ2 test andvariationsminimum fitfunction χ2(C1)normal theoryWLS χ2 (C2)S-B scaled χ2(C3)χ2 correctedfor nonnormality(C4)χ2/dfminimum fitfunction fScaled LRIncremental fit indicesNoncentrality- Informationbasedtheory-based OthersmeasuresmeasuresType I indicesType II indicesNCPAIC(S)RMRNFI[χ2 or f]IFIRescaledNCP ammahatTLI[(χ2-df)/df]RMSEAMCCN
Structural equation modelingGoodness of fit statistics for the coupon data:Degrees of Freedom 70Minimum Fit Function Chi-Square 93.63 (P 0.031)Normal Theory Weighted Least Squares Chi-Square 92.60 (P 0.037)Estimated Non-centrality Parameter (NCP) 22.6090 Percent Confidence Interval for NCP (1.60 ; 51.68)Minimum Fit Function Value 0.38Population Discrepancy Function Value (F0) 0.09190 Percent Confidence Interval for F0 (0.0064 ; 0.21)Root Mean Square Error of Approximation (RMSEA) 0.03690 Percent Confidence Interval for RMSEA (0.0096 ; 0.054)P-Value for Test of Close Fit (RMSEA 0.05) 0.89Expected Cross-Validation Index (ECVI) 0.6590 Percent Confidence Interval for ECVI (0.57 ; 0.77)ECVI for Saturated Model 0.84ECVI for Independence Model 12.16Chi-Square for Independence Model with 91 Degrees of Freedom 2999.42Independence AIC 3027.42Model AIC 162.60Saturated AIC 210.00Independence CAIC 3090.72Model CAIC 320.85Saturated CAIC 684.75Normed Fit Index (NFI) 0.97Non-Normed Fit Index (NNFI) 0.99Parsimony Normed Fit Index (PNFI) 0.75Comparative Fit Index (CFI) 0.99Incremental Fit Index (IFI) 0.99Relative Fit Index (RFI) 0.96Critical N (CN) 268.08Root Mean Square Residual (RMR) 0.13Standardized RMR 0.049Goodness of Fit Index (GFI) 0.95Adjusted Goodness of Fit Index (AGFI) 0.92Parsimony Goodness of Fit Index (PGFI) 0.63
Structural equation modelingModel testing Global fit measures: χ2 goodness of fit testalternative fit indices Local fit measures: parameter estimates, standard errors and z-valuesmeasurement model: reliability and discriminant validitylatent variable model: R2 for each structural equation Model modification: modification indices and EPC’sresiduals
Structural equation modelingEstimation results for the coupon ϕ331λy62y5y6ε5ε6εθ55εθ661y7
Structural equation modelingMeasurement model results for coupon Inconveniencescompositereliability(average varianceextracted).88 80.210.23-11.323.323.710.790.77---Rewards.76 00.250.52-6.892.556.630.750.48---Encumbrances.70 .496.870.240.590.50----
Structural equation modelingMeasurement model results for coupon data bilitycompositereliability(average varianceextracted).88 8.200.630.740.530.71-----Intentions.91 .001.000.00---1.00--Behavior
Structural equation modelingDiscriminant validityCorrelation Matrix of ETA and 1) 1.00(.92) 0.70(---) 0.40(.88) -0.44(.78) 0.52(.67) -0.271.00Note: The latent variable correlations are corrected for attenuation.
Structural equation modelingLatent variable model results for coupon dataStructural EquationsAACT - 0.28*INCONV 0.44*REWARDS - 0.050*ENCUMBR, Errorvar. 0.69 , R2 I 1.10*AACT, Errorvar. 1.53 , R2 0.48(0.11)(0.20)10.047.73BH 0.49*BI, Errorvar. 1.41 , R2 0.34(0.049)(0.13)10.1010.78
Structural equation modelingModel testing Global fit measures: χ2 goodness of fit testalternative fit indices Local fit measures: parameter estimates, standard errors and z-valuesmeasurement model: reliability and discriminant validitylatent variable model: R2 for each structural equation Model modification: modification indices and EPC’sresiduals
Structural equation modelingModification indices a modification index (MI) refers to the predicteddecrease of the χ2 statistic when a fixed parameteris freely estimated or an equality constraint isrelaxed; associated with each MI is an expected parameterchange (EPC), which shows the predicted value ofthe freely estimated parameter; data-based model modifications have to be donecarefully;
Structural equation modelingModification indices for coupon dataModification Indices for BETAAACTBIBHAACT-------- - 2.34BI-------11.05- - -BH-------1.522.34- -Modification Indices for GAMMAAACTBIBHINCONV-------- 5.571.61REWARDS-------- 3.0712.67ENCUMBR-------- 5.152.78
Structural equation modelingTwo-step approach to model modification(Anderson and Gerbing 1988) specify a measurement model in which the latentvariable model is saturated and purify themeasurement model; once the measurement model is in place, attend tothe latent variable model;
Structural equation modelingSaturated latent variable modelfor the coupon dataξ3ξ2ξ1x1x2x3x4δ1δ2δ3δ4θδ11 θδ22θδ33 θδ44x5δ5x6δ6δθδ55 θ66η1η2x7δ7θδ77y1y2y3y4ε1ε2ε3ε4θε11 θε22η3y5y6ε5ε6θε55 θε66θε33 θε44χ2(63) 62.90y7
Structural equation modelingModified latent variable 2y5y6ε5ε6εθ55εθ66η31y7χ2(70) 92.60vs.2χ (69) 79.21
Structural equation modelingMulti-sample analysis:Known population heterogeneity SEM’s can be specified for several populationssimultaneously; this also allows the estimation of mean structures; multi-sample models are particularly useful forassessing measurement invariance (e.g., in crosscultural research); mediation, moderation, moderated mediation andmediated moderation can be assessed in astraightforward fashion;
Structural equation modelingA factor model with a mean δθ77δθ88
Structural equation modelingAssessing measurement invariance:Configural 8x7x8ξ2x5x6
Structural equation modelingAssessing measurement invariance:Metric 8x7x8ξ2x5x6
Structural equation modelingAssessing measurement invariance:Scalar 8x7x8ξ2x5x6
Structural equation modelingLinking the types of invariance requiredto the research objective(Steenkamp and Baumgartner 1998)ConfiguralinvarianceMetricinvarianceExploring the basicstructure of the constructcross-nationally Examining structuralrelationships with otherconstructs crossnationally Conducting crossnational comparisons ofmeans Scalarinvariance
Structural equation modelingSatisfaction with Life in the US and AUT:Final partial scalar invariance modelFactor loadingsItem 0.06
Structural equation modelingSatisfaction with Life in the US and AUT:Final partial scalar invariance modelFactor loadingsItem 0.06Latent meansAUT: 3.91US: 3.26
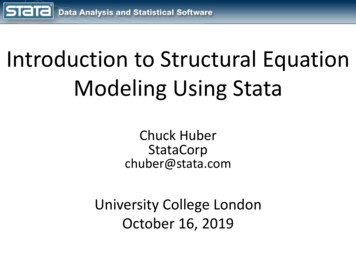
Structural equation modelingGoal-directed emotions: Results0.31 (7.4).14 0 (7.4).36 (6.8)ddietingbehaviors.16 (4.4) .07 ( .6).54 (4.9)b.61 (7.7)a,b.29 tnegativeanticipatedemotions.07 (1.9).16 (4.0).08 (.9).56 (3.7)a .18 ( 2.3)a,c negative .46 ( 8.7)b,d goal-outcomeemotionsexercising .24 (8.7) exercisingvolitionsbehaviors0.11 (3.4) .33 (5.3)babcdmen wanting to lose weightwomen wanting to lose weightmen wanting to maintain their weightwomen wanting to maintain their weightχ2(110) 150.51RMSEA .061CFI .94TLI .92
Structural equation modelingMediation and moderation a mediator Me is a variable that accounts for the relationbetween a predictor A and a criterion C (i.e., it channelsat least some of the total effect of A on C);AaMebCc a moderator Mo is a variable that affects the directionand/or strength of the relation between a predictor A anda criterion C;MoAC
Structural equation modelingMediation and moderation (cont’d)0.31 (7.4).14 0 (7.4).36 (6.8)ddietingbehaviors.16 (4.4) .07 ( .6).54 (4.9)b.61 (7.7)a,b.29 tnegativeanticipatedemotions.07 (1.9).16 (4.0).08 (.9).56 (3.7)a .18 ( 2.3)a,c negative .46 ( 8.7)b,d goal-outcomeemotionsexercising .24 (8.7) exercisingvolitionsbehaviors0.11 (3.4) .33 (5.3)babcdmen wanting to lose weightwomen wanting to lose weightmen wanting to maintain their weightwomen wanting to maintain their weightχ2(110) 150.51RMSEA .061CFI .94TLI .92
Structural equation modelingWhat are the effects of positive anticipated emotions ongoal achievement for people who desire to lose weight,and do these effects differ by gender?MalesDirect effectIndirect effectTotal effect---.019*.019*via dieting-.002via exercising.021*s.Females---s.017*via dieting.014*via exercising.003.017*
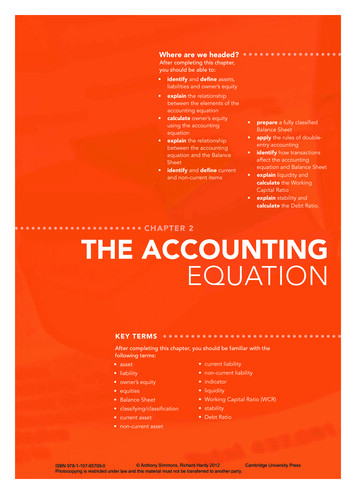
Structural equation modelingHierarchical models12߬ 11σA2 ݑ ߛ Construct Bߚଵ ݑ ଵ Note: Covariance between u0j andu1j not shown for simplicity.rߛ ଵߚ Construct Aσr2߬ଵଵ
Structural equation modelingLatent curve modelsψ21η2η1“Intercept”“Slope”mean α1variance ψ11mean α2variance ψ221111-5-3-1 11 135y1y2y3y4y5y6ε1ε2ε3ε4ε5ε6
Structural equation modelingMixture modeling:Unobserved population heterogeneityrConstruct BConstruct Aσri2ߚ σ Ai 2ߨ݅LCi 1 or 2Note: The parameters ߨ݅ are the mixing probabilities.
Structural equation modelingBackground readings Kline, Rex B. (2011), Principles and practice of structuralequation modeling, 3rd ed., New York: The GuilfordPress. Bollen, Kenneth A. (1989), Structural equations withlatent variables, New York: Wiley. Byrne, Barbara M. (1998), Structural Equation Modelingwith LISREL, PRELIS, and SIMPLIS: Basic Concepts,Applications, and Programming, Mahwah, NJ: Erlbaum.
Structural equation modelingComputer programs for SEM LISREL 9.1 (Jöreskog & Sörbom) http://www.ssicentral.com/lisrel/index.html Mplus Version 7 (Muthen) http://www.statmodel.com/ EQS 6.2 (Bentler) http://www.mvsoft.com/eqs60.htm PROC CALIS in SAS, AMOS in SPSS, special packagesin R, Stata, etc.
Structural equation modelingCriteria for distinguishing betweenreflective and formative indicator models Are the indicators manifestations of the underlyingconstruct or defining characteristics of it? Are the indicators conceptually interchangeable? Are the indicators expected to covary? Are all of the indicators expected to have the sameantecedents and/or consequences?Based on MacKenzie, Podsakoff and Jarvis,JAP 2005, pp. 710-730.
Structural equation modelingConsumer BehaviorAttitudesAad as a mediator of advertising effectiveness:Four structural specifications (MacKenzie et al. 1986)Affect transfer hypothesisCadAadCbAbBIReciprocal mediation hypothesisCadAadCbAbBIDual mediation hypothesisCadAadCbAbBIIndependent influences hypothesisCadAadCbAbBI
Structural equation modelingReliability for congeneric measures individual-item reliability (squared correlation between a constructξj and one of its indicators xi):ρii λij2var(ξj)/[ λij2 var(ξj) θii] composite reliability (squared correlation between a construct andan unweighted composite of its indicators x x1 x2 . xK):ρc (Σλij)2 var(ξj)/[ (Σλij)2 var(ξj) Σθii] average variance extracted (proportion of the total variance in allindicators of a construct accounted for by the construct; see Fornelland Larcker 1981):ρave (Σλij2) var(ξj)/[ (Σλij2) var(ξj) Σθii]
Structural equation modelingSIMPLEX specificationTitleA general structural equation model (explaining coupon usage)Observed Variablesid be1 be2 be3 be4 be5 be6 be7 aa1t1 aa2t1 aa3t1 aa4t1 bi1 bi2 bh1Raw Data from File d:\m554\eden2\sem.datLatent VariablesINCONV REWARDS ENCUMBR AACT BI BHSample Size 250Relationshipsbe1 1*INCONVbe2 INCONVbe3 1*REWARDSbe4 REWARDSbe5 1*ENCUMBRbe6 ENCUMBRbe7 ENCUMBRaa1t1 1*AACTaa2t1 AACTaa3t1 AACTaa4t1 AACTbi1 1*BIbi2 BIbh1 1*BHAACT INCONV REWARDS ENCUMBRBI AACTBH BISet the Error Variance of bh1 to zeroOptions sc rs mi wpPath DiagramEnd of Problem
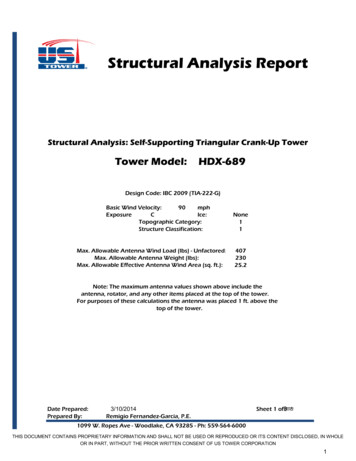
Modeling random and systematicmeasurement error (Baumgartner and Steenkamp subseterrorξ1TSEξ2TSEξ3TSEξ4TSEy11 y21 y31 y41 y51y12 y22 y32 y42 y52y13 y23 y33 y43 y53y14 y24 y34 y44 icerror
Structuralequation modeling Structural equation modeling (SEM) also known as latent variable modeling, latent variable path analysis, (means and) covariance (or moment)