Transcription
47519 HALYARD DRIVEPLYMOUTH, MI 48170-2438PHONE: (734) 414 9618FAX: (734) 414 9690REPORT PEI-130830 March 2022Lifecycle Carbon Analysis and Total Cost of Ownershipfor 2030 Light Duty Vehicle FleetWritten byReviewed byDr. John J. Kasab, P.E.Sr. Technical SpecialistElectrificationDr. Kevin RhodesTech. Segment LeaderElectrificationDistributed toMECAAVL PEI
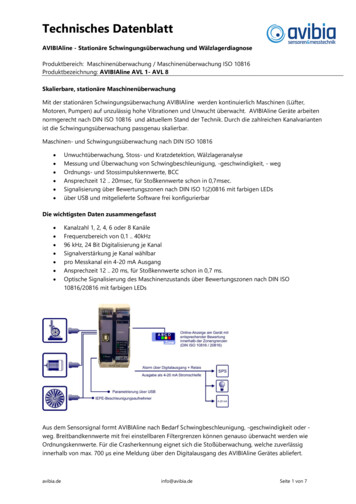
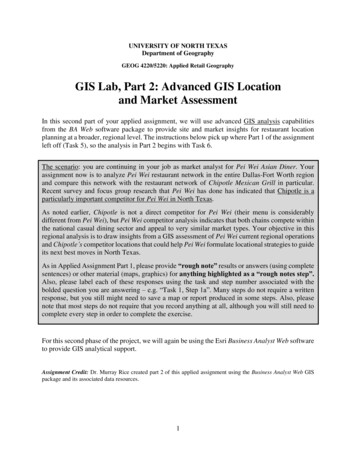
Executive SummaryThe Manufacturers of Emission Controls Association (MECA) had AVL conduct this studybecause MECA wants to understand the following about the 2030 vehicles in operation(VIO) in the United States of America (US): The potential relative market share of various types of vehicles and powertrains inthe VIO and how that aligns with greenhouse gas (GHG) emissions goals Total cost of ownership (TCO) Lifecycle emissions of carbon dioxide (CO2), nitrogen oxides (NOx), and methane(CH4)MECA also wanted to understand the effect of likely carbon intensities of future regionalelectrical grids on TCO and lifecycle emissions for the 2030 VIO.For this study, TCO includes both the vehicle first cost and its operating cost over thevehicle life. For the example fleet analyses presented in this report, the vehicle life wasassumed to be 12 years at 10,500 miles per year. Similarly, the lifecycle emissions includecontributions from the following: Well to pump (WTP) emissions for the fuels considered Vehicle manufacture (VM) emissions for the vehicles and powertrains considered Vehicle operation (VO) or tank to wheels (TTW) emissions over the vehicle lifeThe overall methodology for the program is outlined in Figure ES.1. AVL used GREET2020 from the Argonne National Laboratory (ANL) and developed spreadsheet-basedDashboard tools for this study to evaluate the design space. The Dashboard tools supportboth vehicle-level and fleet-level analyses of the 2030 VIO.The technology pathways for the 2030 vehicle design space are based on those availablein GREET 2020. From those pathways, several vehicle options were chosen for the fleetlevel analyses. Three representative vehicle classes were studied: City Sedan, FamilySUV, and Pickup Truck. Each vehicle had several powertrain options. Depending on thepowertrain type, several fuels were also available for use. In addition to the vehicles andfuels, several regional electrical grids and their corresponding emissions were consideredfor their effects on the lifecycle emissions for the vehicles. These effects were aggregatedinto response surface models and embodied into two Dashboards for vehicle-levelanalysis, Dashboard 1 and Dashboard 2.Key input factors in Dashboards 1 and 2 for a given combination of vehicle class andpowertrain type are fuel prices, charging efficiency, and BEV range (if appropriate). Theuser interface for Dashboard 1 is shown in Figure ES.2. The Dashboard then returnslifecycle emissions, TCO, and similar results. Dashboard 2 is used to define the vehiclesused in the fleet analysis tool, Dashboard 3, which is shown in Figure ES.3.Technical Report PEI-1308Page ii
2030 Representative Grids – 2 ChoicesUS Avg – Md GHG ScenarioCalifornia – Low GHG ScenarioTechnology PathwaysVEHICLE ANALYSISDASHBOARD 2PickCandidateTechnologyBundles byrankingCO2, TCOFLEET ANALYSISElectrified (PHEV,FCEV*, BEV) Set CO2 vehicle target (50–200 mpg) Pick top 5–10 solutions: Low GHG Emissions and Realistic5-9 VehicleCandidates †DASHBOARD 3Conventional(ICEV, HEV)Electrified (PHEV,FCEV*, BEV)Conventional(ICEV, HEV)OptimizeTechnologyBundlespenetrationfor TotalCO2 and AvgTCO5-9 VehicleCandidates †5-9 VehicleCandidates †5-9 VehicleCandidates † Set an EV fleet %‡ and an “old” vehicle fleet % Optimize candidate fleet penetration % for CO2 target** at minimum avg. TCOFigure ES.1 – Program methodology concept, including grid scenarios, technology pathways, andDashboard tools.GREET RESULTS - VARIATION DASHBOARDInput Cells are filled in White (orange variation, blue fixed value)Vehicle Choice:x-axisType:Powertrain:Fuel:y-axisx-axisCO2 PlotFixed Value1000010210850300mi/yyears /unit RUNReset Default200.080.060.030.020.041000.040.1US TonsUS TonsUS Tonsstep 50006000100200300[mi][mi]400500600[mi]9,700Total, WTP, VC, VO%80mi70Scenario 1 - Scenario 2 - Scenario 3 - 50US TonsElectricity Mix Scenario Choice:60Carbon Intensity400WTP10------- VC . VO0300300[mi]400500600Residual 00Coal80%3503020Natural Gas100%45040Legend -- TotalElectricity Source500g/kWhFixed Parameters:Vehicle Miles TravelledVehicle LifetimeFuel CostBattery Cost MultiplierBattery Recycling [0 1]Charge EffciencyBattery Replacement [0 1]BEV Range [100,300,500]Max5000.050.1240[mi]Min100y-axisCH4 Plot0.060.1450Variation Parameter Choice:Variation Range:x-axisNOx Plot0.16601 variant:EXPORT DATAy-axis00%0100200300[mi]400500600U.S. Average Mix - aka MidGHGHICC Mix - Hawaiielectricity mixLow GHG Mix - MoreRenewablesFigure ES.2 – Dashboard 1 for single vehicle analysis.MECA and AVL together defined a Baseline fleet and, from the vehicle candidatesidentified in the initial analysis, five future fleet scenarios that represented differing levelsof technology adoption. The six fleet scenarios considered in this study are the following:1. Baseline (2019) fleet2. Low GHG Emissions fleet using conventional vehicles and HEV3. Low GHG Emissions fleet using highly electrified vehicles (PHEV, FCEV, BEV)4. MECA Scenario 1 (Technology ready options)5. MECA Scenario 2 (Moderate technology advancing)6. MECA Scenario 3 (Aggressive technology advancing)Technical Report PEI-1308Page iii
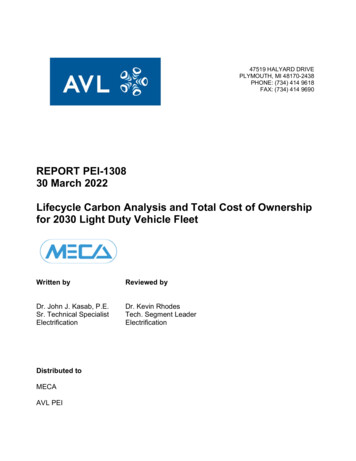
Target FiltersLower BoundUpper BoundTCOApplyFilterPenetrationLower BoundUpper Bound123456789101112131415Remove FilterVehicle Information123456789101112131415VehicleFuel EconomygCO2/mileFigure ES.3 – Dashboard 3 for fleet analysis.Using Dashboard 3, AVL then evaluated how the five future fleet scenarios would affectTCO and lifecycle emissions for new vehicles sold in 2030 and for the overall VIO in 2030.The analysis varies the relative market share of the vehicles, powertrains, and fuelsconsidered within a given fleet scenario to generate a case for analysis. Several of thesecases are then aggregated to provide an overall, fleet-level range of estimates of the TCOand lifecycle emissions.An example of these fleet-level results is shown in Figure ES.4, where the colored pointclouds represent different cases within each of three 2030 fleet scenarios. The clouds onthe left use the 2030 California (low GHG) electrical grid whereas the ones on the rightuse the 2030 US Average (medium GHG) electrical grid. MECA and AVL assumed thatthe 2030 VIO would need to demonstrate a 30% reduction in overall CO2 emissions tomeet the Paris Accord requirements, which is marked by the orange dashed line. Notethat there is a weak correlation between TCO and lifecycle CO2 emissions that is affectedby the first cost of the technologies and the expected life or use of the vehicles.Since the 2030 VIO will include both new vehicles—represented by the point clouds—and older vehicles—represented by the Baseline Fleet average lifecycle CO2 emissionsvalue of 51.5 US ton calculated for this study—achieving a given level of overall CO2emissions reduction puts the onus on the new vehicles to meet the target. As the assumedfraction of old vehicles in the 2030 VIO increases, the CO2 emissions target for the newvehicles decreases accordingly. The orange dashed line in Figure ES.4 is the new vehicleemissions target when old vehicles are under 10% of the VIO. As the fraction of oldvehicles increases in the VIO, the target for the new (2030) vehicles decreases and fewerfleet options within each of the fleet scenarios will support the overall VIO meeting theexpected 2030 GHG emissions targets.Technical Report PEI-1308Page iv
Conventional Low GHGElectrified Low GHG-Technology Ready-Moderate Technology Advancing-Aggressive Technology AdvancingBaseline Fleet30% ReductionFleet CompositeU.S tonelectrifiedScenario 1Scenario 2Scenario 2electrifiedconventionalconventionalUnfeasible fleetsDo not achieve target with100% 2030 ModelsLess RobustFeasible fleetsCan achieve target withvaried robustness to oldervehicle penetrationMore RobustFleet CompositeFigure ES.4 – 2030 Fleets comparing the results from the Low GHG Emissions and three MECAScenario vehicle technology options. Point clouds represent new 2030 vehicles only.In addition, this analysis did not evaluate how fuels with a lower CO2 content would affectthe emissions of the Baseline (2019) fleet. For example, if fuels with a near-zero well topump (WTP) CO2 content become widespread, then the overall fleet lifecycle CO2emissions will be correspondingly lower. This effect would allow the future fleet scenariosto be less aggressive with their GHG emissions reduction targets to achieve the net targetfor the overall 2030 VIO.In summary, AVL has created a tool set that can be used to evaluate future fleet scenariosand has conducted some initial fleet emissions and TCO scenario analyses with inputfrom MECA. The results suggest that there are multiple future fleet options that can meetexpected future fleet emissions targets, for example, as defined by the Paris Accord orby the US Government. The study also demonstrates that the fleet fraction and emissionslevel of legacy vehicles within the VIO will influence the level of emissions reductionneeded by new vehicles to meet an overall emissions target for the VIO. This suggeststhat any CO2 reductions that are achieved by legacy vehicles in the transition years to2030 will build in fleet robustness needed to ensure that ultimate CO2 emission reductiongoals from transportation are met. The fleet analyses also incorporated TCO into theresults. Thus, the future fleets can be assessed based on their overall benefits, not juston their technology or emissions benefits.Technical Report PEI-1308Page v
ContentsRevision History . iExecutive Summary . iiContents . viList of Tables . viiList of Figures . viii1. Introduction . 11.1. Background . 11.2. Project Objectives. 12. Technical Methodology . 22.1. Toolchain . 22.2. Design Space Definition . 22.3. Analysis Inputs . 82.4. Study Assumptions . 102.5. Dashboards . 133. Analyses and Results . 163.1. GREET Simulations over Design Space . 163.2. Vehicle Analysis – Dashboards 1 and 2 . 233.3. Definition of Fleets for This Study . 233.4. Fleet Analysis – Dashboard 3 . 294. Conclusions. 375. References . 39Appendix A. Definition of Abbreviations and Acronyms . 41Appendix B. Side Study: Electricity Scenarios and Generation Mix . 42Appendix C. Side Study: Electro-Fuels . 48Appendix D. Detailed Simulation Results . 50Appendix E. Side Study: Cathode Material . 57Technical Report PEI-1308Page vi
List of TablesTable 2.1 – Vehicle, powertrain, and fuel matrix for study. Options and combinationsmarked in teal were added during the study. 4Table 2.2 – Well to pump CO2 emissions from each of 19 electrical grid scenarios for theSUV BEV on a gram per mile basis. 5Table 2.3 – Well to pump CO2 emissions from each of 19 electrical grid scenarios for theSUV ICEV on a gram per mile basis. . 6Table 2.4 – Summary comparison of well to pump CO2 emissions from each of 19electrical grid scenarios for the SUV ICEV and SUV PHEV on a gram per mile basis. . 7Table 2.5 – Variation parameters summary. . 10Table 2.6 – Fuel prices used for TCO calculations. Prices shown are for 2030 but in2019 . . 10Table 3.1 – Low GHG Emissions Vehicle fleet options for analysis. . 28Table 3.2 – MECA proposed fleet scenarios, where technology content increases fromScenario 1 to Scenario 3. . 28Table D.1 – Mean vehicle manufacturing CO2 emissions for various combinations ofvehicle, powertrain, and electricity scenario. . 52Table E.1 – Cathode chemistry options and associated CO2 emissions on gram per milebasis. . 57Table E.2 – Effect of cathode production and battery assembly locations on CO2emissions on gram per mile basis. . 57Technical Report PEI-1308Page vii
List of FiguresFigure ES.1 – Program methodology concept, including grid scenarios, technologypathways, and Dashboard tools. . iiiFigure ES.2 – Dashboard 1 for single vehicle analysis. . iiiFigure ES.3 – Dashboard 3 for fleet analysis. .ivFigure ES.4 – 2030 Fleets comparing the results from the Low GHG Emissions and threeMECA Scenario vehicle technology options. Point clouds represent new 2030 vehiclesonly. vFigure 2.1 – Program methodology concept, including grid scenarios, technologypathways, and Dashboard tools. . 2Figure 2.2 – Battery capacity in kW h needed for a given BEV range in mi. . 9Figure 2.3 – Annual VMT per capita by state from 2017 [11]. . 12Figure 2.4 – Dashboard 1 for single vehicle analysis. . 14Figure 2.5 – Dashboard 2 for vehicle analyses to populate the fleet analysis. . 15Figure 2.6 – Dashboard 3 for fleet analysis. . 15Figure 3.1 – Effect of charging efficiency on well to pump (WTP) CO2 emissions for theSUV PHEV using four representative electricity scenarios: (a) Effect of fuels and (b) Effectof EV range. . 17Figure 3.2 – Mean CO2 emissions from vehicle operation for the Sedan, with powertrainand fuel combinations ranked by increasing mean emissions. 18Figure 3.3 – Mean CO2 emissions from vehicle operation for the SUV, with powertrainand fuel combinations ranked by increasing mean emissions. 19Figure 3.4 – Mean CO2 emissions from vehicle operation for the Pickup Truck, withpowertrain and fuel combinations ranked by increasing mean emissions. . 19Figure 3.5 – Mean total CO2 emissions from total lifecycle for the SUV ICEV, HEV, andFCEV using the 2030 US Averaged electricity mix. 20Figure 3.6 – Mean total CO2 emissions from total lifecycle for the SUV ICEV, HEV, andFCEV using the 2030 California electricity mix. . 21Figure 3.7 – Constituent and total CO2 emissions estimates for the SUV PHEV and BEVusing the US Average electricity scenario. . 22Figure 3.8 – Fleet options with 2030 US Average electrical grid. . 24Figure 3.9 – Fleet options with 2030 California electrical grid. . 25Figure 3.10 – Conventional fleet options for both 2030 grid mixes. Vehicles are orderedby total lifecycle CO2. Green arrows mark Low GHG Emissions fleet choices; the magentaarrows mark options that balance emissions and TCO. . 26Figure 3.11 – Highly electrified fleet options for both 2030 grid mixes. Vehicles areordered by total lifecycle CO2. Green arrows mark Low GHG Emissions fleet choices; themagenta arrows mark options that balance emissions and TCO. . 27Figure 3.12 – Market share for each of several powertrain and fuel options for Baselinefleet that is derived from 2019 fleet data. . 30Technical Report PEI-1308Page viii
Figure 3.13 – 2030 Fleets using the Conventional and Highly Electrified Low GHGEmissions vehicles. Point clouds represent new 2030 vehicles only. Assumed target forfleetwide GHG emissions is a 30% reduction from 2019 baseline. . 32Figure 3.14 – Example showing fleet options meeting a 30% CO2 emissions reduction.The example marked here assumes the Baseline fleet results represent 40% of the VIOemissions and the 2030 fleet results, 60% of the VIO. . 33Figure 3.15 – 2030 Fleets using the MECA Scenario vehicles as shown in Table 3.2. Pointclouds represent new 2030 vehicles only. Assumed target for fleetwide GHG emissionsis a 30% reduction from 2019 baseline. . 34Figure 3.16 – Example showing fleet options meeting a 30% CO2 emissions reduction.The example marked here assumes the Baseline fleet results represent 40% of the VIOemissions and the 2030 MECA Scenario fleet results, 60% of the VIO. . 35Figure 3.17 – 2030 Fleets comparing the results from the Low GHG Emissions and MECAScenario vehicle options. Point clouds represent new 2030 vehicles only. . 36Figure B.1 – Electricity scenarios showing various mixes of electricity sources, where“Other” includes hydroelectric, geothermal, wind, and other low-GHG sources. . 42Figure B.2 – Regional electrical sub-grids that are used to generate ten of the electricityscenarios. . 43Figure B.3 – Lifecycle CO2 emissions from Sedan BEV for all electricity scenarios. . 44Figure B.4 – Lifecycle CO2 emissions from Sedan BEV six focus scenarios. . 45Figure B.5 – Lifecycle NOx emissions from Sedan BEV for all electricity scenarios. . 46Figure B.6 – Lifecycle CH4 emissions from Sedan BEV for all electricity scenarios. . 46Figure B.7 – Lifecycle energy usage for Sedan BEV for all electricity scenarios. 47Figure B.8 – Lifecycle carbon intensity for Sedan BEV for all electricity scenarios. . 47Figure D.1 – Number of GREET runs executed for each vehicle, powertrain, and fuelcombination. . 50Figure D.2 – Emissions coverage matrix across 19 electricity scenarios and vehiclevariations. . 53Figure D.3 – Emissions coverage matrix using the California grid scenarios and vehiclevariations. . 54Figure D.4 – Summary comparison of WTP NOx emissions for the SUV ICEV and PHEVby fuel and by electricity scenario. Boxes mark combinations where the emissions areequivalent. . 55Figure D.5 – Summary comparison of WTP CH4 emissions for the SUV ICEV and PHEVby fuel and by electricity scenario. Boxes mark combinations where the emissions areequivalent. . 56Technical Report PEI-1308Page ix
1. Introduction1.1. BackgroundThe Manufacturers of Emission Controls Association (MECA) contracted AVL to conducta study of lifecycle emissions and the total cost of ownership (TCO) for light-duty vehicles(LDV) in the US market. AVL constructed a baseline fleet and compared that againstseveral scenarios for 2030 [1].To complete the study, AVL developed a well to wheels dataset for the vehicle and fuelmatrix shown in Table 2.1 that included carbon dioxide (CO2), nitrogen oxides (NOx), andmethane (CH4) emissions. Carbon dioxide and methane are both greenhouse gases(GHG), where methane is 25 times as potent a GHG as CO2, and NOx is a key criteriapollutant that is formed as a by-product of combustion [2].AVL also investigated variations and uncertainties within the emissions and TCOanalyses, and then aggregated the generated data into a set of Dashboards. TheseDashboards, which are described further in Section 2.5, support both vehicle-level andfleet-level analysis of the 2030 scenarios. Three Dashboards were created for this project:Dashboard 1 is for stand-alone vehicle analysis, whereas Dashboard 2 is for vehicleanalysis that populates the fleet analyses conducted by Dashboard 3.This report documents the background of the study, its technical methodology, theanalyses conducted, and the results for the 2030 fleet scenarios.1.2. Project ObjectivesFor the projected US Fleet of Vehicles in Operation (VIO) in 2030, MECA wants tounderstand the following: Likely vehicle configurations for 2030 US VIO TCO including botho Vehicle first costo Vehicle operating cost over life Lifecycle carbon analysis (LCA), including contributions fromo Net CO2 content of fuel from well to pump (WTP)o Vehicle manufactureo Vehicle generation of CO2 from operation over life Additional lifecycle emissions estimates for NOx and methane Likely electrical grid carbon intensities for 2030 and their effect on TCO, LCA, andother lifecycle emissionsTechnical Report PEI-1308Page 1
2. Technical MethodologyFor this program, AVL and MECA defined a design space for the 2030 VIO. This sectiondescribes the design space, the various analysis inputs, and the assumptions needed tobound the analysis. AVL used GREET 2020 to evaluate the lifecycle emissions over thedesign space, processed those results, and then integrated them into Dashboards. TheseDashboards, described further in Section 2.5, were used to conduct the vehicle- and fleetlevel studies described in Section 3.2.1. ToolchainTwo main tools were used in this study to generate the results. The first main tool wasGREET, which is a LCA tool developed by Argonne National Laboratory (ANL) [3, 4].MECA and AVL agreed to use GREET as-is for this study and agreed to not createextensions where the study design space was not contained within the GREET designspace. Further assumptions about how GREET was used are discussed in Section 2.4.AVL developed a set of tools—the Dashboards—to conduct single-vehicle analyses andthe fleet analyses. The overall toolchain is illustrated in Figure 2.1, where the technologypathways are generated using GREET.2030 Representative Grids – 2 ChoicesUS Avg – Md GHG ScenarioCalifornia – Low GHG ScenarioVEHICLE ANALYSISDASHBOARD 2Technology PathwaysConventional(ICEV, HEV)PickCandidateTechnologyBundles byrankingCO2, TCOFLEET ANALYSISDASHBOARD 3Conventional(ICEV, HEV)Electrified (PHEV,FCEV*, BEV) Set CO2 vehicle target (50–200 mpg) Pick top 5–10 solutions: Low GHG Emissions and Realistic5-9 VehicleCandidates †OptimizeTechnologyBundlespenetrationfor TotalCO2 and AvgTCOElectrified (PHEV,FCEV*, BEV)5-9 VehicleCandidates †5-9 VehicleCandidates †5-9 VehicleCandidates † Set an EV fleet %‡ and an “old” vehicle fleet % Optimize candidate fleet penetration % for CO2 target** at minimum avg. TCOFigure 2.1 – Program methodology concept, including grid scenarios, technology pathways, andDashboard tools.2.2. Design Space DefinitionThe overall design space considered in this project was broad. Three main classes ofvehicles were studied: City Sedan (“Sedan”), Family SUV (“SUV”), and Pickup Truck(“Pickup”). These vehicle classes are as defined in GREET 2020. Each vehicle hadTechnical Report PEI-1308Page 2
several powertrain options and where appropriate, the vehicle–powertrain combinationhad a set of fuels to choose from. Table 2.1 shows the complete matrix of vehicles,powertrains, and fuels considered in this study. The specific combinations that wereconsidered in the study are marked with an “X”. Options listed in teal or combinations inteal boxes in Table 2.1 were added during the study.In addition to the vehicle and fuel combinations, AVL also initially considered 19 differentelectricity scenarios for 2030 1, each of which had associated CO2, NOx, and methaneemissions. The electricity scenarios have the largest effect on WTP CO2 emissions,especially for battery electric vehicle (BEV) and plug-in hybrid electric vehicle (PHEV)powertrains where the vehicles are recharged by the grid.An example of WTP CO2 emissions on a grams per mile basis is shown in Table 2.2 forthe SUV BEV, and the electrical grid understandably has the primary effect on thoseemissions. However, as shown in Table 2.3 for the SUV with the internal combustionengine vehicle powertrain (ICEV), the electrical grid scenario only has a secondary effecton WTP CO2 emissions and the primary effect is the carbon intensity of the fuel type [1, 5].The electricity scenario grid-level GHG affects CO2 emissions from its three mainconstituents: WTP, vehicle manufacturing, and vehicle operation (VO, a.k.a. tank towheels, TTW). MECA and AVL agreed to narrow the design space to only include twogrid scenarios that would reasonably represent the main 2030 grid options. The two 2030grid scenarios chosen are the California (low GHG) scenario and the US Averagescenario, also labeled as “MidGHG” in Table 2.2 and Table 2.3.It is also possible to make comparisons between the SUV ICEV and SUV PHEV, asshown in Table 2.4. Here, the SUV PHEV CO2 emissions are affected both by the fueltype and by the electricity scenario. In fact, electricity scenarios with high CO2 emissions,such as the Hawaiian grid scenario, can overwhelm the WTP CO2 emissions of the fuelfor the ICEV.1The electricity scenarios are described further in Appendix B, Electricity Scenarios and Generation Mix.Technical Report PEI-1308Page 3
Technical Report PEI-1308Page 4Pickup FCEVPickup BEV 100,300, 400, 500 miPickup HEVPickup ICEFamily FCEV SUVXXXXXXXXXFamily BEV SUV100, 300, 400,500 miXXXXXXXXXXFamily PHEV SUVXXXXXXCity HEV SedanFamily ICE SUVXFamily HEV SUVXXB20XE85E10XCity BEV Sedan100, 300, 400 miCity ICE SedanVehiclesXXXXXXXRenewable RNGXXXXCNGXXRenewableH2XXHigh GHGH2XXXHighGHGXXXAvg GHGXXXLow GHG19 Grid Power ScenariosTable 2.1 – Vehicle, powertrain, and fuel matrix for study. Options and combinations marked in teal were added during the study.
Technical Report PEI-1308Page 5NortheasternNortheastMidwestg/mi.Table 2.2 – Well to pump CO2 emissions from each of 19 electrical grid scenarios for the SUV BEV on a gram per mile basis.
Technical Report PEI-1308Page 6Northeasterng/mi.Table 2.3 – Well to pump CO2 emissions from each of 19 electrical grid scenarios for the SUV ICEV on a gram per mile basis.
Technical Report PEI-1308Page 7ICEV PHEVICEV PHEVNortheasternICEV promote CO2 removal for eFuels and renewable fuels while PHEV loses advantage when electricity grid is poorg/mi.Table 2.4 – Summary comparison of well to pump CO2
electrical grids on TCO and lifecycle emissions for the 2030 VIO. For this study, TCO includes both the vehicle first cost and its operating cost over the vehicle life. For the example fleet analyses presented in this report, the vehicle life was assumed to be 12 years at 10,500 miles per year. Similarly, the lifecycle emissions include