Transcription
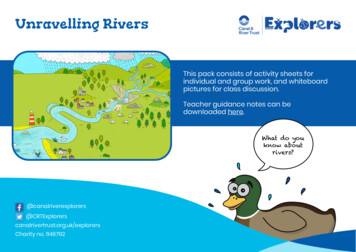
7. The St. Johns River SystemCarole L. DeMortWatershed CharacteristicsThe St. Johns River is the longest river in Florida and is unique among the larger riversof the United States in its northward flow. It is a coastal plain river that arises in the lowfreshwater marshes of St. Lucie and Indian River Counties, west ofFt. Pierce. From itsheadwaters, it flows northward 440 km to Jacksonville, then turns east 40 km to emptyinto the Atlantic Ocean at Mayport, Florida. The St. Johns River drains approximately22,790 km 2 0r one fifth of the land area of Florida (Snell and Anderson, 1970) (Figure7.1).The physiography of Northeast Florida consists of barrier islands, coastal duneridges, relict sand dunes, marine terraces, estuaries, and lagoons. These features lie alonga predominantly north-south axis which runs parallel to the coastline. The valleys andsloughs between the ridges are poorly drained and form isolated wetlands and surfacedrainage channels for the numerous rivers and creeks of the region.Three major rivers empty into the ocean in Northeast Florida: the St. Marys, Nassau,and S t. Johns. The S t. Marys River arises in the southeastern part of the vast OkefenokeeSwamp complex of southeastern Georgia and northeastern Florida. The Nassau and St.Johns are entirely coastal plain rivers. The St. Johns is, by far, the largest of these threerivers in terms of length and magnitude of discharge (Snell and Anderson, 1970).The St. Johns River Valley was formed during the Pleistocene epoch as a result ofbarrier island formation 16 to 25 km seaward of the Pleistocene coastline of NortheastFlorida (Cooke, 1945). The barrier islands of the. Pleistocene enclosed a large, elongate
98C.L. DeMort OcalaOrlandoo102030IkmFigure 7.1. The St. Johns River and its tributaries.
7 . St. Johns River99bay running in a north-south direction, parallel to the coastline. At this time, theOklawaha Valley was partially flooded by the sea and the elongate bay was saline. TheOklawaha Ri ver predates the S t. Johns and lies primarily on the Penholloway and Talbotterraces, at elevations between 13 and 19 m. The St. Johns River lies on the Pamlicoterrace, approximately 8 m above sea level. As the sea level dropped, saltwater withinthe ancient bay was replaced by freshwater. Because of the relict dune ridges to the westand the newer dune ridges forming to the east, the north-south valley developedextensive freshwater marshes along the banks and at the headwaters of the river.The St. Johns River drops only 8 m in altitude from source to mouth. This amountsto only a 1% slope and has resulted in the creation of many wide, shallow pools alongits length. These wide, slow-flowing areas of the river are the "lakes" of the St. Johns,beginning with Lake Hellen Blazes in the south and ending with Lake George, the lastand largest of the lakes. Lake George averages less than 3 m in depth and is 20 krn wideat its widest point.The marshes that form the headwaters of the St. Johns are underlain by fibrous peatdeposits. This extensive inland marsh system forms the watershed for three drainagesystems located in north, south, and central Florida. The major storage component of theheadwaters marsh is Blue Cypress Lake, now connected by regulated canal to the riversystem, but formerly connected by natural overland flow directly to the river. Thesouthern part of the marsh flows into the St. Lucie drainage basin. The western portionsdrain into the Kissimmee River Valley, and the northern marshlands drain into the St.Johns basin.The western boundary of the watershed is underlain by the Ocala limestone of theFloridan aquifer. The surface waters percolate through the porous surface sand and shelldeposits and into the limestone aquifer. The permeability of the limestone substrate inthis region results in extensive lateral movement of groundwater. This groundwaterdischarges as nl:lmerous springs within the watershed, many within the riverbed itself(Cooke, 1945) . .ClimatologyThe climate of Northeast Florida is characterized as warm temperate to subtropical. Thearea has a summer rainy season and winter dry season. It is distinctly maritime withextreme temperatures moderated by the close proximity of the Gulf Stream. The weatheris dominated by maritime tropical air masses from June to September and by continentalfrontal systems from September through May (parsant et a!., 1971).Mean annual air temperature for the region is 21OC. The summer months of June, July,and August average 26OC, and the winter months of December, January, and Februaryaverage 12 C. Freezing temperatures occur sporadically as far south as the headwatersof the S t. Johns. During some years, there can be prolonged freezing periods, lastingseveral days. Other years can be very mild with no severe freezes (National Oceanic andAtmospheric Administration, Weather Service, 1982).The mean annual rainfall for the drainage basin is 127 cm. More than 50% fallsbetween June and September. The wettest month' for the lower basin is September and
100C.L. DeMortaverages 17.4 cm. The wettest month for the headwaters marsh area is May. The driestmonth is November and averages 4.93 cm. Most of the precipitation during the summermonths comes from thunderstorms, from the rise of warm, moist air masses inlandduring the day and movement from west to east in the afternoons. These storms arecharacterized by frequent lightning and the generation of brief but sometimes intensetornadoes. The prevailing winds are northeasterlies during the fall and winter monthsand southeasterlies spring and summer. The average wind speed for the region isapproximately 15 km/hr. Although the entire region lies within the Hurricane Belt,hurricanes seldom make landfall in East Central and Northeast Florida. Hurricanes thatdo enter the area generally move parallel to the coast rather than inland from the Atlantic(NOAA, 1982). Northeasters are winter storms that occur frequently in the region. Thesewinter storms can last for several days, and, although without the intensity of hurricanesor tornadoes, such storms have produced greater damage in terms of erosion and propertydamage than the more violent, short-term storms.HydrologyThe average discharge is approximately 156 m3/s- 1 Because of the low stream gradient,tidal reversal may occur as far as Lake Monroe, 190 km upstream from the mouth. Dailytidal reversal typically occurs to Lake George, 160 kIn upstream (Bass and Cox, 1985).The low stream gradient, extensive pooling, and shallow depths result in prolongedretention times within the system. Surface runoff peaks in late summer and earl y autumn.TributariesThe Oklawaha River is the largest tributary within the system. Other major tributariesinclude the Econlochhatcheeand Wekiva Rivers of the upper basil! and Dunns Creek andBlack Creek in the lower S1. Johns basin. The Econlochhatchee River drains the westernslope of the watershed between Orlando and Bithlo. The headwaters for this subsysteminclude a large area of swamp and a Karst area with no overland runoff. The lowerchannel of this tributary is cut into the shallow water aquifer, which provides base-floweven during extremely low flow conditions. The main flow into the Wekiva River comesfrom groundwater discharge from the Floridan aquifer, since most of the drainage basinis Karst topography with no overland flow (Snell and Anderson, 1970).Dunns Creek, the first major tributary of the lower basin, drains a mosaic of terrainconsisting of swamps and Karst lakes. Crescent Lake is part of the Dunns Creeksubsystem. The flow in the lower part of the system is subject to tidal reversal twice aday because of the back-flow from the main channel of the S1. Johns.The second major tributary in the lower S1. Johns basin is Black Creek (Figure 7.2):Black Creek drains a portion of the eastern slope of Trail Ridge, a relict dune ridge thatextends from Putnam County in Florida northward into southeastern Georgia. TrailRidge forms the western watershed for much of the northern portion of the S1. Johnsbasin. Black Creek divides into a South and North Fork several km above the city ofMiddleburg. Both of these forks cut into the limestone bedrock and contain swiftly
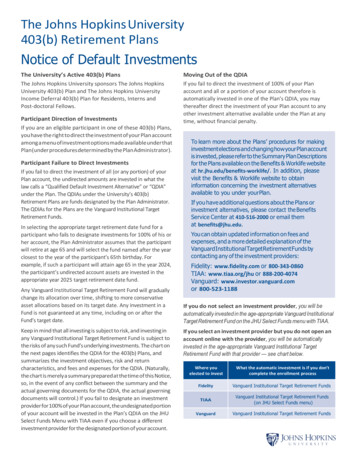
7. St. Johns River101flowing rock rapids. Another unique characteristic of this stream is the extreme depthsof several " deep holes" (down to 30 m) between Middleburg and the mouth of the creek.Main ChannelThe main channel of the St. Johns contains eight shallow lakes. LaIces Hellen Blazes,Sawgrass, and Washington are peat bottomed lakes with extensive marsh areas andconnect the headwaters marshlands with Lake Winder. From Lake Winder northward toLake Poinsett, the river becomes more channelized and has a firm, sandy bottom. Theriver then passes through a wide valley with numerous palmetto islands and marshes. Itmeanders widely through braided channels and experiences wide water level fluctuations from high flow to low flow years.Next, in the Puzzle Lake area, ancient marine salt deposits produce surface watersalinities as high as 10 to 11 parts per thousand (ppt). This has a major effect on theecology of the area. The river enters Lake Harney just north of the Puzzle Lake area.North of Lake Harney the river develops well defined, elevated banks. Between LakeHarney and Lake Monroe, the Mullet Lake slough drains into the St. Johns. Mullet Lakebecomes a series of circular pools during low flow conditions. This area, like the PuzzleLake region, is also saline due to shallow, marine salt deposits.Lake Jessup is a large, shallow lake that drains into the S t. Johns between Lake Harneyand Lake Monroe, west and slightly north of the Mullet Lake slough. The topographysurrounding Lake Jessup is low and marshy, and it is being enriched by drainage fromthe rapidly developing areas around Allamonte Springs, Longwood, and Casselberry.Because of its shallow depths and low relief, nutrient assimilation and retention timesare greatly increased, creating eutrophication problems.From Lake Monroe north to Lake George, the river banks become more elevated andthe river narrows. The current is faster and water level fluctuations are less extreme.Numerous streams discharge into the main channel and the tributaries in this section ofthe river. These springs include Blue Springs, DeLeon Springs,and Alexander Springs,the fourth largest spring in Florida (Rosenau et al., 1978).The river enters Lake George several km north of the Alexander Springs discharge.The western bank of Lake George is bordered by high relict dunes. The eastern shorelineis low and seasonally flooded. Juniper, Silver Glenn, and Salt Springs discharge viacreeks into the western edge of Lake George. The Oklawaha River empties into the St.Johns north of Lake George, near Welaka (see Chapter 6 for a description of theOklawaha River). From Palatka to Jacksonville, the river widens from 1.5 to 5.0 km withaverage depths of less than 3 m.The river channel narrows at Jacksonville and turns eastward to the Atlantic (Figure7.2). The channel deepens to 9 m and is deeper than 18 m in some tidally scoured anddredged areas east of the Acosta Bridge in Jacksonville.Water QualityFrom the headwater marshes to the mouth of the Econlockhatchee River, nutrient
102C.L. DeMortl r:il Z::!oooml zGREEN COVESPRINGSFigure 7.2. Map of the 'lower St. Johns River showing tributaries and cities.concentrations are below state water quality standards. Averages for nitrate nitrogen(N03) are below the expected maximum of 0.5 parts per million (ppm), and totalphosphorus concentrations are below the expected maximum of 1.5 ppm. From LakeHamey to Lake George, total nitrogen and phosphorus concentrations are high, abovestate water quality standards (Florida Department of Environmental Regulation, 1980).Dissolved oxygen concentrations frequently fall below the state standard of 5.0 ppm,often to 0 in some reaches, during the months of July and August. In July and August,
7. St. Johns River1031978, no dissolved oxygen was found in the river from Blue Cypress Lake to north ofLake Poinsett. Dissolved oxygen, total nitrogen, and phosphorus concentrations forselected sites from Lake Washington to the St. Johns at Astor are given in Table 7,1 .The mean annual temperature for the upper St. Johns River for 1980-1986 was 23.6OC(Crumpton et aI., 1987). The mean annual water temperature for the St. Johns River atSanford for a 25-year period from 1930 through 1954 was 240C (McClane, 1955). Theminimum temperature was 6 C and the maximum was 38 C. The water quality fromLake George north to Duval County is "fairly good" (FDER, 1980). The water qualitydecreases as it enters Duval County and increases toward the mouth of the river. Totalnitrogen, total phosphorous, and dissolved oxygen concentrations for five locationsfrom the Oklawaha River to the Main Street Bridge at Jacksonville are given in Table7.2.Rice Creek had the highest average nitrate nitrogen concentrations; Cedar River hadthe highest total phosphate concentrations and the lowest dissolved oxygen concentrations from 1975-1982 (unpublished data, University of North Florida Coastal FisheriesLab). Main stream sites in the lower river tended to have higher water quality for theparameters of nutrients and dissolved oxygen than impacted tributaries (Table 7.3).Table 7.1. Concentrations of Dissolved Oxygen, Total Phosphorus, and Total Nitrogen forSelected Stations in Upper St. Johns River*StationSt. Johns LakeWashington exit.EconLake JessupSt. Johns atSanfordLittle WekivaSt. Johns 919741979D.O.*Min. Mean 510.06.87.811.08.0TPMin.Mean Max.03 .08 0.2.03 .06 0.1.42 1.26 3.5.15 .52 1.1.16 .57 0.9.34 .46 .75.17 .27 .43.08 .15 .21.5.9 1.65.19 .43 .79.09 .19 .34.09 .12 .14TNMin.Mean 3*Modified from Florida Department of Environmental Regulation Water Quality ReportDO: Dissolved oxygen. All concentrations are in mg/L.Means were calculated from the phosphorus monthly samples for the year.TP: Total phosphorus1N: Total 1.46
C.L. DeMort104Table 7.2. Concentrations of DO, TP, and TN for Selected Sites in the Lower St. Johns River; 1974and 1979StationDateD.O.*Min. Mean Max.TPMin. Mean Max.TNMin. Mean Max.Oklawaha Riverdownstream ofRodman Dam,197419794.94.67.2 10.97.8 11.1.03.02.13 0:4.09 .38.13.360.6.651.701.08St. Johnsat 6.621.171.591.882.73Ortega River atJacksonville197419792.04.15.6 11.05.9 7.5.22.20.58 1.16.34 0.55.14.581.62 3.601.08 1.63Cedar River atJacksonville197419793.03.44.76.07.07.1.44.66.86 .86.90 1.051.162.263.49 3.574.09 5.43St. Johns atMain Street inJacksonville197419792.55.36.5 11.07.3 9.1.07.12.22.261.23.611.60 2.501.67 2.91.12.52.67*Modified from Florida Department of Environmental Regulation Water Quality Report.DO: Dissolved oxygen. All concentrations are in mg/L.Means were calculated from the phosphorus monthly samples for the year.TP: Total phosphorous1N: Total nitrogenWithin the St. Johns River system as a whole, maximum freshwater discharge occurstypically in October and corresponds with the lowest salinities in the associated estuary. .Specific years and months vary widely for water quality parameters due to rainfall andtemperature fluctuations. Spring-fed sections of the river show relatively constanttemperatures of 20-22 C. The large number of spring boils in the St. Johns modifytemperatures near the spring. Spring temperatures remain a relatively constant 23-24 C.These areas become important thermal refuges for fishes in both winter and summer. Theimpact on downstream waters depends on distance from the spring, river depth, andvelocity.The St. Johns River near the mouth of the Oklawaha River is considerably modifiedby the dilution of mainstream water with the spring-fed Oklawaha. The temperaturerange is less extreme and the water is less turbid than the receiving river water. It is adiurnal, sliding effect caused by tidal reversal. The S t. Johns River, however, is basicallya blackwater river, receiving most of its freshwater input from swamps and marshes andonly a small percentage of total inflow from springs and spring-fed streams.The St. Johns estuary is a river-dominated, moderately stratified system. In the
7. St. Johns River105Table 7.3. Selected Water Quality Parameters for the Stations Located Along the Lower St. JohnsRiver System, 1975-76STATIONLGOK" ". -- -- -- ,Dissolved (range)oxygen (av)Nitrate (range)(av)Total (range)Phosphate (av)Light (range)Penetration (av)Turbidity (range)(JTU'S) 1DCRC, ----- -8.55.50.1-4.11.9.0-0.280.10128-260171Mayport area, there is a horizontal as well as a vertical salinity wedge. The river isregularly brackish during high tide flow as far south as Orange Park, with high tidesalinities from 2 ppt to 5 ppt (See Figure 7.2). During low flow years, the saltwatermixing zone may extend south as far as Welaka. Low tide salinities in the Mandarin areaNorth of Orange Park are less than 1.0 ppt.Biological FactorsWetlandsThere are 37,451 ha of wetlands in Northeast Florida, which represents about 10% of thetotal wetlands in the state (Durako et al. 1987). At present, there is no accurate estimateof the total wetlands in the S1. Johns River drainage system. The wetlands of the upperS1. Johns River to Lake Poinsett consist primarily of freshwater marshes, dominated byPanicum hemitomon (maiden cane), (Pontedaria cordata (pickerel weed), andNupharluteum (spatterdock). Various species of Sagittaria and Cladiumjamaciense ate alsoabundant in these marshes.In the marshes from Lake Poinsett northward, Spartina bakeri (cordgrass) coverslarge areas of intermittently 'flooded wetlands. In the Puzzle Lake area, the water issaline. Spartina bakeri still dominates the marshes. Bacopa monieri (water hyssop),Sesuvium portulacastrum (seaside purselane), and Salicornia bigelovii (glasswort) formextensive mats on wet sands and muds on the upland edges of many of the marshes inthis area. The Mullet Lake slough area contains vegetation similar to the Puzzle Lakesregion, dominated by halophytes.From Lake Monroe to Lake George, the marshes are again dominated by freshwater
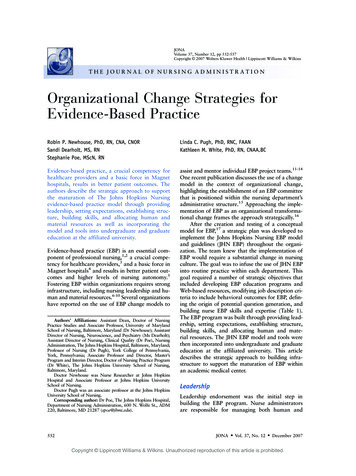
106C.L. DeMortspecies similar to the vegetation above Lake Winder. The marshes on the east side ofLake George are characterized by Nuphar luteum, Eichornia crassipes (wateihyacinth),andAlternanthera pheloxeroides (alligator weed) on the deep water edges andPanicumagrostoides (panic grass), Panic um repens (torpedo grass), Panicum hemitomon (maidencane), Paspalum repens (water paspalum), Scirpus cyperinus (woodgrass bulrush), andseveral species of Sparganium (burreed). The author found several large stands ofPhragmites communis (common reed) within shallow marshes on the west side from1972 to 1981. In 1982, most of these stands had disappeared and contained only a fewplants. Typhus latifolia (cattail) is common in the freshwater marshes throughout thearea, occurring as far north along the St. Johns as Goodby's Creek in Jacksonville. Thefreshwater marshes bordering the river from Lake George north into Jacksonville aresimilar in species composition to Lake George.The wetlands in Duval County are dominated by saltmarshes. Much of the total areaof salt marsh communities of the lower St. Johns is a characteristic high tide marsh offuncus roemerianus (Black Needlerush). High tide marsh occurs extensively throughout the area from the eastward bend of the river to Sisters Creek, along the northernboundary of the watershed (Figure 7.3).Low marsh is limited to the narrow edges of tidal creeks along the north bank to SistersCreek. The greatest percent cover of low marsh dominated by almost pure stands ofSpar tina alterniflora occurs along the southern boundary ofthe watershed and eastwardfrom Sisters Creek to the primary dJjnes along the north bank (Figure 7.3). A species listof the typical salt marsh vegetation for Duval County is given in Table 7.4 (DeMort,1984). The landward barrier island marsh is dominated by Spartina alternifloraanddoesnot typically contain funcus (Figure 7.4).SnailsOystersf------1OystersFigure 7.3. Vegetation zonation of saltmarsh Community at Pelotes Island (North Bank St. JohnsRiver in Duval County).
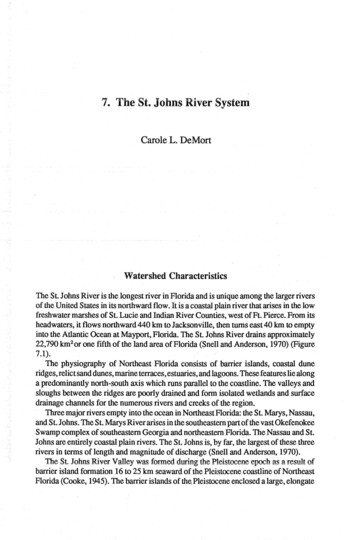
7. St. Johns River107KeyIII Spartinq alfernifloraYY'i'-r-v Salicornia virginica-{'\: 80tls maritima8acchofls halimifoliaSabal palmetoJuncus roemerianus Pinus elliotii11Quercus geminafa ---- -- ----------------------------------MSLFigure 7.4. Black Hammock Island transect.Submerged GrassbedsSubmerged grassbeds are important primary producers and nursery habitats as far northas the Mandarin/Jacksonville Naval Air Station area just north of Orange Park. From thisarea north to the Acosta Bridge, grassbeds are sparse to nonexistent. The bottom fromthe Acosta Bridge to the mouth is characterized by a very soft mud substrate that doesnot support rooted aquatic vegetation in any shallow area with sufficient light penetration. Scoured areas do exist, but these are generally too deep for submerged vegetation.Shallow scoured areas on sand/shell substrates eastward of downtown Jacksonville areoften colonized by Ulva lactuca and several species of Enteromorpha. Vallisneriaamericana (tape grass) is the dominant submerged macrophyte throughout the freshwater sections of the river. Because of the shallow euphotic zone that exists within most ofthe system, subpIerged macrophytes are limited in depth to less than 1 m. Hydrilla israpidly dominating the upper lakes and replacing virtually all native submergents.Macrophyte populations are being studied in the primarily freshwater portion of thelower river from Lake George to Goodby's Creek. These studies include gradient andline transect analysis, monthly sampling for selected stations, quarterly sampling for allstations, and statistical analyses of the data. Preliminary surveys have been carried outin Lake George, Black Creek, Julington Creek, and Buckman Bridge to JacksonvilleNaval Air Station. The dominant macrophyte species found at four of the sample sites,areal coverages, and current status of the grassbeds as of 1987 are given in Table 7.5.Soft-Bottom SubstratesMost of the tributaries and main channels of the St. John are characterized by soft mudand silt bottoms. These sediments contain large quantities ofdecaying organic material,including entire leaves and stems, fibers, and pieces of vegetation. Very little researchhas been carried out concerning soft bottom communities of the St. Johns River.PhytoplanktonThe phytoplankton of the St. Johns River are not well known. Previous studies have
108C.L. DeMortTable 7.4. Duval County salt Marsh Plant SpeciesDominant Species: Batis maritima (Saltwort), Borrichiafrutescens (Sea daisy), Distichlisspicata (Saltgrass), JWlCUS roemerianus (Black needlerush), Spartina alterniflora (Smoothcordgrass), Spartina patens (Marsh hay cordgrass)Associated species: Salicornia virginica (Glasswort), Sesuvium portulacastrum (Sea purslane),Suaeda linearis (Sea blight), Typha angustifolia (Narrow-leaved cattail)Transitional species: Andropgon elliottii (Broom sedge), Baccharis halimifolia (Groundselbush), Batis maritima (Saltwort), Cladium jamtlicense (Sawgrass), lvafruitescens (Marshelder), Limonium carolinianum (Marsh lavender), Lyonia ferruginea (Staggerbush), Myricacerifera (Wax myrtle), Sabal palmetto (Cabbage palm)been limited in their approach and involved primarily freshwater sites and identificationto genus only (Pierce, 1947; GFWFC, Dingell-Johnson Project, 1977). These studiesgive an incomplete picture of the total phytoplankton species diversity and populationswithin the system.TheUniversity of North Florida study was designed to give a detailed picture of theannual cycles of phytoplankton species in the St Johns River estuary system, to identifyphytoplankton associations, to cluster stations based on similarity of species, and toattempt to determine environmental factors controlling the occurrence of individualspecies (DeMort and Bowman, 1985). Three hundred and forty three species ofphytoplankton have been identified from the St. Johns River and the tributaries. Table7 .6 lists the dominant species for the riverine and estuarine sections of the lower riverbasin. The highest averages of species diversity indices were found at the four collectionsites closest to mouth of the river. Lowest diversity indices occurred at the mouth ofTrout River, Cedar River, and Ortega River (see Figure 7.5). The lowest averagediversity indices occurred in Doctor's Lake and Rice Creek.Diatom species outnumbered chlorophyte and cyanophyte species at all stations'throughout most of the study. The major exceptions to this trend were four major bloomsof blue-green algae (Cyanophyta) that occurred in Rice Creek, two blue-green algaeblooms in Cedar River, and one in Doctor's Lake. Seasonal trends of phytoplankton inthe brackish water region from the eastward turn of the river to the mouth typicallyshowed three distinct peaks, with the major peak from June to July and the springincrease less than the winter peak (Figure 7.5). The secondary winter peak occurred infour of the five years of the study and was typically preceded by a week or more of mildtemperatures and terminated by prolonged cold fronts moving into the area from thenorth. The freshwater sites on the river south of Orange Park typically had four peaks ofphytoplankton growth with the highest cell counts frequently occurring in December orJanuary (Figure 7.5). This trend occurred every year of the study, with only minor shiftsin the month of each peak. These results are in contrast with Livingston's study ofApalachicola Bay, which showed major peaks in March and April with fall and winter
1097. St. Johns RiverTable 7.5. Principal Submerged Macrophyte Associations for Four Selected Sites in Lower St.Johns RiverArealcoverageCurrent Statusof seagrasses(1982-1987)SiteDominant speciesLake George1. Vallisneria americana2. Ceratophyllum demersum3. Nais guadalupensis4. Potamogeton illinoensis5. Hydrilla verticiliata9171. Vallisneria americana2. Ceratophyllum demersum3. Egeria densa4. Sagittaria subulata5. Ruppia maritima98Black Creek1. Vallisneria americana2. Ceratophyllum demersum3. Nais guadalupensis4. Potamogeton illinoensis5. Sagittaria kurziana416443Areal coveragefluctuated10-20 % over3 year period/speciescompositionBuckman Bridge(mandarin area)1. Vallisneria americana2. Ruppia maritima3. Potamogeton pectinatus4. Ceratophyllum demersum5. Enteromorpha intestinalis6. Ulva lactuca1-231108Areal coverageincreasing30% since1982. speciescompositionfluctuates(especially relativeabuncance of# 1 and 2)Hallowes Cove55Areal coverageand speciescompositionstable3510101055Areal coverageand speciescompositionStableminima (Livingston et al., 1976). The population peaks showed a close correlation withpeaks in chlorophyll concentration (DeMort and Bowman, 1985). The only exceptionThis imported detritus, along with the detritus produced within the river system itself,
110C.L. DeMortTable 7.6. Phytoplankton Species Comprising 1 % or More of Total Count* for Freshwater andBrackish Sections of the Lower St. John's RiverEstuarine (Goodby's Creek to river mouth)1.2.3.4.5.6.60.0%24.2%4 .8%1.5%1.4%1.0%Skeletonema costatumMelosira italicaChaetoceros decipiensThalassionema nitzschioidesRhizosolenia alataCoscinodiscus lineatusRiverine Doctor's Lake to Lake George)1.2.3.4.5.Melosira italicaAnabaena circinalisPediastrum simplexOscillataria sp.Pedi(Jstrum duplex81.0%10.1%2.0%2.0%1.0%*Based on five year averages of total annual cell count, 1975-1980.The major peaks in chlorophyll concentration occurred in July or August. This indicatesthat there were large numbers of small-celled phytoplankton missed by the plankton netsduring summer collections.The lower St. Johns River phytoplankton data indicate a system that varies frommesotrophic to eutrophic. Melosira italica, an extremely tolerant species, is characteristic of all stations sampled except the most saline areas close to.the mouth. However,the stations near the mouth frequently were dominated by Skeletonema costatum, anequally pollution-tolerant species that is limited to more saline water. The presence ofblue-green algal blooms in some tributaries was also indicative of a system in trouble interms of nutrient-loading. The phytoplankton data indicated that Rice Creek and CedarRiver are the most pollution-affected subsystems. These findings correlate with waterquality data for these systems (see Water Quality section).ZooplanktonThe zooplankton of the lower St. Johns River were studied by DeMort and Bowman(1985). Data collection for the freshwater sites along the lower St. Johns closely agreeswith upper basin studies carried out by other investigators (pierce, 1947; GFWFC,Dingell-JohnsonProject, 1977). Eighty five zooplankton were identified to the lowesttaxa possible. Table 7.7 lists the dominant taxa for river-estuarine sections of the lowerriver as previously given in the phytoplankton section. The highest average speciesdiversity indices occurred at the four most saline sites, from Clapboard Creek to the
7. St. Johns gSepOctNoV'DecMONTH- -a . CLAPBOARD CR. LAKE GEORGEFigure 7.5. A. Seasonal cycle of phytoplankton in clapboard Creek, 1980. B. Seasonal cycle ofphytoplankton in Lake George, 1980.mouth of the river. The lowest species diversity occurred at Rice Creek; however, thelowest annual average species diversities occurred in the downtown Jacksonville areaand in Cedar River.
Johns River 101 flowing rock rapids. Another unique characteristic of this stream is the extreme depths of several" deep holes" (down to 30 m) between Middleburg and the mouth of the creek. . This area, like the Puzzle Lake region, is also saline due to shallow, marine salt deposits. Lake Jessup is a large, shallow lake that drains into the S .