Transcription
2015 ComprehensiveAnnual Financial ReportsYears Ended September 30, 2015 and 2014SAN ANTONIO, TEXAS
San Antonio, Texas2015ComprehensiveAnnualFinancial ReportYear s E nde d S e p te mb e r 3 0, 2 01 5 a n d 2 014Prepared by the Fiscal Management DivisionSteven J. LangeVice President Fiscal Management/CFOVIA Metropolitan TransitSan Antonio, Texas
Highlight:2015 Youth Art Contest Best of Show winning poster byThanh Nguyen, 9th grade, Roosevelt High School2
Table of ContentsSection 1 – IntroductoryLetter of Transmittal . . . . . . . . . . . . . . . . . . . . . . . . . . . . . . . . . . . . . . . . . . . . . . . . . . . . . . 5Certificate of Achievement for Excellence in Financial Reporting . . . . . . . . . . . . . . . . . . . . . 21VIA Board of Trustees . . . . . . . . . . . . . . . . . . . . . . . . . . . . . . . . . . . . . . . . . . . . . . . . 22 – 23Organizational Chart . . . . . . . . . . . . . . . . . . . . . . . . . . . . . . . . . . . . . . . . . . . . . . . . . . . . . 24VIA Service Area . . . . . . . . . . . . . . . . . . . . . . . . . . . . . . . . . . . . . . . . . . . . . . . . . . . . . . . 25Section 2 – FinancialIndependent Auditor’s Report. . . . . . . . . . . . . . . . . . . . . . . . . . . . . . . . . . . . . . . . . . . . . . . 27Management’s Discussion and Analysis . . . . . . . . . . . . . . . . . . . . . . . . . . . . . . . . . . . . . . . 31Basic Financial StatementsStatements of Net Position. . . . . . . . . . . . . . . . . . . . . . . . . . . . . . . . . . . . . . . . . . . . . . 48Statements of Revenues, Expenses, and Changesin Net Position . . . . . . . . . . . . . . . . . . . . . . . . . . . . . . . . . . . . . . . . . . . . . . . . . . . . 51Statements of Cash Flows. . . . . . . . . . . . . . . . . . . . . . . . . . . . . . . . . . . . . . . . . . . . . . . 52Notes to the Financial Statements. . . . . . . . . . . . . . . . . . . . . . . . . . . . . . . . . . . . . . . . . 55Required Supplementary InformationSchedule of Changes in Net Pension Liability – Unaudited. . . . . . . . . . . . . . . . . . . . . . . . 96Schedule of VIA’s Pension Contributions - Unaudited. . . . . . . . . . . . . . . . . . . . . . . . . . . . 97Schedule of Funding Progress - Unaudited . . . . . . . . . . . . . . . . . . . . . . . . . . . . . . . . . . . 98Notes to the Required Supplementary Information - Unaudited. . . . . . . . . . . . . . . . . . . . . 99Other Supplementary InformationCombining Schedule of Net Position. . . . . . . . . . . . . . . . . . . . . . . . . . . . . . . . . . . . . . . 102Combining Schedule of Revenues, Expenses, and Changesin Net Position . . . . . . . . . . . . . . . . . . . . . . . . . . . . . . . . . . . . . . . . . . . . . . . . . . . 105Combining Schedule of Cash Flows . . . . . . . . . . . . . . . . . . . . . . . . . . . . . . . . . . . . . . . 106Schedule of Revenues, Expenses, and Changesin Net Position – Budget (GAAP Basis) and Actual . . . . . . . . . . . . . . . . . . . . . . . . . . 108Schedule of Operating Expenses by Expense Category and Cost Center. . . . . . . . . . . . . 110Section 3 – StatisticalNet Position . . . . . . . . . . . . . . . . . . . . . . . . . . . . . . . . . . . . . . . . . . . . . . . . . . . . . . . . . . 116Changes in Net Position . . . . . . . . . . . . . . . . . . . . . . . . . . . . . . . . . . . . . . . . . . . . . . . . . 118Direct and Overlapping Sales Tax Rates. . . . . . . . . . . . . . . . . . . . . . . . . . . . . . . . . . . . . . 120Estimated MTA/ATD Sales Tax Receipts by City . . . . . . . . . . . . . . . . . . . . . . . . . . . . . . . . 122Schedule of Oustanding Debt and Public Debt Coverage Ratios . . . . . . . . . . . . . . . . . . . . 124Demographic and Economic Statistics . . . . . . . . . . . . . . . . . . . . . . . . . . . . . . . . . . . . . . . 125Principal Employers . . . . . . . . . . . . . . . . . . . . . . . . . . . . . . . . . . . . . . . . . . . . . . . . . . . . 126Full Time Equivalents . . . . . . . . . . . . . . . . . . . . . . . . . . . . . . . . . . . . . . . . . . . . . . . . . . . 127Fare History . . . . . . . . . . . . . . . . . . . . . . . . . . . . . . . . . . . . . . . . . . . . . . . . . . . . . . . . . . 128Line Service Statistics . . . . . . . . . . . . . . . . . . . . . . . . . . . . . . . . . . . . . . . . . . . . . . . . . . 129VIAtrans Service Statistics . . . . . . . . . . . . . . . . . . . . . . . . . . . . . . . . . . . . . . . . . . . . . . . 130Line Service Recovery Rate . . . . . . . . . . . . . . . . . . . . . . . . . . . . . . . . . . . . . . . . . . . . . . 131VIAtrans Service Recovery Rate . . . . . . . . . . . . . . . . . . . . . . . . . . . . . . . . . . . . . . . . . . . 131Service Miles by Cost Center . . . . . . . . . . . . . . . . . . . . . . . . . . . . . . . . . . . . . . . . . . . . . 132Service Hours by Cost Center . . . . . . . . . . . . . . . . . . . . . . . . . . . . . . . . . . . . . . . . . . . . . 132Revenues by Source . . . . . . . . . . . . . . . . . . . . . . . . . . . . . . . . . . . . . . . . . . . . . . . . . . . . 1333
Operating Expenses by Cost Center . . . . . . . . . . . . . . . . . . . . . . . . . . . . . . . . . . . . . . . . 133Operating Expenses by Object Class . . . . . . . . . . . . . . . . . . . . . . . . . . . . . . . . . . . . . . . . 134Capital Assets . . . . . . . . . . . . . . . . . . . . . . . . . . . . . . . . . . . . . . . . . . . . . . . . . . . . . . . . 136Changes in Retirement Plan Changes Net Position . . . . . . . . . . . . . . . . . . . . . . . . . . . . . 138Benefit and Refund Deductions from Net Position by Type . . . . . . . . . . . . . . . . . . . . . . . . 138Retired Members by Type of Benefit . . . . . . . . . . . . . . . . . . . . . . . . . . . . . . . . . . . . . . . . 139Schedule of Average Benefit Payment Amounts . . . . . . . . . . . . . . . . . . . . . . . . . . . . . . . . 1404
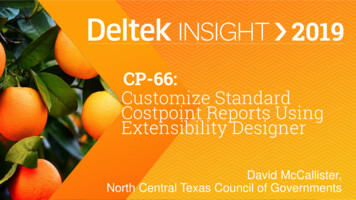
IntroductoryLetter of Transmittal . . . . . . . . . . . . . . . . . . . . . . . . . . . . . . . . . . . . . . . . . . . . . . . . . . . . . . 5Certificate of Achievement for Excellence in Financial Reporting . . . . . . . . . . . . . . . . . . . . . 21VIA Board of Trustees . . . . . . . . . . . . . . . . . . . . . . . . . . . . . . . . . . . . . . . . . . . . . . . .22 – 23Organizational Chart . . . . . . . . . . . . . . . . . . . . . . . . . . . . . . . . . . . . . . . . . . . . . . . . . . . . . 24VIA Service Area . . . . . . . . . . . . . . . . . . . . . . . . . . . . . . . . . . . . . . . . . . . . . . . . . . . . . . . 25Centro Plaza at VIA Villa opened for service in November 2015.
March 1, 2016Citizens of the VIA Metropolitan Transit Service Area:We are pleased to submit to you the Comprehensive Annual Financial Report (CAFR) of VIAMetropolitan Transit for the fiscal year ended September 30, 2015. The CAFR is prepared annually tosatisfy Texas statute and Federal Single Audit Act requirements to have an annual audit of our basicfinancial statements. The audit is to be performed by an independent certified public accountantor a firm of independent certified public accountants. This report is published and respectfullysubmitted to fulfill that requirement.Management assumes full responsibility for the completeness and reliability of the informationcontained in this report, based upon a comprehensive framework of internal control that it hasestablished for this purpose. The internal control is designed to provide reasonable, rather thanabsolute, assurance that the financial statements are free of any material misstatements. We believethe data, as presented, is accurate in all material respects and that it is presented in a mannerdesigned to fairly set forth the financial position and results of operations of VIA in accordance withU.S. generally accepted accounting principles (GAAP) for local government units. All disclosuresnecessary to enable the reader to gain an understanding of VIA’s financial affairs have been included.This report is presented in three parts:1. The Introductory Section includes this letter of transmittal, the 2014 Government FinanceOfficers Association’s Certificate of Achievement for Excellence in Financial Reporting, anorganizational chart and a listing of the Board of Trustees.2. The Financial Section presents the Independent Auditor’s Report, Management’s Discussionand Analysis (MD&A), and the basic financial statements with accompanying notes.3. The Statistical Section provides unaudited financial, economic and other miscellaneousinformation that is useful for indicating trends for comparative fiscal periods.5
VIA’s independent auditor, Padgett, Stratemann & Co., LLP has rendered an unmodified opinionon VIA’s financial statements for the year ended September 30, 2015. The independent auditor’sreport is presented as the first item in the financial section of this report.Management’s discussion and analysis immediately follows the independent auditor’s report andprovides a narrative introduction, overview, and analysis of the basic financial statements. This letterof transmittal is designed to complement the MD&A and should be read in conjunction with it.Profile of the GovernmentVIA is a Metropolitan Transit Authority established on March 1, 1978, under the provisions prescribedin Article 1118x, Revised Civil Statutes of Texas (now codified as Ch. 451, Texas Transportation Code)to provide public transportation services for the citizens of Bexar County, which includes the City ofSan Antonio, Texas. The system’s legal name is VIA Metropolitan Transit.A confirmation election was held in Bexar County in 1977 and voters approved the creation andfunding of VIA through a one-half cent sales tax levied in San Antonio and seven other incorporatedmunicipalities. In March of 1978, VIA purchased transit system assets from the City of San Antonioand began operations. Today, VIA’s service area consists of the unincorporated area of Bexar Countyand 13 municipalities including the City of San Antonio.On November 2, 2004, the voters of San Antonio approved the creation of an Advanced TransportationDistrict (ATD) for mobility enhancement and advanced transportation. The ATD is authorized toimpose sales and use tax of one-fourth of one percent to be allocated 50% to VIA MetropolitanTransit, 25% to the City of San Antonio, and 25% as a local share to be leveraged with State and federalgrants (the local share has gone to the Texas Department of Transportation and Bexar County).The funds are used for “advanced transportation” and “mobility enhancement,” which includes itemssuch as transportation services, operations, transportation amenities, equipment, construction,improvements to streets and sidewalks, and, the local share for state and federal grants for ATDrelated capital projects, such as improving highways and transportation infrastructure.VIA is governed by an eleven-member Board of Trustees appointed to staggered two-year terms.Five members are appointed by the San Antonio City Council, three members are appointedby the Bexar County Commissioners and two are named by the Suburban Council of Mayors.The Chair is elected by the VIA Board of Trustees.The Board determines policy and directs VIA, with the President serving as the Chief ExecutiveOfficer. Subject to policy direction from the Board, the President is responsible for daily operationsof VIA.6
ServiceThe service area is comprised of 1,213 square miles, all of which are in Bexar County. This represents97% of Bexar County. VIA operates on a street network of approximately 1,021 miles and in FY15carried an average of 127,204 passengers on weekdays. In FY15, VIA transported 42.2 millionpassengers and provided 2.3 million hours of service over 35.6 million miles.Service is currently available seven days a week, from 4:00 a.m. until 1:00 a.m., with a fleet of460 buses and 116 Paratransit vans (excluding contract service) maintained by an around-the-clockmaintenance department.BudgetThe State of Texas requires that transit authorities, such as VIA Metropolitan Transit, adopt anannual operating budget before the start of a new fiscal year. VIA establishes a budget that isappropriately monitored through the accounting system to ensure effective budgetary control andaccountability. It is the responsibility of each division to administer its operation in such a manneras to ensure that the use of funds is consistent with the goals and programs authorized by the Boardof Trustees and that the total approved budget is not exceeded. The Board receives and reviewsbudget performance reports, in a summarized format, at the monthly board meeting.Economic Condition and OutlookOverviewSan Antonio’s economy lost steam in 2015, but was still among the top-performing U.S. citiesin 2015, according to the Milken Institute. San Antonio ranks No. 12 in economic growth on theinstitute’s recently released Best-Performing Cities report for 2015–two spots lower than the cityranked in 2014. San Antonio’s drop is due in part to reduced activity in the Eagle Ford Shale regionsouth of the city, which could also lead to slower growth in the region moving forward. Although jobgrowth in the San Antonio area has been impressive over the last five years, there are indicationsthat the trend is slowing. San Antonio’s job growth ranked 15th in the U.S. between 2009 and 2014,but dropped to 30th between 2013 and 2014, according to Milken Institute officials.San Antonio’s economy is expected to be strong in 2016. According to Moody’s Analytics, theSan Antonio-New Braunfels economy should grow steadily in 2016, led by its private serviceindustries, particularly hospitality, healthcare and professional. Above-average population gains,low costs of doing business, and relatively high housing affordability should contribute to aboveaverage overall performance.San Antonio is the seventh-largest city in the United States and the second largest in Texas. With apopulation of more than 1.4 million, San Antonio thrives as one of the fastest-growing cities in theU.S. As of December 2015, San Antonio’s unemployment rate was 3.5%, according to the Bureau ofLabor Statistics, well below the national average. San Antonio has a skilled workforce of more thana million, and has nearly 160,000 students in 15 area colleges and universities.7
Growth for the San Antonio area has been led by the construction and business services sectors.Personal services and local government are advancing slowly and manufacturing has leveled off.San Antonio’s housing market is in the midst of a recovery. Nonresidential construction will be asource of growth due to infrastructure building. The largest nonresidential construction projectunderway is the 325 million expansion of the Henry B. Gonzalez Convention Center.VIA’s financial results are significantly impacted by sales tax collections, which account for slightlymore than 75% of VIA’s budgeted revenues in 2016, and are driven by the local economy. In 2015,VIA’s sales taxes were up 4.1% from the prior year. VIA’s budgeted sales taxes for 2016 reflect closeto a 4.8% increase over actual 2015 sales taxes. When the 2016 sales tax budget was developed,the budget reflected a 4.25% increase over forecasted FY15 sales taxes.San Antonio’s EconomySan Antonio’s dynamic and diverse economy is a healthy mix of industries, including tourism,a large military/defense industry, a rapidly growing biosciences and healthcare industry sector, anda diversified manufacturing sector, producing everything from aircraft and semiconductors to Toyotatrucks. San Antonio’s aerospace, information technology and cyber security, financial services, andeducation sectors are also strong. There is also an emerging renewable energy industry. Informationon some of the key industry sectors favorably impacting the San Antonio MSA economy is providedbelow. This information was obtained primarily from the San Antonio Economic DevelopmentFoundation website, and other economic and local news sources.The hospitality industry has been a long-standing driver of economic activity in San Antonio.Historically, San Antonio has benefitted from such attractions as the Alamo, Sea World, the RiverWalk, and Six Flags Fiesta Texas. A fairly recent study, conducted by Trinity professors Richard Butlerand Mary Stefl, places the economic impact of San Antonio’s hospitality industry at 13.4 billion.That figure is based on 2013 numbers, and is a 66% increase over the 2003 economic impact.San Antonio’s hospitality sector now employs more than 122,000 people and accounts for an annualpayroll approaching 2.5 billion. According to the San Antonio Convention and Visitors Bureau, thecity is visited by approximately 31 million tourists per year.The military has had a significant presence in San Antonio for many years, and has a substantialimpact on the local economy. The first military flight took place at Fort Sam Houston in 1910.San Antonio is home to Lackland Air Force Base, Brooks City-Base, Fort Sam Houston, Randolph AirForce Base, Camp Bullis, and Camp Stanley, as well as leading government contractors such as Boeing,Lockheed Martin, Pratt & Whitney, General Electric, and Sin-Swearingen. Each year, over 35,000new recruits go through the Air Force Basic Military Training (AFBMT). The Air Intelligence Agencyis located at Lackland Air Force Base; Brooke Army Medical Center is the leading treatment centerfor burn victims in the military; and Fort Sam Houston is the home of Army medicine. Many othermajor missions are also present in San Antonio. Fort Sam Houston is the largest medical educationcenter in the world and provides the medical training for the US military with 30 programs and over24,000 annual graduates. Lackland Air Force Base, Fort Sam Houston, and Randolph Air Force Baseare among the top 10 major regional employers in San Antonio in 2014, with approximately 37,000,32,000, and 11,000 employees, respectively. The military presence will continue to lend stabilityand contribute to economic expansion in the metropolitan area.8
San Antonio’s biosciences and healthcare industry is a dominant force in the city’s economy.San Antonio has a diverse mix of nationally-recognized healthcare systems, well-regarded researchinstitutions, health profession education programs, cutting-edge biotech companies and successfulnational corporations. In 2014, according to a Greater San Antonio Chamber of Commerce study, theeconomic impact of the bioscience and healthcare industry was more than 23.9 billion measuredconservatively or 30.6 billion by a more comprehensive estimate (the comprehensive estimatetakes into account the full impact of academic and military medicine, integral components ofSan Antonio’s biomedical sector). One in every six San Antonio employees works in the biosciencesand healthcare industry. The industry has more than 164,000 employees.San Antonio has a large and diverse manufacturing industry, with representation from everymajor sector of U.S. manufacturing, including materials and electricity, equipment and metal,transportation, and diversified products. According to the 2014 Texas Manufacturers Register,San Antonio ranked as the fourth-largest manufacturing market in Texas, with 57,055 jobs.San Antonio’s aerospace industry includes a wide range of businesses that manufacture aircraftequipment and parts, service and repair aircraft, produce and distribute transportation equipmentand supplies, provide both scheduled and unscheduled air transportation, and operate flightschools. The local aerospace industry has grown by over 400% during the last 25 years. The industryemploys more than 13,000 workers and provides an average wage of 59,801 per year.San Antonio’s information technology (IT) industry also plays a major economic role. The mostrecent economic impact of the IT and Cybersecurity industry measures at 8 billion. The industryis large and diverse, including IT and internet-related firms that produce and sell informationtechnology products. San Antonio is particularly strong in information security, and has come to berecognized as a national leader in this vital field, with the U.S. Air Force’s Air Intelligence Agency,a large and growing National Security Agency presence, and the Center for Infrastructure Assuranceand Security at the University of Texas at San Antonio.The financial services industry is one of San Antonio’s most stable, promising and significant businesssectors. This sector includes: banking and credit; investment activities; insurance; funds, trusts andother financial vehicles; and, accounting and bookkeeping. The largest San Antonio area basedbanks include Frost Bank, Broadway Bank, Jefferson State Bank, The Bank of San Antonio, and LoneStar Capital Bank. This sector employs more than 60,500 people.Education is an important sector of the local economy, with San Antonio having nearly 160,000students at 15 different colleges and universities within a 50 mile radius of the city. Since 2004,combined enrollment at these institutions has grown by over 52%. Through a community-wideinitiative known as SA2020, San Antonio intends to enhance educational opportunities by providingthe community with access to quality education and career opportunities.9
San Antonio is committed to being a leader in investment and training in the new energy economy.Former Mayor of San Antonio and U.S. Secretary of HUD, Henry Cisneros, has formed the Green JobsLeadership Council, a committee of high-level officials to recommend public policy that will helpcreate jobs in the new green economy, which according to the New York Times is the new “greencollar economy.” San Antonio is home to CPS Energy, the country’s largest municipally-owned gasand electric utility company, a leader in innovation and strategic partner to the city’s efforts to growthe renewable energy sector. San Antonio is a national leader in green research technology, and ishome to long-established research entities, including the Texas Sustainable Energy Research Institute(TSERI) at the University of Texas at San Antonio. San Antonio’s effort to lead in this new greeneconomy is known as Mission Verde, an initiative that brings unique and innovative approaches togreen infrastructure, green retrofitting, green jobs programs, and green venture capital.The Eagle Ford Shale has led to new jobs in the energy sector and peripheral industries in theSan Antonio area. The Eagle Ford Shale is the largest oil and gas development in the world basedon capital investment, according to a Wood Mackenzie Report published in January 2013. Althoughthe boom that occurred in this area had positive impacts on San Antonio, they were not an integralreason for the growth of the metropolitan activity because the activity is south of the region.The recent drastic decline of oil prices has slowed energy exploration and production in the EagleFord Shale.A summary of employment by industry for the San Antonio MSA, compared to Texas and the UnitedStates, appears below:Employment Percentages by urableTransportation/UtilitiesWholesale TradeRetail TradeInformationFinancial ActivitiesProf. and Bus. ServicesEduc. and Health ServicesLeisure and Hosp. ServicesOther ServiceGovernmentSan 5.7%13.7%15.4%10.6%4.0%15.7%Source: Moody's Analytics, November 2015 (2014 information).Driven by the strong tourism industry in San Antonio, two of the industries accounting for greaterthan 11% (each) of the employment in San Antonio are leisure/hospitality services and retailtrade. The other largest industry employers include professional/business services, education/health services and government.10
SummarySan Antonio has a diverse economy that is relatively strong and is growing, with solid growthexpected in the future. The growth in 2016 will be fueled by nonresidential construction. Energyrelated manufacturing and services will remain subdued as long as oil prices remain low. San Antoniorecently made the top 10 on Forbes’ list of America’s Fastest Growing Cities.Long-Term Financial PlanningVIA has a five-year financial and capital plan that is updated annually, as well as a Long-RangeComprehensive Transportation Plan (LRCTP) that was adopted by VIA’s Board in July 2011. TheLRCTP is updated every five years, and is currently being updated through 2040. A key purpose ofthese plans is to guide staff and inform the public and other stakeholders of the means by whichcommunity transit needs will be met. The five-year financial projections are developed by analyzinghistorical data, trends, planned service changes, known revenue and expense factors, and otherpertinent information. Some of the key information developed includes five-year schedules of annual:1) revenues and expenses, 2) cash requirements and cash and investment balances, 3) disposition/replacement of revenue vehicles, 4) proposed expenditures on capital facilities and equipment,5) projected availability and use of federal transit grants, and 6) projected debt financing.Relevant Financial PoliciesBasis of AccountingVIA prepares its financial statements using the accrual basis of accounting, treating VIA MetropolitanTransit as an enterprise fund. The financial statements of VIA Metropolitan Transit have been preparedin conformity with U.S. generally accepted accounting principles (GAAP) for local governmentalunits. The Governmental Accounting Standards Board is the accepted standard-setting body forestablishing governmental accounting and financial reporting principles.Cash and InvestmentsState law permits VIA to invest in: fully secured or fully insured certificates of deposit (“CDs”) ofstate and national banks or savings and loan associations located within the State of Texas; directobligations of the United States of America and its agencies; obligations of the State of Texas andits municipalities, school districts, or other political subdivisions; and, obligations guaranteed as toboth principal and interest by the United States of America. VIA’s investment policy conforms to theregulations of the Texas Public Funds Investment Act.Risk ManagementVIA is self-insured and self-administered for public liability and property damage claims. Claims arepaid from general operating revenues. Extensive cost containment efforts, such as an aggressivesubrogation recovery program and medical invoice audits, are employed to help minimize the costof these programs.11
VIA has fire and extended coverage on scheduled buildings, contents, buses and vans. Thepurchased coverage is to cover catastrophic losses in excess of the 500,000 deductible carried.VIA maintains a cash reserve equal to the deductible carried. Contractors who perform servicesfor VIA are required to carry adequate insurance coverage and to add VIA as an additional insured.These requirements are monitored carefully to protect VIA’s insurable interests.Major InitiativesVIA’s FY16 key budget objective can be summarized as building better transit–improving VIAservices and amenities while engaging the community to embrace public transportation asa desirable travel option, thereby increasing ridership and building for the future. VIA’s majorinitiative for FY16 is a commitment to our riders that is highlighted by an increase in scheduledservice of nearly 4%–to the highest level in VIA’s history. Complementing the service improvementsis a transit shelter expansion program that will add nearly 1,000 shelters throughout the servicearea. VIA will also work with other local entities to advance the Long-Range ComprehensiveTransportation Plan, upgrade existing transit centers, advance new park & ride facilities, andexpand Primo (Bus Rapid Transit) service into the South and West side. Additionally, VIA plansto purchase 390 compressed natural gas (CNG) buses ove
Economic Condition and Outlook Overview San Antonio's economy lost steam in 2015, but was still among the top-performing U.S. cities in 2015, according to the Milken Institute. San Antonio ranks No. 12 in economic growth on the institute's recently released Best-Performing Cities report for 2015-two spots lower than the city ranked in 2014.