Transcription
QuickBooks Online Student GuideChapter 11Reports inQuickBooks
2 Chapter 11Table of ContentsLesson Objectives 3Report Centre 3Report Types 9Transaction Reports 9List Reports 10Summary Reports vs. Detail Reports 14Key Reports for Your Business 15Reports Display 19Customize Reports 22Save Custom Reports 27
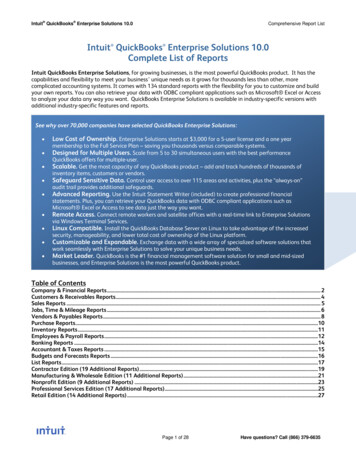
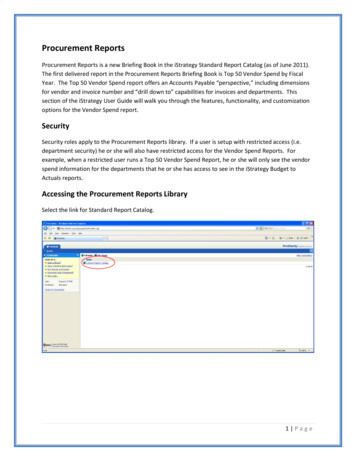
Reports in QuickBooksIn this chapter, you’ll learn how QuickBooks helps you find information in your business.Lesson ObjectivesIn this chapter, you’ll learn how to: Create basic reports Customize reports using filters Customize report views including columns Save customized reports Export reports to .pdf or Excel formatsReport CentreThe Reports Centre is located on the navigation menu. The Reports Centre includes a list of presetQuickBooks reports detailing information about different parts of your business. The ReportsCentre makes it easy to find financial information about your business.The Reports Centre is divided into three tabs. The tabs are located at the top of the Reports Centre.The tabs include: Standard—this tab includes all of the standard preset reports available to you in QuickBooks.The reports included in this tab are automatically created by QuickBooks using the data fromlists, transactions and other functions completed in QuickBooks. Most of the reports listed canbe customized to provide custom information for your business.3
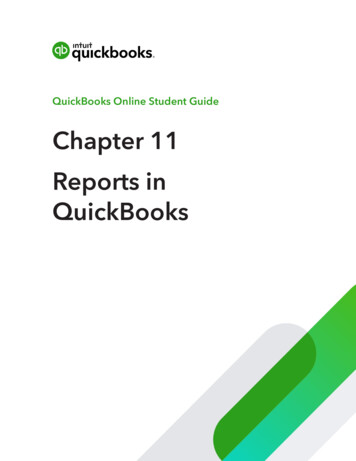
4 Chapter 11 Custom Reports—this tab includes a list of reports that you’ve customized and saved for futureuse. This tab also includes any reports that other users in your company have customized andshared with you. Management Reports—QuickBooks Online Management Reports feature allows you tocustomize a professional looking group of reports complete with cover page, table ofcontents, preliminary pages, reports and end notes. The Management Reports feature willsave you time on running business reports—you won’t have to export out individual reports tosoftware for assembly and finalization.
Reports in QuickBooksIn the All Reports tab, the reports are organized into several categories. The categories include: Favourites—these are reports that you have selected as favourites. To mark a report as afavourite, click the star icon next to the report name. Business overview—this category includes summary and detail reports that report on theperformance and position of your business.5
6 Chapter 11 Who owes you—this category includes reports about the customers who owe you money.Reports in this category include A/R Aging Summary, Collections Report, Open Invoices, andother reports designed to help you manage your customer receivables. Sales and customers—this category includes reports detailing information about your salesmade to your customers. This category reports in detail about sales of products and services,and details about customers who purchases your products and services.NOTE If your company uses QuickBooks Online to track inventory, you’ll accessinventory reports in this category.
Reports in QuickBooks What you owe—this category includes reports detailing information about what money youowe and the suppliers you owe money to. Expenses and suppliers—this category includes reports about your expenses and purchases. Inthis section you’ll find detailed information about purchases including Purchase Order reports,and other purchasing information. Sales tax—this category includes reports about your GST, HST, PST and QST. Whether you trackjust one tax or multiple taxes, QuickBooks reports all of the details in the Sales Tax category.7
8 Chapter 11 Employees—this category reports on employees time tracking information in QuickBooks. For my accountant—this section of reports is dedicated to Accountant reports. These reportsare often used by your accountant to help prepare your year end reports and taxes. Payroll—this category reports on your QuickBooks payroll activities.
Reports in QuickBooksTo learn about the Report Centre watch this video: https://youtu.be/ESE6 gmctP0Report TypesThere are several different types of reports available for you in QuickBooks Online. The basic reportstypes are the following: Transaction reports List reports Summary reports Detail reportsTransaction ReportsTransaction reports make up the largest part of the QuickBooks reports. Transaction reports includestransactions arranged in various formats designed to help you find important information for yourbusiness. There are several critical reports that every business uses in their business. These reportsinclude the following:1. Profit & Loss Report—reports on the financial performance of your business2. Balance Sheet—reports on the financial position of your business3. A/R Aging Summary—reports on your outstanding customer accounts4. A/P Aging Summary—reports on your outstanding supplier accounts5. General Ledger—reports on your transactions by account9
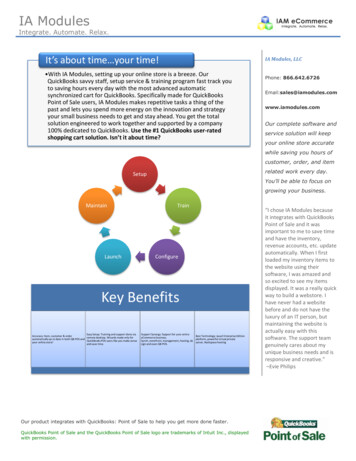
10 Chapter 11QuickBooks Reports include a consistent display to help you understand how to read the reportsand make it easy to find information about your business. See sample report below.NOTE QuickBooks contains 60 reports (QuickBooks Online Plus). If you’re useQuickBooks Online Essentials, you will have access to 40 reports. QuickBooks Online EasyStart includes 20 reports.List ReportsList reports provide you information about the various lists available in QuickBooks. Examplesinclude the Account Listing (Chart of Accounts), Product and Services list, Customer list, and theSupplier List. To create a list report, go to the Reports Centre.
Reports in QuickBooksChart of Accounts1. In the Reports Centre, type Account List.2. Click the Report name when it displays Account List.3. QuickBooks displays the Account List.11
12 Chapter 11Customer List1. In the Reports Centre, go to Sales and customers.2. Click Customer Contact List.
Reports in QuickBooksSupplier List1. In the Reports centre, go to Expenses and suppliers.2. Click Supplier Contact List.NOTE Use the Search field in the Report Centre to access other lists. You can searchfor Classes, Recurring Templates, etc.13
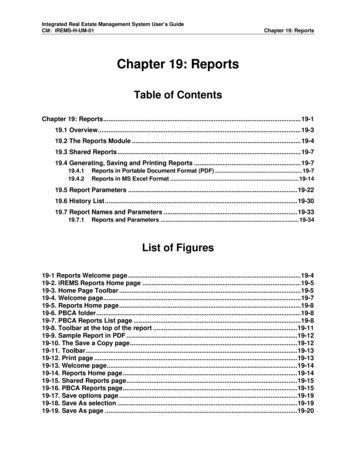
14 Chapter 11Summary Reports vs. Detail ReportsThere are two main types of reports in QuickBooks–Summary reports and Detail Reports. Summaryreports are designed to provide you summary information about customers, sales, expenses andmore. An example is the A/R Aging Summary report. This report displays information on agingcustomer accounts. The report displays “summary” information. The information is displayed in asummary format. See the sample below.Detail reports are designed to provide you detailed information about customers, suppliers,expenses, and more. The A/R Aging Detail report displays detailed information on aging customeraccounts. The report displays “detail” information. Instead of balances and summary information, thedetail report includes individual transactions. See report sample below.
Reports in QuickBooksNOTE Use the Search barto easily find reports in QuickBooksOnline.Key Reports for Your BusinessThe two most important reports for most businesses are the Profit & Loss report and BalanceSheet Report.Profit & Loss ReportThe profit and loss report provides you with your business’ performance in any specific period oftime. This report is also known as an income statement. It summarizes your income and expenses forthe month or year (or any period), so you can tell whether you’re operating at a profit or a loss. Thereport shows subtotals for each income or expense account in your chart of accounts. The last lineshows your net income (or loss) for the month.To create the Profit and Loss report:1. Click Reports.2. Scroll to the Business Overview section and then click Profit & Loss.15
16 Chapter 11Balance Sheet ReportThis report provides a financial snapshot of your company as of a specific date. The report calculateshow much your business is worth (your business’s equity) by subtracting all the money yourcompany owes (liabilities) from everything it owns (assets).To create the Balance Sheet report:1. Click Reports.2. Scroll to the Business Overview section and then click Balance Sheet.A/R Aging Summary ReportThis report summarizes the status of unpaid invoices in accounts receivable. For each customer whoowes money, the report shows: What the customer owes for the current billing period What the customer hasn’t paid from previous billing periods Subtotal balances for each job (if the customer has multiple jobs or projects (sub-customers)with your company.
Reports in QuickBooksTo create the A/R Aging Summary report:1. Go to Reports.2. Scroll down to Who owes you.3. Click A/R Aging Summary.A/P Aging Summary ReportIt summarizes the status of unpaid bills in accounts payable, showing what you owe, who you owe itto, and how much is overdue.For each supplier to whom your company owes money, the report shows how much your companyowes for the current and previous billing periods, and it shows the total amount. The report alsoshows the total amount owed to all suppliers.To create the A/P Aging Summary report:1. Click Reports.2. Scroll to the What you owe section.3. Click A/P Aging Summary.17
18 Chapter 11Accounting ReportsThere are several important accounting reports available to you in QuickBooks Online. From the AllReports page, click For my accountant. Important reports for you and your accountant can be foundon this page. Key reports include: Journal—This report lists every transaction in a period and displays the debits and credits anddisplays them in date order. General Ledger—This report displays all the activity (transactions) that occurred in an accountover a period It include the beginning balance for each account. Transaction List by Date—This report lists all the transactions that occurred within a period oftime. The report is helpful if you need to review all your transactions in date order.To learn about standard reports watch this video: https://youtu.be/hbGYEPmNpXo
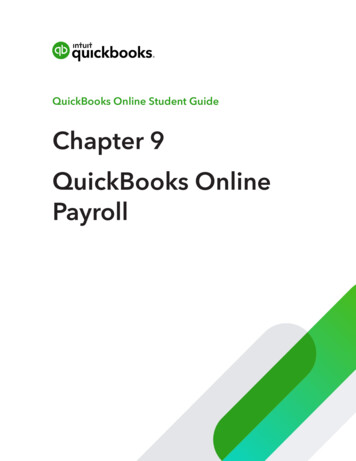
Reports in QuickBooksReports DisplayEvery report in QuickBooks displays common features and options on the report itself. Let’s look atthese features. To review the features, you see a Transaction List by Date Report.Header OptionsIn the top-left corner of the report, QuickBooks lets you choose the date range for the report. Youcan also choose how to group the data on the report. Click Group by to display the option. Forexample, if you wanted to group the report data by Transaction type you would choose that option.Clicking Run report runs the refreshes the report.To customize a report further click Customize. QuickBooks displays the customizationoptions for you.19
20 Chapter 11Click Save customization to save the work you’ve done and save the settings and option forthe report.Click Sort by on the report to sort the data on the report.Click Add notes to add text notes to the footer section of the report.NOTE QuickBooks allows up to 4000 characters in the notes field.Click the pencil logo to edit the report title and edit the company information.Click the export and save options on the right-side of the header on any report to send the report toanother format or to email the report.
Reports in QuickBooksClicking the envelope icon lets you email the report. QuickBooks previews the report and lets youmake any changes to the email. Click Email to preview and send the report.Click the Print button to print the report.21
22 Chapter 11Click the Export icon to Export to Excel or Export to PDF. Clicking both options lets you save the filein that format.Click the Gear icon on the report to edit the columns on the report. This same option is availablewhen you click Customize.Use the header options on any report to customize the display of your report. To take yourcustomization options further, click the Customize button.Customize ReportsIn addition to the Header options on every report, QuickBooks lets you customize reports using theCustomize button on any report. Customizing reports lets you customize the following:General—Customize the Report period, and Number format on the report.
Reports in QuickBooksRows/Columns—Add, remove and reorder columns to display on the report.Filters—When you create a report, it may show more information than you need. For example, aSales by Customer report initially shows your sales to all customers for the current month. Thiswould be too much information if all you wanted was to see this month’s sales to one of yourcustomers.Filters let you change the scope of a report. When you apply a filter to a report, you choose howyou want QuickBooks to restrict the report; for example, to certain customers. QuickBooks thenexcludes from the report any transactions that don’t meet your criteria.You can apply filters either one at a time or in combination with each other. Each additional filter youapply further restricts the content of the report.23
24 Chapter 11Header/Footer—Like the options available on the report itself, you can edit the header and footerfrom the Customize window.NOTE If you’d like to customize a report with a lot of detail, it is recommended to startwith a detail report. Detail reports can be customized to a more granular level of detail thansummary reports.Customize Report DetailsTo start customizing a report, open the report that you’d like to customize.1. With the report open, click Customize.2. Edit the General information including the Report Period. Choosing a Number format will applyto the report information. Choose an option to display Negative numbers.3. Click Rows/Columns to expand the options for the report display. Select the columns youwant to display on the report. Selecting a column checkbox moves the selection above theline separating the columns to display and the unselected columns. Reorder the columns bydragging and dropping the icon to the left of the column heading to a location of your choice.
Reports in QuickBooksNOTE Click Reset to defa
4 Chapter 11 Custom Reports—this tab includes a list of reports that you’ve customized and saved for future use. This tab also includes any reports that other users in your company have customized and shared with you. Management Reports—QuickBooks Online Management Reports feature allows you to customize a professional looking group of reports complete with cover page, table of