Transcription
The Big PictureGlobal Asset Allocation 2022 OutlookQuarterly updateFrom Invesco’s Global Market Strategy Office21 November 2021Data as of of 29 October 2021 unless stated otherwise
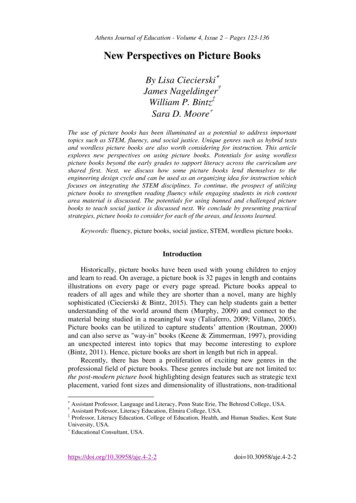
The Big PictureGlobal Asset Allocation: 2022 OutlookGiven our view that 2022 will be a year of transition and that asset class returns will converge,we adopt a more balanced approach within our Model Asset Allocation, though still maintain apreference for cyclical assets. We reduce the equity allocation to Neutral and increase theallocation to bonds, by raising high-yield credit (to Maximum) and investment-grade credit (tojust below Neutral), though we reduce government bonds to the Minimum allowed. From aregional perspective we have added to emerging market (EM) and Eurozone allocations, whilereducing exposure to the US and Japan. We also consider alternative scenarios.Model asset allocationIn our view: Equities offer limited potential as the global economy slows. We reduce to Neutral.Real estate (REITS) has the potential to produce the best returns. We stay at Maximum.Corporate high-yield (HY) is now more attractive (relative to equities). We increase to Maximum.Corporate investment-grade (IG) yields have increased. We increase to Neutral.Government debt outlook is poor. We reduce to Minimum.Cash returns are low but stable and de-correlated (it is our diversifier of choice). We stay at Maximum.Commodities are supported by the cycle but some are expensive. We reduce to Zero.Gold is threatened by rising yields and a stronger USD. We remain at zero.Regionally, we favour the UK and EM (and are Underweight US assets)Our best-in-class assets (based on 12m projected returns) UK equitiesEM real estateEM IGUSD cashFigure 1 – Projected 1-year returns for global assets and neutral portfolioBased on annualised local currency returns. Returns are projected but standard deviation of returns is based on 5-year historical data. Size ofbubbles is in proportion to average pairwise correlation with other assets. Cash is an equally weighted mix of USD, EUR, GBP and JPY.Neutral portfolio weights shown in Figure 3. As of 29 October 2021. There is no guarantee that these views will come to pass. SeeAppendices for definitions, methodology and disclaimers. Source: BAML, MSCI, GSCI, FTSE, Refinitiv Datastream and InvescoNovember 20211
Global Market Strategy OfficeThe Big PictureTable of contentsSummary and conclusions: 2022 - a year of transition . 3Model asset allocation* . 5A glance in the rear-view mirror . 6Taking a step back: focusing on the next decade using Invesco’s CMAs . 7Politics in 2022: US politics back to centre stage . 8The global economic cycle: deceleration and inflation . 9From economic to market cycles . 11Projections for 2022 . 14Model Asset Allocation: towards more balance. 17Equity factors and sectors . 18What could go wrong? Five scenarios for 2022 . 19Appendices . 21Appendix 1: Global valuations vs history . 21Appendix 2: Asset class total returns. 22Appendix 3: Invesco 10-year Capital Market Assumptions (USD version) .23Appendix 4: Key assumptions . 24Appendix 5: Methodology for asset allocation, expected returns and optimal portfolios . 25Appendix 6: Definitions of data and benchmarks . 26Appendix 7: IIS Capital Market Assumptions methodology (Figure 5 & Appendix 3). 28Important information . 29November 20212
Global Market Strategy OfficeThe Big PictureWe still prefer cyclicalassets but are now lessaggressiveSummary and conclusions: 2022 - a year of transitionGiven our view that 2022 will be a year of transition and that asset class returns willconverge, we adopt a more balanced approach within our Model Asset Allocation,though still maintain a preference for cyclical assets. We reduce the equity allocation toNeutral and increase the allocation to bonds, by raising high-yield credit (to Maximum)and investment-grade credit (to just below Neutral), though we reduce governmentbonds to the Minimum allowed. From a regional perspective we have added to emergingmarket (EM) and Eurozone allocations, while reducing exposure to the US and Japan.Slowdowns oftenproduce convergence ofreturnsAfter deep recession and a strong rebound, we suspect the global economy is nowdecelerating towards a more normal rate of growth (perhaps 4% GDP growth in 2022).At the same time inflation has reached levels not seen for some time, though we expectit to peak in mid-2022 and to ease thereafter. Though we believe the current upswingwill last for a number of years, we note that this slowdown phase of the economic cycleis often accompanied by a convergence of asset class returns. Coming after a period ofstrong outperformance by cyclical assets, we think it is now time to adopt a morebalanced approach within our Model Asset Allocation (see Figure 3 for the details).Underlying assumptionsUnderpinning our asset projections for 2022 are the following assumptions: Central bank tapering starts and asset purchases cease in many countries Central banks start the process of normalising (increasing) their policy rates (weassume two rate hikes from the Fed and even more from the BOE) Government bond yields rise across the maturity spectrum but yield curves start toflatten towards the end of the forecast horizon (bear flattening) IG and HY spreads narrow slightly and default rates decline USD strengthens marginally as bond yield spreads move in its favour Equity dividend growth slows; yields remain stable (except for a slight rise in the US) Real estate (REIT) dividends rebound, pushing yields higher Commodities consolidate recent gains (and gold falls due to rising yields/dollar)10-year treasury yield torise to 2.20%The full set of assumptions is shown in Appendix 4, while the resultant market targetsare shown in Figure 20 and projected returns for global assets are shown in Figures 1and 22. Perhaps the most important forecast is that the 10-year US treasury yield willrise to 2.20% and that consequently the US dollar will strengthen slightly. This suggeststo us a re-emergence of some earlier trends (outperformance of value versus growth,weakness of gold and defensive fixed income assets). However, it also suggests thatcommodity prices may find it harder to advance from here (especially given that many ofthem are now expensive, in our view).Optimisation processfavours real estate, HYand cashNot surprisingly, given the information in Figure 1, our optimisation process favours cashand real estate and accords minimum allocations to government bonds, gold andcommodities (see Figure 21). Interestingly, high-yield credit (HY) is also favoured, whilethe results vary for equities and investment-grade credit (IG).Equities reduced andcredit boostedHence, within our Model Asset Allocation, we have chosen to reduce the equityallocation to a Neutral 45%, versus the previous Overweight 54% and have now reducedcommodities to zero (see Figure 3). Though we boost the overall allocation to fixedincome categories (yields are higher), we reduce the government bond allocation to theMinimum 10% (from 19%). These reductions allow us to boost the allocation to credit,with high-yield (HY) going to the Maximum 10% (from 2%) and investment-grade (IG)rising to 9% (versus the previous zero and just below the Neutral allocation of 10%).Real estate still ourfavourite cyclical assetReal estate remains our favourite cyclical asset. It may suffer a loss of demand foroffice and retail space as a result of Covid-19 but we find the yields to be attractive andexpect growth to resume as economies recover. We remain at the Maximum 16%allocation but have reduced the US and Japan while boosting EM and the Eurozone.We prefer cash to goldas a diversifierCash remains our defensive asset of choice (low returns, low volatility and lowcorrelation place it on the efficient frontier). Notwithstanding the rise in inflation, we thinkgold will struggle if treasury yields and the dollar rise, so we maintain a zero allocation.November 20213
Global Market Strategy OfficeThe Big PictureEM is our favouredregionOur preferred regions across all assets remain the UK and EM, while the US is thebiggest Underweight (based largely on valuations). Figure 3 shows EM are preferred inmost categories, partly due to value considerations, partly for cyclical reasons and partlybecause many EM central banks have already tightened to a significant degree, whereasdeveloped world counterparts are only just starting that process.We prefer the basicresources sector tocommoditiesWhen focusing on equities, we expect a convergence of returns across factors andbelieve that factor positioning will be less rewarding. Looking at sectors, we view basicresources as a more attractive way than commodities to gain exposure to the economiccycle and, among other cyclical sectors, we favour real estate and financial services.We view technology as a good alternative in the event that growth disappoints.What if we are wrong?There will be a number of important elections during 2022 (in the US and France, forexample) and geopolitical tensions could flare up (China vs US, Russia vs the West,developed vs developing world). However, when it comes to consideration of risks to ourcentral scenario, we focus on economic outcomes. Figure 2 shows a range ofpossibilities. We would normally focus on the “Boom” and “Recession” alternatives thatwe consider to be either side of the Phillips Curve continuum that runs through thecentral scenario. However, given current circumstances, we prefer to focus on the“Stagflation” and “Benign disinflation” scenarios that we consider to be supply shocks.Stagflation now morelikely than for some timeand difficult to mitigateWhen we talk of stagflation, we don’t expect anything as extreme as in the 1970s/80s butwe think it is more likely than for some time (given supply-chain disruptions and risingcosts). We find it difficult to identify assets that could mitigate against a scenario of highinflation and recession (the latter perhaps provoked by the former and/or the policyresponse to it). Our favoured assets would be inflation-linked bonds, gold and, withinequities, we would focus on gold miners and the low volatility factor. At the otherextreme, with low inflation, relaxed central banks and high growth, we would favourequities (consumer discretionary, growth, quality), real estate and HY.Figure 2 – Five scenarios for 2022 and our favoured assetsPercentages reflect our assigned probabilities. See appendices for definitions, methodology and disclaimers.Source: InvescoNovember 20214
Global Market Strategy OfficeThe Big PictureModel asset allocation*Figure 3 – Model asset allocation (21/11/2021)Cash EquivalentsCashGoldBondsGovernmentUSEurope ex-UK (Eurozone)UKJapanEmerging MarketsChina**Corporate IGUS DollarEuroSterlingJapanese YenEmerging MarketsChina**Corporate HYUS DollarEuroEquitiesUSEurope ex-UKUKJapanEmerging MarketsChina**Real EstateUSEurope ex-UKUKJapanEmerging MarketsCommoditiesEnergyIndustrial MetalsPrecious 2%2%1%2%1%2%1%0.3%0.3%0.3%100%Policy Range0-10%Currency Exposure (including effect of 10-40%0-20%0-10%25-65%0-16%0-4%Allocation Position vs Neutral10%10%0% 29% 10% 2% 2% 0% 3%3%0% 9% 2% 2% 1% 2% 2%0% 10% 8% 2% 45% 12% 10%8% 5%10%2%16% 2% 4%3% 3% 4% 0%0%0%0% 0%100% 31%22%13%14%19%100%*This is a theoretical portfolio and is for illustrative purposes only. It does not represent an actual portfolio and is not a recommendation of anyinvestment or trading strategy. **China is included in Emerging Markets allocations. Cash is an equally weighted mix of USD, EUR, GBP andJPY. Currency exposure calculations exclude cash. Arrows show direction of change in allocations. See appendices for definitions,methodology and disclaimers. Source: Invesco Global Market Strategy OfficeNovember 20215
Global Market Strategy OfficeThe Big Picture2021 was as expectedwith cyclical assetsoutperforming by a largemarginA glance in the rear-view mirrorA year ago, we suggested that cyclical assets would outperform during 2021 and that ispretty much what has happened (see Figure 4). After the winter surge in Covidinfections, the rollout of vaccines has allowed a reopening of many economies and thishas supported the divergence between cyclical and defensive assets.Industrial andagricultural commoditiesled the wayIn a reversal of what happened in 2020, commodities and real estate (REITs) havefeatured among the top-3 assets so far this year. However, it should be noted that withincommodities, the performance has been divergent. Appendix 2 shows that industrialcommodities (energy and industrial metals) and agriculture have generated sizeablepositive returns, while precious metals are in negative terrain (see the reversal of goldreturns from 2020 to 2021 in Figure 4).US assets excelled,while EM disappointedFrom a regional perspective, US assets were among the best performers, both equitylike assets and fixed income (partly because of dollar appreciation). Appendix 2 alsoshows that emerging market (EM) assets were among the worst performers, though theimpact of China varied. EM equities were dragged down by the very weak performanceof Chinese equities, while EM government bonds found support from the Chinesecomponent. Though the US dollar has appreciated during 2021, the Chinese Yuan(CNY) has been even stronger (see Appendix 2).The history shown in Figure 4 shows that after 2009 and 2012 (years of strong reboundin cyclical assets), there was further outperformance by cyclicals but not to the sameextent. 2019 was also a rebound year but what followed was distorted by the pandemic.The transition to slowergrowth could provokeconcernsWe suspect that the global economy will continue to grow over the coming years but notat the pace seen during 2021. This deceleration could be problematic, especially if itraises concern about recession. At the very least we believe it will be accompanied byless profit growth, which could dampen equity returns. Also impacting profits will be thehigher level of inflation that we are now experiencing and what we believe will be apattern among governments to raise business taxation.Whether central banksremain in control couldbe key during 2022This deceleration in economies and profits will come as developed world central banksstart the process of normalising their collective monetary stance, which we deem to beextremely loose. Whether they are able to tighten gradually or are forced into rapidadjustments could be an important determinant of asset class performance during 2022.Figure 4 – Total returns on global assets by calendar year (in .9%Gold3.1%HY62.0%REITS33.0%GoldGold29.3% 11.1%REITS Govt18.6% 6.8%20112012REITS Stocks27.3% 27.4%HYHY19.3% 8.0%20132014REITS Cash12.1% 0.2%Stocks ash2.0%Govt-0.3%Stocks Gold28.4% 24.8%REITS Stocks21.7% 7%Cash0.5%Govt6.5%CTY5.8%Cash1.1%REITSIG-5.4% 11.4%Stocks Govt-8.2%5.5%CTYCash-13.8% d-7.6%CTYHYHY-1.2% -0.1% -4.2%GovtGoldGold-4.3% -1.8% -10.4%GoldCTYCTY-27.3% -33.1% -32.9%Notes: Based on annual total return data from 2008 to 2021 in USD (2021 is created by annualising data up to 29 October). Calculated usingspot price of gold, BofAML 0-3-month US treasury index (Cash), BofAML Global Government Index (Govt), BofAML Global Corporate Index (IG),BofAML Global HY Index (HY), GPR General World Index (REITS), S&P GSCI total return index for commodities (CTY) and MSCI World Index(Stocks). Past performance is no guarantee of future results.Source: BofAML, GPR, JP Morgan, MSCI, S&P GSCI, Refinitiv Datastream and Invesco.November 20216
Global Market Strategy OfficeThe Big PictureInvesco’s 10-year CMAshave been publishedTaking a step back: focusing on the next decade using Invesco’s CMAsBefore considering projections for the next year, it may be instructive to use longer termreturn projections as a guide. Invesco Investment Solutions have just published their 10year capital market assumptions. Figure 5 shows their projected returns for global assetclasses in a range of currency bases (their framework differs from ours, so we have hadto adapt some of their categories – for instance, we use their US Treasury Shortcategory to represent cash and precious metals for gold). A more detailed versionshowing regional projections is contained in Appendix 3.Figure 5: Invesco 10-year capital market assumptions (global assets, % ann.)USDEURGBPCHFCash & Gold1.6-0.21.0-0.2Cash - US Treasury Short0.8-0.90.3-0.9Gold2.30.51.70.5Government Bonds2.20.51.60.5Corporate IG1.90.21.30.2Corporate HY - US HY3.11.42.51.4Equities7.25.46.65.4Real Estate (REITS)8.16.47.56.4Commodities4.93.24.33.2Note: Estimates as of 30 September 2021 and based on the 10-year capital market assumptions published byInvesco Investment Solutions in Long-Term Capital Market Assumptions (November 2021). The USD version ofthe CMAs is reproduced in Appendix 3. The above table uses the geometric expected return version for globalasset classes (“gold” is based on the projections for precious metals and the “Cash & Gold” category shows theaverage of those two assets). These estimates reflect the views of Invesco Investment Solutions, the views ofother investment teams at Invesco may differ from those presented here. There is no guarantee that theseviews will come to pass. Source: Invesco Investment SolutionsReal estate and equitiesdominate 10-year CMAbased optimal portfoliosNot surprisingly, the further we move along the risk spectrum, the higher the projectedreturns. There is one exception: commodities. The latter is the only cyclical asset classthat hardly features in the optimal solutions (see Figure 6). Though results vary bycurrency base and depend on what is maximised (Sharpe Ratio or returns), there aresome broad themes: real estate is maximised in all cases, while IG, HY and commoditiesare mainly zero allocated; equities are mainly Overweight, while government bondallocations are mixed. The combination of cash and gold is often either maximum orminimum allocated (but they are rarely present together). Let’s see how shortening thetime horizon and allowing for the cycle impacts the conclusions.Figure 6: Optimised global allocations based on Invesco’s 10-year CMA projected returnsNeutralPolicyMaximise Sharpe RatioMaximise ReturnPortfolioRange USD EUR GBP CHF USD EUR GBP5%0-10%Cash & .5%0-10%Gold0%3%3%10%0%3%0%25%10-40%Government Bonds40%16%30%11%34%30%10%10%0-20%Corporate IG0%0%0%0%0%0%0%5%0-10%Corporate %65%8%0-16%Real Estate %0%0%0%4%CHF10%0%10%23%0%0%51%16%0%Note: optimisations are based on the 10-year projected returns published by Invesco Investment Solutions in Long-Term Capital MarketAssumptions (November 2021), as shown in Figure 6 above. Optimisations are performed by the Asset Allocation Research team using ourhistorical 10-year covariance matrices (for each currency). “Gold” is based on the projections for precious metals and the “Cash & Gold” categoryshows the sum of allocations for those two assets). “Maximise Sharpe Ratio” optimisations are performed by maximising the Sharpe Ratio subjectnot violating the constraints implied by the policy ranges shown in the table. “Maximise Return” optimisations are performed by maximising returnsubject to the policy range constraints but also subject to the standard deviation of returns not exceeding that of the Neutral Portfolio (as shown inFigure 3). Though based on the projected returns provided by Invesco Investment Solutions, these optimal allocations do not represent theirviews, nor those of any other investment team at Invesco. See appendices for definitions, methodology and disclaimers.Source: Invesco Investment Solutions, InvescoNovember 20217
Global Market Strategy OfficeThe Big PictureCalm after the stormPolitics in 2022: US politics back to centre stage2021 has been a year of relative political calm after the high drama in the US during2020. Though other factors are at play, we think this lack of “excitement” has contributedto the decline in the price of gold during this year (our gold model is shown in Figure 7).Figure 7 – Gold versus model predicted values (USD per ounce)Monthly data from January 2003 to October 2021 (as of 29 October 2021). Gold is modelled as a function of real10-year US Treasury yield, 10-year US inflation breakeven and trade-weighted USD. “Pre-2007 Model” is basedon data from 31 January 1997 to 31 December 2006. “Post-2007 Model” is based on data from 31 January 2007to 30 April 2020. “President dummy” is a dummy variable that was set at zero prior to November 2016 (whenPresident Trump was elected) and one thereafter. There is no guarantee that these views will come to pass.Source: Refinitiv Datastream and InvescoAll change on CapitolHill?As you were in FranceHowever, the peace may be short-lived, with US mid-term elections due on 8 November2022. Things are not looking good for the Democrats, with approval ratings for PresidentBiden weaker than for all post-war presidents at the same stage of their presidencies,except for Donald Trump and Gerald Ford (according to an analysis by FiveThirtyEight).On this basis, we reckon there is a good chance of seeing the usual mid-term swingagainst the party of the incumbent, which could confront the president with a hostileCongress for the final two years of his term. This could also strengthen the hand ofDonald Trump were he to contest the result of the 2024 presidential election (assuminghe runs and loses). US politics could become a destabilising force once again.A selection of other 2022 elections is shown in Figure 8, with those of Australia andBrazil perhaps the most important for those hoping for a new approach towards climatechange. We suspect the most followed election will be that that for the president ofFrance. Despite perennial concerns about a far-right victory, opinion polls suggestPresident Macron will win the first round and that he will be victorious against whoeverconfronts him in the second round (especially if it is Marine Le Pen).Figure 8: Selected elections and political events during 202209/03/2022South KoreaPresidential election27/03/2022Hong KongChief Executive election27/03/2022LebanonGeneral election27/04/2022FrancePresidential election (first round 10/04/22)April 2022HungaryParliamentary election09/05/2022PhilippinesGeneral electionJune 2022FranceLegislative election09/08/2022KenyaGeneral election03/09/2022AustraliaHouse of Representatives election11/09/2022SwedenGeneral election02/10/2022BrazilGeneral election08/11/2022United States Mid-term congressional electionSource: International Foundation for Electoral Systems, Wikipedia, InvescoNovember 20218
Global Market Strategy OfficeThe Big PictureA decelerating globaleconomyThe global economic cycle: deceleration and inflationAfter a sharp global recession in early 2020, came an equally impressive rebound laterthat year and into early 2021. The pace of that rebound could never be maintained andwe are now going through a phase of deceleration (for example, annualised quarterlygrowth rates in US GDP so far this year have been 6.3%, 6.7% and 2.0%). Figure 9shows how this has translated into global trade flows.Figure 9 – Global exports (% y-o-y, measured in SDRs)Note: the chart shows year-on-year growth in the aggregate of exports measured in SDRs (IMF SpecialDrawing Rights) across a range of major economies (Australia, Brazil, Canada, China, Eurozone, India, Japan,Mexico, Russia, South Korea, Sweden, Switzerland, Taiwan, UK and US) . “Total” is the aggregate across allcountries. “Sub-total” is measured over the subset of countries for which the latest month of data (September2021) is available, with the historical data based only on those countries. Monthly data from January 2000 toSeptember 2021. Source: Datastream and Invesco.But not recessionRather than indicating a new slump in the world economy, we suspect this decelerationis indicative of a transition to more normal rates of growth. In support of this hypothesiswe cite a number of factors: first, some of that earlier growth came from one-off fiscalsupport and was always going to wane (especially in the US); second, supply-chainissues are causing shortages in some key products, while consumer spending isbroadening from products to “experiences”; third, personal savings rates remainhistorically high (7.5% in the US in September, for example, which is towards the upperend of the range seen during the two decades prior to the pandemic) and, finally, centralbanks remain extremely supportive of their economies, though now tightening.While we have experienced extreme conditions, Figure 10 shows that the G7 economyfinds itself in a similar position to that seen during previous upswings. Those precedentssuggest we can look forward to a number of years of further expansion.Figure 10 – G7 GDP upswings (% change from previous peak)Note: quarterly data, with quarter zero being the peak of the previous cycle. As of 14 November 2021.Source: Refinitiv Datastream and Invesco.November 20219
Global Market Strategy OfficeThe Big PictureInflation on the riseAs is normal during economic upswings, growth has been followed by inflation. Whetherthis is demand or supply led is hard to know and we suspect it is a bit of both (it is a bitlike asking which scissor blade cuts the paper). Monetary growth picked up dramaticallyduring the early stages of the pandemic, nowhere more so than in the US (see Figure11). Assuming that excess monetary growth eventually impacts prices, this couldexplain the pick-up in inflation and suggests there is more to come (given that US M2growth peaked in February 2021 and that we usually reckon on a two-year lag to prices).Figure 11 – US money supply, bank credit and core inflation (% yoy)Based on monthly data from January 1960 to October 2021. Bank credit consists of loans and leases providedby commercial banks. The shaded area is from January 1965 to January 1980.Source: Refinitiv Datastream and InvescoBut we think it will betransitoryHowever, Figure 11 also suggests the relationship between US money supply growthand future inflation is not what it was. Further, after an acceleration of bank lending inthe early stages of the pandemic (emergency borrowing perhaps), subsequent strongmoney supply growth has not been associated with bank lending growth (bank lendingbottomed in January 2021 and growth has since been negligible). This, and the fact thatmoney supply growth has halved, suggests that any inflationary impulse stemming fromexcess US monetary growth will be limited and temporary in nature.On both sides of theAtlanticFigure 12 shows that UK input price inflation is about as high as it has been in recentdecades, which is not surprising given the rise in raw material and shipping costs. Thatcould suggest consumer price inflation will rise further (the Bank of England now expectsCPI inflation to reach 5% in April 2022). However, to the extent that input cost inflationhas been due to supply bottlenecks, we suspect PPI Input inflation will roll ove
Model asset allocation* Figure 3 - Model asset allocation (21/11/2021) *This is a theoretical portfolio and is for illustrative purposes only. It does not represent an actual portfolio and is not a recommendation of any investment or trading strategy. **China is included in Emerging Markets allocations.