Transcription
Health inequalities and women –addressing unmet needsDr Jessica AllenDeputy director, UCL Institute of Health EquityDr Flavia SestiCivil servant, Italian National Institute for Health, Migration and Poverty (NIHMP)British Medical Associationbma.org.uk
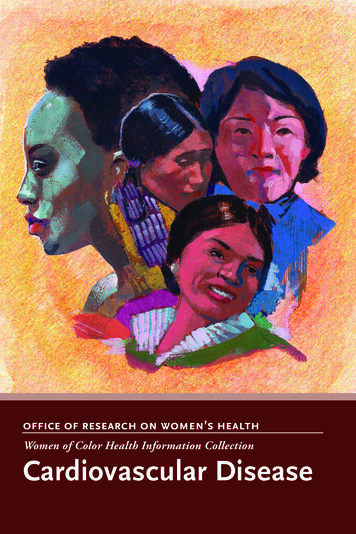
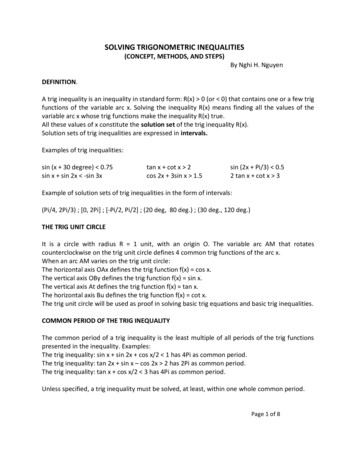
British Medical AssociationHealth inequalities and women – addressing unmet needsHealth inequalities and women –addressing unmet needsDr Jessica Allen, Deputy director, UCL Institute of Health EquityDr Flavia Sesti, Civil servant, Italian National Institute for Health, Migration and Poverty(NIHMP)Key messages:–– T here are clear and stark inequalities in health between women, which are relatedto socio-economic status, ethnicity and geographic region.–– Across different stages of women’s lives there are different social and economicfactors which drive health and associated health inequalities; including experiencesduring early childhood, education, family building and working life and throughretirement and into older age.–– The broad health workforce must take full account of the social and economicfactors which shape women’s lives and health at different stages of life.IntroductionThere are marked and persistent health inequalities across the United Kingdom (UK) inboth length of life and in length of healthy life, for both men and women. These inequalitiesare closely related to socio-economic position.1 Figures 1 and 2 show life expectancy anddisability free life expectancy related to level of neighbourhood deprivation. Each dot onthe graphs is a neighbourhood in England. It is clear that inequalities in life expectancy andhealthy life expectancy impact on everyone below the highest socio-economic status, notjust the most deprived. The social gradient in health is shown for men in figure 1 and womenin figure 2, both of which clearly show gradients in disability free life expectancy and lifeexpectancy related to levels of deprivation in neighbourhoods.Figure 1. Life expectancy and disability free life expectancy, males, based on 2011 Census1
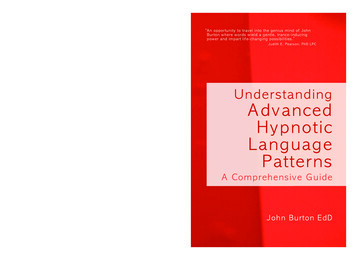
2British Medical AssociationHealth inequalities and women – addressing unmet needsFigure 2. Life expectancy and disability free life expectancy, females, based on the2011 CensusThere have been several major global reviews of evidence,2,3 which describe closerelationships between social, economic, environmental, cultural and political factors andhealth outcomes – known as the social determinants of health. There is now widespreadand increasing recognition that most inequalities in health are caused by inequalities in theconditions in which people are born, grow, live, work and age.Local authority data show that for both men and women there are inequalities in healthwithin, as well as, between local authorities4 As Figure 3 shows, between local authoritiesthere is a female life expectancy difference of seven years ranging from 79 years inManchester to 86 in Kensington and Chelsea.Figure 3. Female life expectancy at birth and healthy life expectancy by local authority,2013-2015
British Medical AssociationHealth inequalities and women – addressing unmet needsMoreover, within local authorities there is a significant inequality in life expectancy forwomen, based on level of neighbourhood deprivation. This ranges from less than two yearsin Islington to 12 years or more in Stockton on Tees and Middlesbrough.European countries are experiencing an ageing population, and the UK has seen dramaticincreases in life expectancy, with a longer life expectancy for both men and women.However, the trend now seems to be changing, raising new challenges in terms of policiesand healthcare with life expectancy in England stalling and declining for women in someareas.5 To improve health and tackle health inequities effectively and at the necessary scale,the role of policy makers, health professionals and practitioners in other sectors (education,early years, work for instance) is fundamental.A discussion of the evidenceAt European level, even though life expectancy is increasing, it has registered a slowdown inthe rate of increase in all countries since the global financial crisis, with the United Kingdomshowing one of the worst trends. Compared to other countries, in the United Kingdom theincrease in life expectancy from 2011 to 2015 was the slowest in Europe. For women therewas no increase – the lowest in Europe – and there was second slowest increase amongmen (0.08%).6 As shown in Figure 4 this trend is confirmed by the recent Marmot indicatorsin England, which show that the improvements in life expectancy at birth have slowed.7 Inparticular, looking at the period 2000-2015 the trend for women is worse than that of men:female life expectancy increased by one year every five years, while for men the increase wasone year every three and a half years.Taking the period since 2010, the trend for women shows further deterioration: lifeexpectancy at birth for women rose one year every 10 years while for men the figure wasone year every six years. For female life expectancy at age 65 in England, life expectancyincreased one year every six years, compared to one year every five years for men in theperiod 2000-2015. Moreover, from 2010 to 2015 life expectancy at age 65 slowed to a oneyear increase every 16 years for women and every nine years for men.8Figure 4. Life expectancy at birth, England, 2009-20153
4British Medical AssociationHealth inequalities and women – addressing unmet needsLeaving aside specific biological factors, such as reproduction, men and women also tendto have differing experiences of social determinants across life shaped partly by genderroles – the socially constructed characteristics of women and men, such as the norms andrelationships which exist between them.Considering the average age of death: three-quarters of female deaths are at age 75 andover, with two-thirds of these occurring at ages 85 and over. In contrast, for men three-fifthsof deaths are at ages 75 and over, half of which are at ages 85 and over.9 For disability-free lifeexpectancy (DFLE) which estimates the average number of years an individual is expectedto spend free from a limiting long-term illness or disability, in England from 2012 to 2014females at birth could expect to spend a lesser proportion (76.0%) of their lives free fromdisability compared with males (79.5%).10 Moreover, the inequalities in DFLE across upper tierlocal authorities is wider for females (19.4 years) than males (16.8 years).The leading cause of death for women aged 80 and over is dementia and Alzheimer disease(37,252 deaths) and for men aged 85 and over (12,248 deaths). Since 2002 the rates ofdementia and Alzheimer among women aged 85 and over have been rising. In particular,from 2002 to 2015 there was an increase of around 175% in dementia as the cause of deathin women aged 85, as shown in Figure 5.11Figure 5. Deaths due to dementia, females by single years of age, England and Wales,2002-2015For both men and women, lower socioeconomic groups have a higher incidence of poormental health and are more likely to have earlier onset of dementia compared to the highersocioeconomic groups. Women represent two thirds of all people with dementia, with higherdementia prevalence rates than men (62.7% for males and 71.2% for females).12 Women aremore likely than men to experience the death of their partner, move into residential care andexperience physical ill health and poor mental health and cognitive decline. Depression canbe a risk indicator for converting cognitive impairment to dementia and women have higherrates of depression than men.13Evidence suggests that women with dementia have fewer visits to the GP, receive lesshealth monitoring and take more potentially harmful medication than men with dementia.Furthermore, women were found to be at particular risk of staying on antipsychotic orsedative medication for longer, probably due to the lower number of appointments wheretheir treatment can be reviewed.14
British Medical AssociationHealth inequalities and women – addressing unmet needsA study of socioeconomic position as a risk factor for death due to dementia showed thatin women there is an association between leaving full-time education at a younger age anddementia-related death, which is not evident in men.15Research found a positive association between poverty measures and common mentaldisorders.16,17 For example, in England, Wales, and Scotland it has been shown that someforms of mental disorder are correlated with levels of debt the individual has.18 As shown inFigure 6, in women the pattern of social distribution of common mental disorders follows thesocial class gradient more markedly than men.19 Women have a higher percentage of mentaldisorders than men in each income bracket reported.Figure 6. Prevalence of any common mental disorder by household income,England 2007(Re-used with the permission of the Health and Social Care Information Centre. All rightsreserved)Additionally, there are wider factors that may influence gender differences in health in olderage: women live longer than men and with more limiting illnesses which affects their abilityto continue in employment, and women have higher rates of poverty in old age than malepensioners. Single retired women have higher risk of poverty than married retired women.20Women have on average only 57% of men’s income with fewer women (60%) havingpensions compared to men (80%).21 Moreover, a 2016 study found that, at age60–64 a third of women, compared with half of men, continued to work part-time afterthe state retirement age and the employment rates further declined with age, with agap between men and women, for whom just 5% continued to work between the agesof 70 and 74 compared with 10% of men at the same age.22There are also clear inequalities in health between migrant women and the host population.Migrants are 13.3% of the UK population and they contributed to more than half of theincrease in the UK population between 1991 and 2014,23 being younger24 and with a higherfertility rate than native British.25An analysis of migrant health for people aged 60 years and more reveals that there are nosignificant differences among UK and non-UK born men. In contrast, non-UK-born olderwomen, who have spent between 10 and 39 years in the UK, have 71% higher odds thanUK-born women of reporting that health is limiting their typical activities.26As shown in Table 1, non-UK-born women have a slightly higher rate of maternal mortality(MM rate of 8.8) than UK born (7.87) women, the figure is even worse when analysing thespecific country of origin. In this case, women born in certain countries have a significantlyhigher risk of death compared to UK-born women. For Jamaicans, for example, the relativerisk (RR) compared with UK-born women (RR 1) is 6.36 and for Nigerians or Pakistanis therelative risk is respectively 2.25 and 2.24. Looking at the same phenomenon in terms of UKborn ethnic minority groups, Black and Asian groups’ RR is 4.19 and 1.36 compared withWhites (RR 1).275
6British Medical AssociationHealth inequalities and women – addressing unmet needsTable 1. Maternal mortality rates according to mother’s country of birth (selected countries)WOMAN’SCOUNTRY OFBIRTHRATE PER100,000MATERNITIES95% CIRELATIVERISK (RR)95% CIUK7.876.62 to 9.301 (Ref)Outside UK8.856.59 to 11.641.120.80 to 1.56SPECIFIC COUNTRIESBangladesh12.52.57 to 36.51.580.32 to 4.73Pakistan17.68.44 to 32.42.241.05 to 4.24Jamaica50.010.3 to 146.26.361.29 to 18.9Nigeria17.74.83 to 45.42.250.60 to 5.89Poland5.781.57 to 14.80.730.20 to 1.92A quarter of women who died during maternity in 2012–14 were born outside the UK and46% of these women were not UK citizens. More particularly, the women who died hadarrived in the UK on average 4 years previously, with 65% from Asia (mostly Pakistan,Sri Lanka and Bangladesh) and Africa (mostly Nigeria, Somalia and Democratic Republic ofCongo), about 14% from Eastern Europe (mainly from Poland) and the remainder from otherparts of Europe, North America and the Caribbean.28 There has been no change in this ratebetween 2009–2011, suggesting that there was no significant or successful effort to narrowthe striking differences in maternal mortality risks for migrant women.There are also inequalities in health for women related to ethnicity in England and Waleswhere women of over half of the ethnic minorities for whom data is available (9/16) havelower DFLE at birth than White British (64.1 years), particularly among Black, Asian and mixedethnic groups. Pakistani women registered the lowest DFLE (55.1 years) while Indian women,whose LE was similar to that of White British women, had in contrast 4.3 fewer disability-freeyears.29A recent Scottish study showed that the life expectancy of White females was 79.4,overlapping with Mixed Background (79.3) but shorter than some specific ethnic groups,such as Pakistani (84.6), Chinese (83.4), Indian (83.3), Other White British (82.6), Other White(82.0) and White Irish (81.0). 30To summarise, there are clear inequalities in health related to gender – as well as to socioeconomic status and ethnicity – and these factors are all interlinked. Poorer, migrant womensuffer the worst health of all and there are differences in health outcomes between ethnicgroups for women. For all these groups poorer women have relatively low health outcomes.Actions requiredThere are clear, systematic differences in health between genders and there are clear andstark inequalities in health between women in different socio-economic groups, ethnicitiesand geographic regions. There are important actions which can be taken by policymakers nationally and locally and by those within the health system to help reduce thoseinequalities.Policy makers can help reduce health inequities, maintaining and improving universal healthand welfare systems. A proportionate universal approach to policy interventions and welfareshould be central to the development of policies and approaches. A proportionate universalapproach includes everyone – the universal element, with actions on a scale and at anintensity that is proportionate to need. This means addressing women’s health with specificactions to take into account women’s different needs at different stages of life and for thosewith different levels of risk.
British Medical AssociationHealth inequalities and women – addressing unmet needsThe Marmot Review31 presented the following six policy objectives with specific policyrecommendations that could be implemented at national and local level:–– Give every child the best start in life–– Enable all children, young people and adults to maximise their capabilities and havecontrol over their lives–– Create fair employment and good work for all–– Ensure a healthy standard of living for all–– Create and develop healthy and sustainable places and communities–– Strengthen the role and impact of ill-health preventionAt national and local levels policy makers must be committed to creating conditions in whichindividuals, communities and the public take control of their own lives.The life-course approach shows that there is an accumulation of positive and negativeeffects on health and well-being, among all phases of life (prenatal, pre-school, school,training, employment and retirement). Consequently, equity policies must follow the lifecourse perspective in order to address the inequalities between women and betweenwomen and men which are appropriate to each stage and aim to prevent an accumulation ofinequities over the life course.Case study: MAMTAA good example of actions tackling health inequities between women in Englandis the recent experience of Coventry as a Marmot city. To address the first andthe sixth Marmot review recommendations during the first Marmot city phase2013-2015, Coventry implemented the MAMTA (‘motherly love’ in Hindi) peer modelto improve Child and Maternal Health outcomes and ill-health prevention for BME(Black and Minority Ethnic) women. The MAMTA model existed before the Marmotcity interventions, and was initiated in 2001.32 It was adapted to the Marmot Cityobjectives, focusing on peer workers’ support for women in the community.In particular, for child and maternal health care the Foleshill Women’s Training(FWT) staff supported antenatal clinics; postnatal clinics; parent craft sessions atFWT centre; and work in partnership with midwives, health visiting teams and otherhealth professionals, educating women on key health messages. The project wasimplemented across community settings in specific areas to educate women on childand maternal health, and encourage women to access services and book early intomaternity services.Addressing the sixth Marmot review recommendation, FWT provided culturallyoriented education and support regarding cervical screening in migrant women by theMAMTA model. In particular, migrant women supported other women and explainedthe importance of the exam and booking the test, using communication material indifferent languages.33As the data shows, life expectancy in women is no longer increasing and in some parts of thecountry is actually decreasing. Women also have a higher probability of living in disabilitythan men and women with lower socio-economic status are likely to spend longer living witha disability than women with higher economic status, as well as dying earlier.The greater risk of dementia in women, particularly poorer women, requires particularfocus including strategies throughout life, such as ‘improved workplace health in midlife; supporting social interactions and lifelong learning and stimulation in later life; andsupportive care from services and from carers/families’34 and appropriate strategies toreduce poverty for women in later life.7
8British Medical AssociationHealth inequalities and women – addressing unmet needsAlthough much of the required action lies outside health care, health professionals play akey, if so far, underdeveloped, role in reducing health inequalities between women and menand between women. The following approaches should be adopted to strengthen healthprofessionals’ roles in tackling health inequalities:35,36–– Improving education and training. Undergraduate and postgraduate education couldinclude social determinants of health as a mandatory topic and could provide specificpractice-based skills such as communication, partnership and advocacy. Studentplacements in a range of health and non-health organisations could be included in thecourse.–– Building evidence though international, national and locally disaggregated (by sex, socioeconomic status and ethnicity) data to design appropriate services.–– Working with and for individuals and communities by building relationships of trust andrespect with patients, effective and appropriate social prescribing and creating networksin neighbourhoods.–– Enhancing healthcare organisations by means of equitable recruitment and good qualityemployment.–– Working in partnership and as advocates, by promoting partnerships inside and outsidehealth services (local organizations, cross governmental sectors) and at the same timeworking as advocates for health improvement, rather than just health care at all levels –from local to international level.
British Medical AssociationHealth inequalities and women – addressing unmet 2324Marmot M, “Social justice, epidemiology and health inequalities” Eur J Epidemiol, vol. 32,p. 537–546, 2017.WHO Commission on Social Determinants of Health, “Closing the gap in a generation:Health equity through action on the social determinants of health,” World HealthOrganization, Geneva, 2008.UCL Institute of Health Equity, “Review of social determinants and the health divide in theWHO European Region: final report,” WHO Regional Office for Europe, Copenhagen, 2013.UCL Institute of Health Equity, “Marmot Indicators 2017” London, 2017. f-health-equity-briefingIbidUCL Institute of Health Equity, “Analysis of Eurostat Life Expectancy Data” London, 2017.UCL Institute of Health Equity, “Marmot Indicators 2017” London, ute-of-health-equity-briefingIbidIbidOffice for National Statistics, “Disability-Free Life Expectancy by Upper Tier LocalAuthority: England 2012 to 2014” 2016. [Online]. Available: alauthority/england2012to2014.UCL Institute of Health Equity, “Marmot Indicators 2017” London, ute-of-health-equity-briefingPrince M, Knapp M, Guerchet M, McCrone P, Prina M, Comas-Herrera A, Wittenberg R,Adelaja B, Hu B, King D, Rehill A and Salimkumar D, “Dementia UK: Update” Alzheimer’sSociety, 2014.UCL Institute of Health Equity, “Inequalities in mental health, cognitive impairment anddementia among older people” London, 2016.Cooper C, Lodwick R, Walters K, Raine R, Manthorpe J, Iliffe S, Petersen I, “Inequalities inreceipt of mental and physical healthcare in people with dementia in the UK” Age andageing , vol. 46, no. 3, p. 393–400, 2017.Russ TC, Stamatakis E, Hamer M, Starr JM, Kivimäki M, Batty GD, “Socioeconomic status asa risk factor for dementia death: individual participant meta-analysis of 86 508 men andwomen from the UK” Br J Psychiatry, vol. 203, no. 1, pp. 10-17, 2013.World Health Organization, “Social determinants of mental health” World HealthOrganization, 2014.Lund C, Breen A, Flisher AJ, Kakuma R, Corrigall J, Joska JA, Swartz L, Patel V, “Poverty andcommon mental disorders in low and middle income countries: A systematic review” SocSci Med. , vol. 71, no. 3, pp. 517-28, 2010.Jenkins R, Bhugra D, Bebbington P, Brugha T, Farrell M, Coid J, Fryers T, Weich S, SingletonN, Meltzer H., “Debt, income and mental disorder in the general population” PsycholMed., vol. 38, no. 10, pp. 1485-93, 2008.Mc Namus S, Meltzer H, Brugha T, Bebbington P, Jenkins R, “Adult psychiatirc morbidity inEngland, 2007” Leeds: The NHS Information Centre for health and social care, 2007.The Poverty Site, “Older people in low income” [Online]. Available: ncome---final---e.pdfOffice of the Deputy Prime Minister, “A Sure Start to Later Life - Ending Inequalities forOlder People” London, 2006.UCL Institute of Health Equity, “Inequalities in mental health, cognitive impairment anddementia among older people” London, 2016.The Migration Observatory at the University of Oxford, “The Impact of Migration on UKPopulation Growth,” Oxford, 2016.Dustmann C, Frattini T, “The fiscal effects of immigration to the UK,” The EconomicJournal, 2014.9
10British Medical Association252627282930313233343536Health inequalities and women – addressing unmet needsOffice for National Statistics, “Childbearing of UK and non-UK born women living in theUK, 2011 Census data, 2011. [Online]. Available: ng-in-the-uk/2011-census-data/index.html.Evandrou M, Falkingham J, Feng Z, Vlachantoni A, “Ethnic inequalities in limiting healthand self-reported health in later life revisited,” J Epidemiol Community Health, 2016.Knight M, Nair M, Tuffnell D, Kenyon S, Shakespeare J, Brocklehurst P, Kurinczuk JJ,“Saving Lives, Improving Mothers’ Care. Surveillance of maternal deaths in the UK 2012–14 and lessons learned to inform maternity care from the UK and Ireland ConfidentialEnquiries into Maternal Deaths and Morbidity 2009–14,” National Perinatal EpidemiologyUnit, University of Oxford, Oxford, 2016.IbidWohland P, Rees P, Nazroo J, Jagger C, “Inequalities in healthy life expectancy betweenethnic groups in England and Wales in 2001,” Ethn Health, vol. 20, no. 4, p. 341–353, 2015.Gruer L, Cezard G, Clark E, Douglas A, Steiner M, Millard A, Buchanan D, Katikireddi SV,Sheikh A, Bhopal R, “Life expectancy of different ethnic groups using death recordslinked to population census data for 4.62 million people in Scotland,” J EpidemiolCommunity Health, 2016.UCL Institute of Health Equity, “Fair Society, Healthy Lives. Marmot Review,” London, 2010.The FWT website, “MAMTA – A Child and Maternal Health Programme” [Online]. Available:http://www.fwt.org.uk/MAMTACoventry City Council, Making a difference in tough times, Coventry, 2015.Public Health England and UK Health Forum, “The Blackfriars Consensus Statement” 2014.UCL Institute of Health Equity, “Doctors for health equity” World Medical Association, 2016.UCL Institute of Health Equity, “Working for Health Equity: The Role of HealthProfessionals” 2013.
BMABritish Medical Association, BMA House,Tavistock Square, London WC1H 9JPbma.org.uk British Medical Association, 2018BMA 20180500
age: women live longer than men and with more limiting illnesses which affects their ability to continue in employment, and women have higher rates of poverty in old age than male pensioners. Single retired women have higher risk of poverty than married retired women.20 Women have on avera