Transcription
Improving Onboarding withEmployee Experience JourneyMapping: A Fresh Take on aTraditional UX TechniqueHannah McKelvey and Jacqueline L. FrankMONTANA STATE UNIVERSITY LIBRARYVolume 1, Issue 9, 2018DOI: ermissionsAbstractWe present a creative method for applying the UX technique of journeymapping to improve the onboarding experience of new employees in anyorganization. Journey mapping is a well-known design research tool used togain insight into how a user experiences a service, process, or product, withthe goal of making informed improvements to deliver a better experience forfuture users. We argue that journey mapping can also be used to improve theinternal process of onboarding new employees and improve the experiencefor future new hires, which is important because positive onboardingexperiences are linked to increased productivity and greater employeeretention. We share how other organizations can use journey mapping toimprove the onboarding process utilizing our employee experience journeymapping project toolkit (Frank & McKelvey, 2017) designed to help guidesimilar projects, complete with shareable templates. In addition, we share themethods used at our library, as well as our findings, recommendations, andlessons learned.This paper was refereed by Weave's peer reviewers.
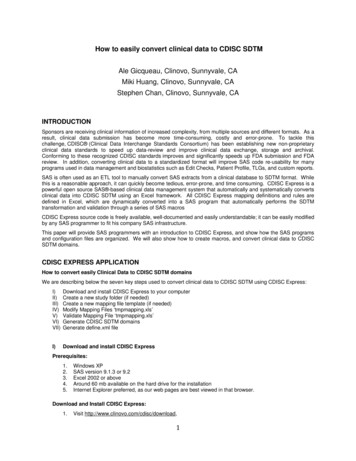
Improving Onboarding with Employee ExperienceJourney MappingA number of libraries use methods to better understand user experience, andmake decisions based on that insight to guide their futures. Journey mappingis one such method that can be used to document and communicate a user’sexperience of a product, service, or process from beginning to end, bycomparing an expected journey to the actual journey experienced by theuser. Kaplan (2016) defines it as “a visualization of the process that a persongoes through in order to accomplish a goal. It’s used for understanding andaddressing customer needs and pain points.” Journey maps usually havethree parts; the first section is “a lens that provides focus and context for thejourney being mapped, [the second is] an area depicting the user’sexperience, and a third zone [is] for insights derived from analyzing thejourney” (Williamson, 2016). Journey mapping allows organizations togather information that will help them better understand “the frustrations andexperiences of [their] customers” (Boag, 2015). Once the user’s feelingsregarding their interaction with a product or service has been captured(Schmidt & Etches, 2014, p. 1), pain points and happy moments areorganized into a visual journey map (Williamson, 2016). Visualizing a user’sfeelings allows frustrations to be identified and addressed by creatingsolutions that will accommodate the preferences of many users (Marquez,Downey & Clement, 2015). Happy moments or positive experiences canalso be identified and amplified with the goal of improving the experiencefor future users. See an example of a journey map below (fig. 1).
Figure 1. Example of a traditional journey map of a chat referencetransaction (Samson, Granath, & Alger, 2017); this work is licensed under aCreative Commons Attribution 4.0 International License.Journey mapping has been used in libraries to understand how students,faculty, and staff use library services with the intent of improving the overallexperience of the user. One journey mapping pilot study conducted by alibrary with first through third year college students, resulted in an increasein usage of their chat platform (Samson, Granath, & Alger, 2017). Journeymapping also helps libraries to create consistent experiences for their users.In a study conducted by the Birmingham City University Library, journeymapping improved the experience of first year students by “provid[ing] afresh perspective, increas[ing] librarians’ understanding of the studentexperience when using library services. [and] gave ideas for larger changesfor future services developments” (Fichter & Wisniewski, 2015). Otherorganizations have utilized journey mapping in similar ways. A study inIreland focused on how journey mapping can be used to improve the patientexperience within the healthcare system by using a human-centric designtool to better understand how patients navigate such a complex system(McCarthy et al., 2016). Additionally, large companies such as Amazon andGoogle, now have customer experience officers on staff, and compare theimportance of understanding the customer experience to journey mapping(Lemon & Verhoef, 2016).
While the most common type of journey mapping focuses on externalcustomers, there is also a less common application of the technique thatDesigningCX (n.d.) refers to as employee experience journey mapping.DesigningCX (2015) defines this as “a people-centric discovery process”that considers the employee, rather than the customer, as the user in anorganization. They describe journey mapping as a way to quickly determinechallenges employees are facing, and offer solutions in innovative ways toeliminate, fix, or help solve those challenges, with the goal of improvingperformance and engagement of employees. One such application is teasingout individual organizational onboarding experiences and improving thatexperience for new employees. Journey mapping is a helpful design researchtool to determine satisfaction of a user, changes in their needs, and otherdetails in each phase of their experience (Howard, 2014). Therefore, journeymapping can be an effective method of assessing an onboarding programfrom the perspective of the new employee. It can help libraries gain valuableinsight into the experience of new hires in the organization, with the goal ofimproving the onboarding process to boost productivity and retention.Improving the onboarding experience of new employees is important for thewellbeing of any organization. Research shows that onboarding programsthat are viewed positively by employees lead to increased retention,increased employee satisfaction and engagement, and a reduction in the timeit takes new employees to become productive in the organization (Hall-Ellis,2014; Snell, 2006). Snell (2006) suggests that organizations lacking acomprehensive onboarding process risk losing productivity and the interestof their employees. An engaged workforce leads to better services forpatrons, and can also lead to a more positive work environment for both staffand library patrons alike. It can also help generate positive perceptions of thelibrary within the community.We improved onboarding at our own institution by deploying employeeexperience journey mapping and focusing the lens inward on the Learningand Research Services department at Montana State University Library andits internal onboarding practices. Using employee experience journeymapping, we gained a clear understanding of existing assumptions and thecurrent onboarding culture at MSU Library, which we found to be sporadicand inconsistent. We identified key challenges and areas of improvement,including lack of documentation, outdated procedures, and inconsistency in
the way new employees were oriented to their job. Once we identified thechallenges, we were able to implement solutions to improve the onboardingfor future employees.Project OverviewIn April 2016, two new hires began their employment in the Learning andResearch Services department at MSU Library, presenting an opportunity tolearn from new employees and improve our onboarding processes. Wesuspected our onboarding process could be improved if we just understoodour current situation a little better. Utilizing journey mapping as a tool, wecaptured the experience of both new employees over the course of sixmonths, gathering data we then turned into journey maps. We then used thatdata to make significant improvements to our new employee onboardingprocess. As Graybill et al. (2013) writes, “by evaluating and makingadjustments to both individual performance and the onboarding processitself, organizations can continually improve getting new employees up tospeed, retention rates, job satisfaction levels, and performance results” (p.203).At a high level, the project goals were to learn about the current onboardingexperience, learn about journey mapping as a design research tool forgathering information, and to identify improvement opportunities withinMSU Library. The goal of using journey mapping as a specific tool was tohighlight those areas of improvement that would enhance employeeonboarding experiences from the user perspective, and challengeassumptions about overall hiring practices. Feedback from participants aboutthe project was also solicited and is discussed in a later section.In addition to these project goals, an unexpected outcome was the creation ofan employee experience journey mapping project toolkit (Frank &McKelvey, 2017). We did not have a toolkit for our project and felt it wouldhave been helpful, so we created the toolkit to help guide other organizationsthrough their own journey mapping projects. The project toolkit containsnecessary documents needed to recreate this project, or variations of it,designed to help improve onboarding at other organizations using journey
mapping as a tool. We encourage others to borrow and adapt what we havedone for their own use.The toolkit contains:Table of Contents – Includes links to each section with editable filesexplained in more detail below, along with a link to a full PDF versionof the toolkit.Project Introduction and Outline – This explains the project in moredetail and includes brief information about journey mapping, anoverview of the project and goals, and a summary of the projecttimeline. Use this to help introduce the project to the new employee(s).Timeline and Scheduling Tracker – Use this to help stay on track whileconducting this project. There are a lot of meetings that occur betweenthe project facilitator(s) and new employee(s) and tasks that should becompleted in between meetings. This timeline will serve as a reminderfor when to schedule meetings and identify what should be completedbefore each meeting.New Employee First Week Agenda Template – This template can beused to help define a schedule for a new employee during their firstweek(s) on the job.Written Reflection Template – This template of questions can be givento a new employee to help guide them during written reflectionexercises. Written reflections are a helpful way to capture theexperience of the new employee(s) from their perspective. Thequestions act as prompts that will hopefully inspire ideas or experiencesthat they can reflect upon.Employee Experience Journey Maps – We have included templates forall three employee experience journey maps (day one, week one, andthe first six months). The files can be downloaded, opened in GoogleDraw, and modified to fit the scope of your own project.Project Report Template – This is a final project report template thatyou can use to record all of your findings. The final report can beshared within your own organization and beyond.Applying the Toolkit
The TimelineWe chose to map the first six months of each new employee onboardingexperience, not knowing how time intensive it would be. We started bymeeting with participants on their very first day on the job, and worked withtheir supervisor to arrange an hour meeting as the last activity of their firstday. Following this, we met once a week during the first four weeks, andonce a month for the following five months. During the first month of theproject, each meeting lasted for one-hour and included both new employees.After receiving feedback from the participants at the end of month one thatthey would prefer to meet individually, we rescheduled all subsequentmeetings and shortened them to 30 minutes for each participant rather thanan hour for both (further discussion of participant feedback is included insubsequent section). In addition to meeting with participants, we heldseparate meetings to review the data being collected and to generate the finaljourney maps.Over the course of the six months, we made a number of adjustments to theproject, one of them being our projected timeline. We realized the six-monthtimeframe was too long, making the project very time-consuming. If thisproject was conducted using a one–three month timeline, even richerinformation could have been gathered and more focus given to areas needingthe most improvement. A shorter timeframe would also narrow the scope ofjourney mapping; given that a lot happens within an employee's first sixmonths, at times the scope of this particular project felt too broad, leading toan overwhelming amount of information to distill.We have put together a Timeline and Scheduling Tracker to help others stayon track while conducting this project. While the tracker covers up to sixmonths, we recommend you adapt it for a shorter timeframe of one–threemonths. Many meetings occur between the project facilitator and newemployees, with several tasks to complete in between meetings. Thistimeline will serve as a reminder for when to schedule meetings and identifywhat should be completed before each meeting.The Importance of the First Meeting
During the first meeting, we gave the employee a printout of the ProjectIntroduction and Outline, which explains the project in more detail andincludes brief information about journey mapping, an overview of theproject and goals, and a summary of the project timeline. After they wereintroduced to the project, they were given time to write a reflection abouttheir first day on the job. We have included a Written Reflection Templatethat can be given to a new employee to help guide them during writtenreflection exercises. The questions act as prompts that will hopefully inspireideas or experiences that participants can reflect upon.When presenting a project of this nature, it is important to be clear that it is afact-finding session. At times, our particular project felt like a mentoringsession and not always having set, focused questions allowed the newemployees to discuss their emotions beyond the scope of the project. Theparticipants occasionally wanted advice for how to navigate particularsituations or discuss an interaction with another colleague, thus strayingfrom the specific onboarding task being discussed. Having predetermined,set questions to refer back to helps focus the conversation in this situation aswell as reiterating your role in the project.When conducting this type of project, it is important to be mindful ofwhether you are conducting the project as a researcher or as a colleague, andunderstand what lens you are applying. When you present the project toparticipants, being very clear about your role in the project at the very firstmeeting will help guide future meetings. Occasionally, in meetings, detailswere exchanged that were sometimes awkward because employees feltcomfortable sharing more information than was initially asked for. Toremedy this, we recommend you use an agenda along with the set questionsto guide meetings throughout the entirety of the project and keepconversations on track. This will also help in addressing the clarity issuenoted above. We have included a New Employee First Week AgendaTemplate to help get you started. Together with the questions in the WrittenReflection Template, it can be used as a starting place to compile thequestions used in the meetings and can be revised with your specific projectgoals in mind. This technique will also keep responses from the projectfacilitator neutral and objective. Finally, the agendas serve an important rolein creating the “expected journey” section of the final journey map, as we’llsee in the next section.
Documenting the JourneyThe first step in documenting an experience journey is to document theexpected journey—that is, what the journey would or should look like at theoutset. We used agendas to do this. Our agendas were drafted by theLearning and Research Services department head for each employee tofollow closely on their first day and first week, which outlined the expectedonboarding journey. Our agendas extended no farther than this because therewas no real expectation about what onboarding looked like beyond thatperiod. The agendas provided very detailed and focused accounts of the newhires expected encounters, experiences, and tasks. It also guided much of theconversation that took place during the meetings, as we would ask for detailsabout each item on the agenda. Using the structure of the agendas, it waseasy to identify trainings, meetings, and other experiences that went well orcould be improved, allowing outcomes and recommendations to easily beidentified.As mentioned before, we met once a week with participants during the firstfour weeks, and once a month for the following five months. The newemployees were asked to write self-reflections in preparation for eachmeeting, although these were not mandatory. We provided a simple questiontemplate to prompt ideas or experiences the employees might considerreflecting on. They were asked questions such as:What have been some significant job-related accomplishments?What have you been trained to do?What do you really like or would really like to change?These questions were intentionally broad, given our high-level project goalsto learn about the current onboarding process and identify areas ofimprovement, and could be customized based on the goals of anotherinstitution. The written reflections form half of the data we analyzed tocreate the visualization of the actual journey as experienced by the newhires.Finally, much of the data was gathered during the meetings, where we tookmany notes while asking questions to learn more about the employeejourney. We did not identify specific questions for each meeting, rather, we
asked the employees about items on their agendas, what new training theyhad received, what else they had learned, and how that went from theirperspective. Again, our questions were general in nature given the high-levelgoals and broad scope of our project. If the new employees indicatedsomething went well or did not go well, we asked them why in attempt toidentify the underlying reason. This would serve as the other half of the datawe mined to form the experience journey visualization.Making Sense of the DataThis technique generates data in several formats, including the agendas ofthe new employees, written reflections from participants, and meeting notesin order to visualize the journeys and collect the richest information aboutthe current onboarding experience possible. All this data is eventuallysynthesized into a visual employee experience journey map. However, theraw data requires some review and preparation. The written reflections andmeeting notes, in particular, have to be reviewed to compile information forvisualizing the actual employee experience journey, including pain pointsand positive points.During review, we highlighted parts of the self-reflections where theemployee talked about positive experiences in green, negative experiences inorange, and suggestions for improvements in blue. This identified painpoints and good experiences to be included later in the final, visual journeymap, as well as opportunities and recommendations for improvements thatwere noted by each new employee (fig. 2).
Figure 2. Example of a written reflection after highlighting and review (usedwith permission).
We reviewed our meeting notes later in the same manner as the writtenreflections, highlighting pain points in orange, positive experiences in green,and recommendations in blue for easy identification when compiling thefinal visual journey map (fig. 3).
Figure 3. Examples of our meeting notes as project facilitators afterhighlighting and review (used with permission).
In the next section, we walk through how this data was synthesized intothree visual journey maps for each employee according to three keydurations of time: a map for the employee's first day, first week, and first sixmonths.Synthesizing the Employee Experience Journey MapsWe created the original templates for each map using Microsoft Publisher;these newly created templates for day one, week one, and the first sixmonths have been converted to Google Draw, which is a free software. Theyare available for reuse, and can be found in the EXJM project toolkit (Frank& McKelvey, 2017) included with this article.There are three main sections of journey maps: the expected journey whichsituates the context, the actual journey representing the steps a user goesthrough and how they feel along the way, and finally, the insights gainedfrom the journey leading to potential outcomes and improvements. Each ofthe three sections can be seen in the templates and in our final journey maps(figs. 4–10). All journey maps can be ‘read’ horizontally through each of thethree individual sections, which are laid out chronologically, and alsovertically to connect each step of the expected journey with how the newemployee actually felt about that experience. They are also linked to anyspecific outcomes or recommendations that resulted from that step in theirjourney.Synthesizing the Expected JourneyThe top section shows the employee’s expected journey in chronologicalorder from left to right. We used the first day and first week agendas and laidout the agenda items from left to right in chronological order, showing themeetings, training, events, etc. that each new employee was scheduled for ontheir first day, and first week. This section does not appear on the six-monthjourney map, as, again, the expected journey for that period was notexplicitly understood.Synthesizing the Actual Journey
The middle section visualizes the actual journey experienced by theemployee. We reviewed the highlighted written reflections and meetingnotes again for the time period captured in each of the journey maps. Foreach employee, the most painful points, the most positive points, and thepoints with actionable recommendations or solutions were included first aselements of the actual journey. We summarized each experience in a text boxwithin the middle section, and lined it up underneath the agenda item fromthe top section representing where in the journey that experience happened.Within this section, neutral experiences are shown in the middle with yellowboxes, positive points are elevated higher toward the upper section of themap in green, and pain points are lower toward the bottom in red. This helpsto visualize the difficulties that an employee goes through during theonboarding process.Synthesizing the Outcomes & RecommendationsFinally, the bottom section shows outcomes and recommendations, andconnects our insights and suggested improvements to the point in theemployee journey where that particular opportunity was identified. For thissection, we reviewed the written reflections and meeting notes, andsummarized the most important and/or actionable items in a text box. Again,recommendations were aligned vertically and placed under the agenda itemwhere it came up in the user experience, showing the connection betweenwhat our new employees experienced and recommendations for the future.Interpreting the Employee Experience Journey Maps toImprove Onboarding at MSU LibrarySince the basis of our project centers around employee experience journeymaps, it is important to understand how we interpreted the journey maps andmade sense of the information in order to make improvements to theonboarding experience at MSU Library. In this section, we share examplesand outcomes specific to MSU. We will walk you through the first day, firstweek, and six-month journey of Newbie Ruby and compare their journey tothe second new employee, Rookie Cookie.Newbie Ruby
Utilizing Newbie Ruby’s first day agenda, we knew exactly what theirexpected journey should look like for day one (fig. 4).Figure 4. Employee experience journey map for Newbie Ruby’s first day.On the first day, Newbie Ruby noted both good and bad experiences. Weexpected Newbie Ruby to settle in smoothly with paperwork and computersetup, but instead, paperwork was a pain point because Newbie Ruby forgotsome of her required documentation, and felt embarrassed (fig. 5).
Figure 5. Smaller, zoomed in section offf
Employee Experience Journey Map for Newbie Ruby’s first day.That experience led us to create a checklist for supervisors to use before theemployee’s first day, which includes sending important reminders andinformation to the employee on what to bring for their paperwork, where topark, and how to access the building. Luckily, the first day was not all badfor Newbie Ruby, who also expressed feeling welcomed by a friendlycolleague offering coffee, which led to our recommendation to schedulesomeone to take new employees to coffee/tea on their first day. NewbieRuby ended the day on a positive note by working on a specific projectwhich made them feel productive, leading to a recommendation forassigning a small task or project for the new employee to complete in thefirst week.Throughout the first week, Newbie Ruby expressed that they felt lost andwithout direction almost every day at some point; this led to the creation of afree time task list to give to the employee, listing many different options forprojects or training to complete during down times. Newbie Ruby mentionedthat one of the workshops they attended during the first week wasinteresting, but they did not know why they were attending or what theywere expected to learn or utilize from the content. This led to drafting anoutcomes based agenda template used to highlight the intended learningoutcomes of each item, if applicable (fig. 6).
Figure 6. Employee Experience Journey Map for Newbie Ruby’s first week.Over the first six months, Newbie Ruby noted more negative experiencesthan positive. (fig. 7). Both positive and negative experiences from the firstsix months led to recommendations for change. For example, NewbieRuby’s positive experience of learning by example led to the idea of creatingreference-training exercises compiled from past questions. Their experienceof being expected to take on more committee work in a shorter amount oftime than was given or approved of by their supervisor led to arecommendation to add information to a new employee manual about theexpected timeline for joining committees.
Figure 7. Newbie Ruby’s positive and negative experiences over during theirfirst six months.Overall, the journey map (fig. 7) shows that Newbie Ruby ran into moreroadblocks, questions, and negative experiences in the middle of their firstsix months of employment, and more positive experiences were notedtoward the end in month six. This could be due to new employees naturallyhaving more questions upfront, and hopefully in small part due to some ofthe immediate outcomes and improvements implemented throughout thisprocess.Rookie CookieIt is important to note that Rookie Cookie’s first day on the job was two daysafter Newbie Ruby’s. We were able to implement some changes to Rookie’sfirst two days based on what we learned from Newbie Ruby’s day onejourney.
Rookie Cookie was also given an agenda so we also knew exactly what theirexpected journey should look like for day one (fig. 8).Figure 8. Rookie Cookie's journey during their first day.On day one, Rookie Cookie noted a few negative experiences at thebeginning and again at the end of the day, with largely positive experiencesthroughout the day. The negative experiences starting day one stemmed inpart from a lack of knowledge that could have been avoided with previouscommunication and information provided by the employer. For example,Rookie Cookie noted that parking was difficult and stressful to figure outwith no information provided, and that the offer letter was not receivedbefore the first day. These led to updating a pre-hire checklist to include areminder to send parking information and the offer letter to the newemployees before they start. Positive experiences throughout the first dayalso led to recommendations about what to continue doing in the future,including providing a small welcome gift bag and scheduling the employeeto attend meetings to get acquainted with other folks in the department. Atthe end of the day, Rookie Cookie also remembered feeling overwhelmed in
a large meeting by not knowing people’s names, which led to the addition ofname cards in meetings when we have guests and new employees.Rookie Cookie’s first week was shorter, because they started mid-week on aWednesday, and therefore the first week journey map (fig. 9) covers only thefirst three days of employment.Figure 9. Employee experience journey map for Rookie Cookie's first week,which only consisted of three days.Day two notes mostly positive experiences, while day one and three showboth positive and negative experiences. Training on day two seemed to gowell and built tangible skills needed for the job. On day three, RookieCookie expressed feeling overwhelmed by meeting so many people on afull-building tour that was combined with introductions to many colleagues;therefore, we recommend that building and workspace tours be scheduledseparately from meeting colleagues, and that new employees be introducedto other colleagues one department at a time.
Over the first six months (fig. 10), Rookie Cookie noted more positiveexperiences than negative. Again, as with Newbie Ruby, both good and badexperiences from the first six months led to recommendations. For example,Rookie Cookie found it difficult to explain to our student employees whatthe expectations were regarding technology troubleshooting and what weexpect student employees to be able to help with. This led to the creation ofa one-page worksheet with tech-troubleshooting guidelines and reportingform, that students now use to help them walk through the troubleshootingprocess,
organizations have utilized journey mapping in similar ways. A study in Ireland focused on how journey mapping can be used to improve the patient experience within the healthcare system by using a human-centric design tool to better understand how patients navigate such a complex system (McCarthy et al., 2016).