Transcription
Harvard UniversityGraduate School of DesignZofnass Program for Infrastructure SustainabilityOctober 7, 2009Data Mapping, Modeling and Experiential Simulation as InformationManagement Tools in Urban System and Infrastructure DesignShelby DoyleIntroductionThe purpose of this paper is to document and analyze available urban modeling and simulationtechnologies, some of which were introduced during the ETH Information Architecture: Urban SimulationWorkshop entitled Reconstruct the Future! which was conducted during June 2009 in Zurich, Switzerland.This information is presented as a framework for the addition of future research and should not beconsidered an exhaustive list of available technologies. Instead it should serve the Zofnass Program forInfrastructure Sustainability and its team members as a tool by which to determine which, if any,technologies Zofnass Program should pursue in future research.BackgroundThe Harvard University Graduate School of Design (GSD) Zofnass Program for InfrastructureSustainability is a research group funded by donors Paul and Joan Zofnass of the The EnvironmentalFinancial Consulting Group (EFCG) and supported by GSD faculty and students. The mission of theZofnass Program is to support research and education that will result in the development, distribution,and adoption of sustainability standards for large scale development and infrastructure. The ZofnassProgram aims to better enable the design industry to promote and utilize sustainable options for thedesign and delivery of infrastructure projects.The Zofnass Program promotes the development, distribution and adoption of sustainable developmentmethods and tools that define and quantify “sustainability” in the context of infrastructure and large-scaledevelopments. The objective is to develop a set of recommended guidelines for developing sustainablelarge-scale projects. This will be accomplished by working in collaboration with the Center forEnvironmental Health at the School of Public Health, Harvard’s Office of Sustainability, the HarvardUniversity Center for the Environment, faculty at the GSD and other divisions of Harvard University thathouse sustainability expertise, and design industry leaders.The primary goal of the Zofnass Program is to identify the issues and complete an “alpha” version of therecommended guidelines for sustainable large-scale projects. To achieve this goal, the Zofnass Programwill study quantitative methods that can be used for measuring sustainability, as well as the integration ofsustainability into the design of infrastructure and large-scale projects from the earliest stages of theirThis case was prepared by research assistant Shelby Doyle, LEED AP under the supervision of Dr. Richard W. Jennings, FAIA, Lecturer inArchitecture and Research Associate at the Harvard University Graduate School of Design as part of Zofnass Program for InfrastructureSustainability, Prof. Spiro N. Pollais, Director, as the basis for class discussion rather than to illustrate effective or ineffective management of anadministrative situation, a design process, or a design itself.Copyright 2009 by the President and Fellows of Harvard College. To order copies or request permission to reproducematerials call (617) 495-4496. No part of this publication may be reproduced, stored in a retrieval system, used in aspreadsheet, or transmitted in any forms by any means–electronic, mechanical, photocopying, recording or otherwise–withoutthe permission of Harvard University Graduate School of Design.Page 1 of 20
Zofnass Program for Instrastructure Sustainabilitydevelopment. The Zofnass Program’s applied research focuses on the management of information, the1diffusion of innovation, and the economics of sustainability.In June 2009, the author attended the Swiss Federal Institute of Technology Zurich’s (ETH) InformationArchitecture: Urban Simulation Workshop entitled Reconstruct the Future! (RTF). The RTF Course is part2of the International Alliance of Research Universities (IARU) Global Summer Program (GSP). GSPstudents have the opportunity to explore the most urgent challenges and opportunities for humanity in the21st century. Issues explored by the IARU range from international environmental policy, contemporaryAsian development to global leadership.The RTF Course was presented by the ETH Chair of Information Architecture, which develops visualcomputer based methods for supporting analysis, design and planning of urban systems. The Chair forInformation Architecture investigates innovative design and visualization methods in order to developseamlessly interconnected computer-assisted design and simulation processes. Research goals of theChair are the fundamentals of knowledge visualization and the integration of simulations. The Chair'seducational and practice goal is the design and simulation of sustainable future cities.The RTF Course provided an introduction to visualizing city schemes through computer-based methodsand field trips within Switzerland to a variety of urban environments. The goal of the course was tofamiliarize the students with computer-assisted design processes and test its application within the field ofarchitecture. A key part of the education at the Chair is the Value Lab, a new collaboration environmentfor virtual design and planning. It combines the use of complimentary views on high-resolution computerdisplays with direct multi-touch content manipulation creating a streamlined workflow for the evaluation ofdesign. The Value Lab space currently consists of five large-scale, high-resolution LCD-panels and twohigh-resolution projectors. Three LCD-panels are wall mounted in an interactive display wall and two arecombined to create a large interactive display table. Both the display row and the interactive table are3equipped with multi-touch technology.ETH Chair for Information Value Lab1Zofnass Program for Infrastructure Sustainability h centers/zofnass/index.html2The IARU is comprised of ten research universities: ANU, ETH Zurich, National University of Singapore, Peking University,University of California, Berkeley, University of Cambridge, University of Copenhagen, University of Oxford, the University of Tokyoand Yale University3ETH Chair for Information Architecture Website http://www.ia.arch.ethz.ch/Page 2 of 20
Zofnass Program for Instrastructure SustainabilityUrban Simulation OverviewFor the purpose of this paper the expansive field of simulation will be understood as the art or science ofimitating the future based on the knowledge of the past and present. Additionally, a computer simulationwill be understood as a system that is designed to simulate an abstract model of a particular systemthrough the use of a mathematical model. This simulation method attempts to find analytical solutions toproblems and thereby enable the prediction of the behavior of the system from a set of parameters andinitial conditions. As Paul Waddell states in Introduction To Urban Simulation:Design And Development Of Operational Models “While the value of theoretical models is facilitating abroad understanding of some underlying principles of urban development and transportation, much of thiswork remains too simplified in its assumptions and too abstract to be of direct value to agencies needingto inform decisions about specific policies and investments in particular urban settings.” Waddell’s paperalso offers an excellent overview of Urban Simulation, see attached.Specifically the topic at hand is the simulation of urban centers, their processes, and the infrastructurethat supports these environments. Urban centers, or cities, represent the most complex humanconstructed systems on the planet and therefore their simulation is particularly difficult to manage andcontrol through computer modeling. A single author of an urban simulation cannot create a result similarto that which emerges from the millions of authors who contribute to the design city. What then can bedone? Should the Zofnass Program pursue urban simulation as part of its processes and if so how shouldthe group move forward given the current limitation of urban simulation technologies?The question that arises from this initial assessment of urban simulation is: which factors should beconsidered in an urban simulation? The possible inputs are endless: material, water, capital, information,architecture, history, biology, geology, zoning, transit, memories etc. More importantly in the case ofcomputer-based simulation, not all of these inputs are easily quantified or rather quantifiable in a usefulway. For example, temperature is an easily available metric, which nonetheless offers several subjectiveanalyses. The average temperature of a city is a data set that is often available for at least the last twocenturies. However, during that time the technology which measured the temperature likely changed, thelocation of where the temperature was taken likely changed, the person who took the temperature likelychanged and so on. Additionally, the temperature taken and recorded for a city is likely the numericaverage of several temperature stations, for example New York City’s temperature is defined in part bythe temperature of Central Park and LaGuardia Airport, two very different environments.For example, the number considered to represent the average temperature of New York City is really atbest a generalized number assigned by humans to reflect the closest thing to an average which we arecollectively capable of representing. For example, if I wanted to simulate the temperature fluctuation ofEast Fourth Street between Avenues A and B where I lived during 2004 and 2005 then I would be at aloss to represent the actual temperature of the street, not to mention the completely different temperatureof the apartment courtyard, and the roof, which was often several degrees cooler. This isn’t a uselessanecdote about a singular event instead it in an analogy for all of the metrics which make up a city. Citesare constructed of millions upon millions of these extremely specific moments which are not easilyquantifiable and which may or may not aggregate to create a different result than the averages which aregeneral input into a computer model.The act of simulating entails representing certain key characteristics or behaviors of a selected physicalor abstract system. Since simulation always involves the placement of human constraints upon a systemit can never be an entirely objective process. Rule-based mathematical models are flawed analogies for acity which is authored by millions of people, sometimes over hundreds of years, creating a number ofinputs far exceeding current computational capacity. More importantly, humans and groups of humans donot follow a given set of rules with the consistency necessary for computational parameters to be applied.The Zofnass Program aims to identify those metrics which are most useful in gauging the success of anurban environment. Consequently those metrics which are the most useful to simulate in the researchand design phase of a projects are those which can be quantified and mathematically modeled. For thesake of research consistency acceptable metrics are those, which are derived from measurable data andfactual information and can be used as a basis for reasoning, discussion, or calculation. For the purposePage 3 of 20
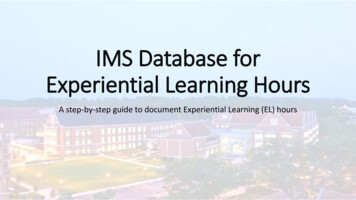
Zofnass Program for Instrastructure Sustainabilityof computer simulations this information is most valuable in a numerical form that can easily be digitallytransmitted or processed.Additionally, and perhaps even more importantly than establishing a metric and gathering that metrics isthe communication or reception of knowledge or intelligence extracted from a data set. The mapping ofinformation far exceeds a graphic exercise. Like simulation, the mapping of information is a subjectiveprocess. Each mapping and simulation software explored demonstrates strengths and weaknesses in themethod by which data is represented.Mapping and Simulation Software StrategiesThe following list of mapping and simulation software began during the ETH Reconstruct the Future!Workshop. Not all of the specific technologies were covered in the workshop but the general conceptsbehind the software and mapping strategies were discussed at length. The following technologies werechosen for their possible use to the Zofnass Program either in concept or practice. Some of thesestrategies are about how to accurately map a current condition. The idea behind these maps is that bybuilding an accurate conception of the present a projection or simulation of the future becomes apossibility.Mental MapsMental maps are a concept introduced to the RTF workshop by Dr. Remo Burkhard. These maps areindividual conceptions of urban space and experience. Individuals physically document their mentalconceptions of a space. This documentation may include perceptions of distance, quality of experience,mental placement of boundaries and nodes relative to one another and individual landmarks in urbanspace.This is a highly subjective but often informative way of mapping space. In design this tool can be used atthe schematic design phase. It is informal and ‘inaccurate’ as a metric but often very telling in whichspaces people like and why. This type of mapping allows for collaboration with sociologists,psychologists, anthropologists and other researchers working to document human responses to space.Top: Mental map from Dr. Remo BurkhardLeft: Google map of the same area in ZurichPage 4 of 20
Zofnass Program for Instrastructure SustainabilityProcessingProcessing is an open source project initiated by Casey Reas and Benjamin Fry, both formerly of theAesthetics and Computation Group at the MIT Media Lab. It is "a programming language and integrateddevelopment environment (IDE) built for the electronic arts and visual design communities", which aims toteach the basics of computer programming in a visual context, and to serve as the foundation forelectronic sketchbooks. Large data sets can be managed and translated into visual maps or imagesthrough the use of Processing technology. This technology was introduced during the RTF workshop.Students mapped their fellows mental maps of forty three destination points to create an understanding ofwhich urban spaces were ‘liked’ the most and why. This was measured by a ranking of -2 to 2 for eachstop and a brief comment about each stop.As a design tool processing allows for the visualization of data into information, which would nototherwise be understandable to a viewer. The nature of this visualization is highly subjective anddependent on the designers understanding of the data set and what the designer wants to convey to theviewer.Page 5 of 20
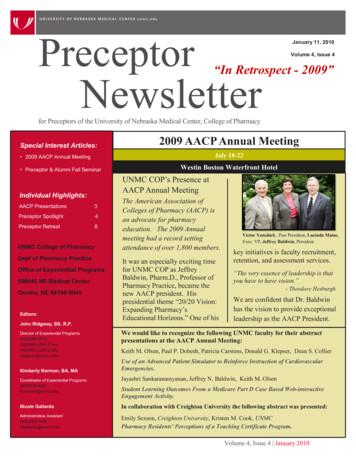
Zofnass Program for Instrastructure Sustainability#name station-1 NUMstation-1 WORDSstation-2 NUM station-2 WORDS station-3 NUM station-3 WORDS.kai2nice, massive infratstucture 1jogging, sunny, clear water, river1view, water, waternoises, windy0playground, petting-zoo, many people 2nice bridge0cool bookshop /cafe1green, hot girls0no people, empty, nice building structure-1big square, nice trees, nopeople -2ugly paintings, terrible music 01nice factory-1loud, genericsquare, boring0infrastructure, construction1nice office-2boring, non-space 1nice station2mountain, demolishment2infrastructure, many people, busy1sweet freitag tower 2cool arc\'s0green1nice tectonics1nice park 1coop, supermarket, nice little square-1too clean 0no trash 1nice cafe\'s1very busy, urban1urban area2cool square, action, loud, busy, many people-2weird, boring0-2ugly architecture2interesting space 1infrastructure, music2amazing river, urban2nature, water, river 2greatbridge, cool perspective1alternative people, beer, cafe 2volleyball, beach, water, river, bikini2swimming, fun1many people, beer, exspensiveTop: Graphic representation of the same area Mental Mapped by Dr. BurkhardMiddle: Graphic and text representation of the same area Mental Mapped by Dr. BurkhardBottom: A sample of the raw data which is demonstrated graphically on the above two maps through ProcessingCityEngineThe CityEngine software provides professional users in entertainment, architecture, urban planning andgeneral 3D content creation with a unique early design and modeling solution for the efficient vizualisationof urban 3D environments. CityEngine was developed by ETH graduates and introduced during the RTFworkshop. The CityEngine offers unique street growth tools to quickly design and construct urban layouts.Street patterns such as grid, organic or circular are available and the topography of the terrain is takeninto account. Real street networks of any city in the world can be imported from OpenStreetMap. Thisallows for a quick generation of existing urban surroundings. Furthermore street networks or lotsdesigned in other programs can be imported via the DXF file format. Scripting of parametric buildings and3D streets. CityEngine urban simulation technology uses rule-based scripts to rapidly generate types ofcities. As can be seen in the below map of Manhattan, existing cities often have aspects of their gridPage 6 of 20
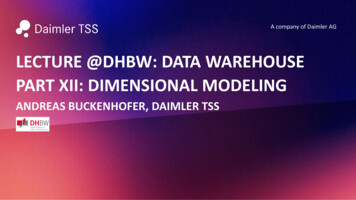
Zofnass Program for Instrastructure Sustainabilitywhich break the rules. In the case of Manhattan Broadway does not follow the grid but plays an importantrole in the quality of the city. As the technology develops these mutations will become easier to manage.As a design tool for rapid urban generation CityEngine is very useful. It is not accurate enough to be usedas a simulation tool for an existing or future urban environment, although it is readily available and used inmovie-making and video game development.Page 7 of 20
Zofnass Program for Instrastructure SustainabilityTop: Organic city generated with CityEngine. Middle: Radial city generated with CityEngine. Bottom Left: Rule generated “Manhattan”as compared to an actual map of Manhattan Bottom Right: Work flow chart for CityEngine Bottom Right Corner: Parametricallyscripted 3D BuildingMapA Google Map is a satellite generated political boundary and road maps. Selective place names includedat different scales or ‘zooms.’ The technology is free, easy to use and web based. Accuracy should beconfirmed with a third party if possible when using Google Map as a research tool. During the workshopGoogle Maps were used to identify what looked to be ‘interesting’ spaces from an aerial view. Theidentified spaces were then visited and it was noted whether the original notion of ‘interestingness’ wasaccurate. Data is drawn from multiple sources to create these maps.In design this birds eye view is often used at the urban planning scale to show how a new developmentcould fit into an existing context. This type of mapping is a traditional design tool and can be a useful atany stage of the design process.Page 8 of 20
Zofnass Program for Instrastructure SustainabilityGoogle Map identifying the Harvard GSD at 48 Quincy St, Cambridge MA 02138.Map LayersAdditional layers of information also can be added to a Google map. These layers are designed to furtherthe understanding of a place. For example the photos, videos and Wikipedia data available for the areasurrounding the GSD at 48 Quincy Street is all user-generated content. For this reason the content maynot be metrically accurate but could be useful in understanding the user quality of a given site.Page 9 of 20
Zofnass Program for Instrastructure SustainabilityClockwise from Top Left (All maps are Google Maps identifying the Harvard GSD at 48 Quincy St, Cambridge MA 02138).Terrain, Live Traffic Conditions, Videos Available, Transit, Wikipedia Entries, Photos AvailableSatellite MapSatellite generated photographs of the majority of the inhabited planet. Since these maps are temporallysensitive and static they are sometimes they are not current (ie photos taken after a hurricane.) These areprojected images, which are stitched together to create a ‘flat’ image, which creates an inconsistency ofcolor and projection over a city. Also, time of day is not dynamic. Images show one time of day and sun,sky, foliage or water condition. Data is drawn from multiple sources to create these maps.In design this view is often used at the urban planning scale to show how a new development could fitinto an existing context, this type of mapping is a traditional design tool, although the satellite imaging is arelatively new technology. This is a useful mapping technology for the Zofnass program since it alsoidentifies foliage and some relative building depth/height is shown due to shadows cast.Page 10 of 20
Zofnass Program for Instrastructure SustainabilityTop: Google Satellite Map identifying the Harvard GSD at 48 Quincy St, Cambridge MA 02138.Bottom: Labeled Google Satellite Map identifying the Harvard GSD at 48 Quincy St, Cambridge MA 02138.Street ViewThese are photos taken from a Google car of the ‘street view’ of any given street. Limited to access to anarea and the time of day in which the photo was taken. Again these photos are stitched together to createa consistent projection, sometimes unsuccessfully.Page 11 of 20
Zofnass Program for Instrastructure SustainabilityIn design this view is often used to integrate a rendered image of a future design to show how that designcould integrate into an existing context from a user view, often used in marketing and advertising ofarchitectural or urban design projects, one of the most readily ‘understood’ visualization tools as it mimicshuman visual experience from eye level.Google Street View of the Harvard GSD at 48 Quincy St, Cambridge MA 02138.User Generated ContentUsers contribute their thoughts on a give place (ie restaurant reviews, best of lists) creating an organic,grass roots conception of a city which is free to interpretation and individual opinion. This type ofdocumentation allows for ongoing and unedited content. Although the feedback is limited to those whochoose to participate in a technology user group.In design these maps can be used to identify ‘hot’ or ‘up and coming areas’ which may not have the visualtrappings of wealth or development but which are greatly appreciated by usersSim CitySim City is a city-building simulation computer game developed by Maxis, a subsidiary of Electronic Arts.The game allows players to create a region of land by terraforming, and then to design and build asettlement which can grow into a city. Players can zone different areas of land as commercial, industrial,or residential development, as well as build and maintain public services, transport and utilities. For thePage 12 of 20
Zofnass Program for Instrastructure Sustainabilitysuccess of a city players must manage its finances, environment, and quality of life for its residents. Nightand day cycles and other special effects are integrated into the game. External tools such as the BuildingArchitect Tool (BAT) allow custom third party buildings and content to be added to the gameplay. Thegamer can play in God Mode or Mayor Mode, where the actual city building is conducted. Players canbuild transportation networks, which include roads, streets, avenues, highways, railways, subway lines,and bus stations. Sim City was introduced into the discussion as part of the RTF workshop.The game simulates urban decay and gentrification with buildings deteriorating accordingly. Buildingsoriginally constructed for occupation by higher wealth tenants can now support lower wealth tenants inthe event surrounding factors forces the current tenants to vacate the building; this allows certainbuildings to remain in use despite lacking its initial occupants. Buildings and lots can now be constructedon slopes.Funding can now be adjusted for individual buildings, allowing users to specify how much money shouldbe spent to supply a service in accordance to the local population. Maintenance expenses for public utilityfacilities will increase as they age. The maximum output of facilities also decreases as they get older. Therate at which facilities age is dependent on the percentage of its capacity being used and the level offunding being given to it.The temporal nature of Sim City make it a precedent worthy of examining. Algorithms are in place whichmimic everything from the likelihood of a natural disaster to the ebbs and flows of local economy.Although Sim City is generally not perceived as an academically useful planning tool it does offer aprecedent of layers many, many types of data from environmental to historic into a feedback loop thatmimics the development of a physical city.Google Street View of the Harvard GSD at 48 Quincy St, Cambridge MA 02138.Second LifeSecond Life (SL) is a virtual world developed by Linden Lab and is accessible via the Internet. A freeclient program called the Second Life Viewer enables its users, called Residents, to interact with eachother through avatars. Residents can explore, meet other residents, socialize, participate in individual andgroup activities, and create and trade virtual property and services with one another, or travel throughoutthe world, which residents refer to as the grid. Second Life was examined by students during the RTFworkshop.Page 13 of 20
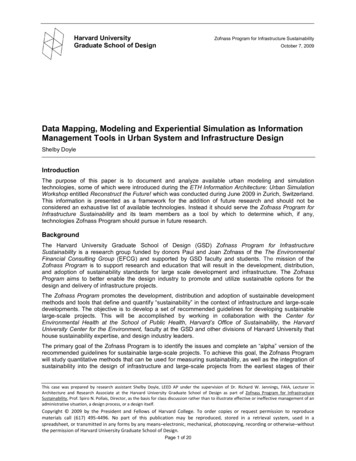
Zofnass Program for Instrastructure SustainabilityBuilt into the software is a three dimensional modeling tool based around simple geometric shapes thatallows a resident to build virtual objects. This can be used in combination with the Linden ScriptingLanguage, which can be used to add functionality to objects. More complex three-dimensional Sculptedprims (colloquially known as sculpties), textures for clothing or other objects, and animations andgestures can be created using external software. The Second Life Terms of Service ensure that usersretain copyright for any content they create, and the server and client provide simple digital rightsmanagement functions. Second life’s content is user-generated and much of the actual built world hasbeen replicated. Second life has an economy, money is exchanged, and goods and services rendered.Although Second Life does not serve the needs of the Zofnass Program it does offer the precedent of asimulated world of complexity. SL’s development begins to approach the complexity of the physical worldand is a promising step toward achieving the complexity of simulation needed to provide feedback at theurban scale. The multi-user content generated reflects more realistically the development of an actualurban environment.Top: Second Life NASA station on Mars. Bottom Left: Second Life Amsterdam, The Netherlands. Bottom Right: Second LifeGuggenheim Museum New York, New York.Page 14 of 20
Zofnass Program for Instrastructure SustainabilityUrbanSimUrbanSim is being developed by an interdisciplinary research group at the University of Washington inSeattle. It is within this planning context that the UrbanSim model has been developed. The modelimplements a perspective on urban development that represents a dynamic process resulting from theinteraction of many actors making decisions within the urban markets for land, housing, non-residentialspace and transportation. For example: Households make choices about whether to move, and if theymove, where to locate, businesses make similar decisions, Developers make choices of what propertiesto develop or redevelop and into what use, at what density and scale, governments make infrastructureinvestments, and place constraints on development in the form of land use plans, density constraints,environmentally-sensitive land restrictions, urban growth boundaries, and many other policies.By treating urban development as the interaction between market behavior and governmental actionsUrbanSim is designed to maximize reality, thereby increasing its utility for assessing the impacts ofalternative governmental plans and policies related to land use and transportation. Thus, the modeldesign enhances the strategic planning capabilities of MPOs and other state and local agencies needingto evaluate growth management policies such as urban growth boundaries, assess consistency of landuse and transportation plans, and address conformity with respect to air quality implementation plans.Running the model requires exogenous input information derived from: population and employmentestimates, regional economic forecasts, transportation system plans, land use plans, land developmentpolicies such as density constraints, environmental constraints, and development impact feesThe user interacts with UrbanSim to create "scenarios," specifying alternative packages of forecasts, landuse policy assumptions, and other exogenous inputs. The model is then executed for a given scenario,4and the results of one or more scenarios can be examined and compared.4UrbanSim website http://cuspa.washington.edu/description/Page 15 of 20
Zofnass Program for Instrastructure SustainabilityMapping and Simulation Hardware StrategiesThis paper did not focus on the Hardware needed to express the majority of these technologies. TheValue Lab (see photograph) was introduced during the RTF workshop as a potential platform foradvanced urban simulation. The GSD does not currently have a dedicated equivalent to the ETH’s ValueLab and the Zofnass Program therefore does not currently engage with a similar simulation platform.However, the possibilities for communicating complex graphics and 3D models in a collaborativeenvironment are vastly increased by access to facilities similar to the Value Lab. Students were welcometo use the Value Lab during their time at the RTF workshop.There are several ways to approach the use of hardware in the Zofnass Program. Although this was notthe focus of this research the hardware platforms available and required.Integrate with existing technologies through the Computer Resources Group at the GSDto use available hardware to
the communication or reception of knowledge or intelligence extracted from a data set. The mapping of information far exceeds a graphic exercise. Like simulation, the mapping of information is a subjective process. Each mapping and simulation software explored demonstrates strengths and weaknesses in the method by which data is represented.