Transcription
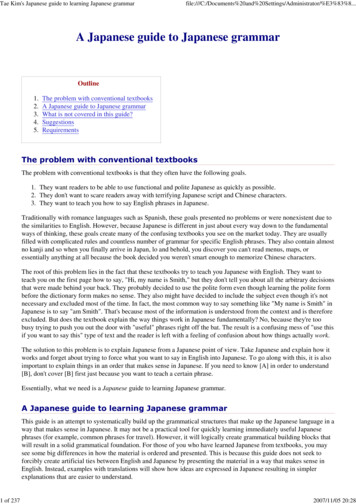
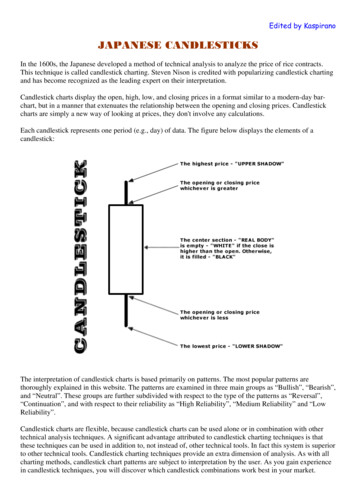
Edited by KaspiranoJAPANESE CANDLESTICKSIn the 1600s, the Japanese developed a method of technical analysis to analyze the price of rice contracts.This technique is called candlestick charting. Steven Nison is credited with popularizing candlestick chartingand has become recognized as the leading expert on their interpretation.Candlestick charts display the open, high, low, and closing prices in a format similar to a modern-day barchart, but in a manner that extenuates the relationship between the opening and closing prices. Candlestickcharts are simply a new way of looking at prices, they don't involve any calculations.Each candlestick represents one period (e.g., day) of data. The figure below displays the elements of acandlestick:The interpretation of candlestick charts is based primarily on patterns. The most popular patterns arethoroughly explained in this website. The patterns are examined in three main groups as “Bullish”, “Bearish”,and “Neutral”. These groups are further subdivided with respect to the type of the patterns as “Reversal”,“Continuation”, and with respect to their reliability as “High Reliability”, “Medium Reliability” and “LowReliability”.Candlestick charts are flexible, because candlestick charts can be used alone or in combination with othertechnical analysis techniques. A significant advantage attributed to candlestick charting techniques is thatthese techniques can be used in addition to, not instead of, other technical tools. In fact this system is superiorto other technical tools. Candlestick charting techniques provide an extra dimension of analysis. As with allcharting methods, candlestick chart patterns are subject to interpretation by the user. As you gain experiencein candlestick techniques, you will discover which candlestick combinations work best in your market.
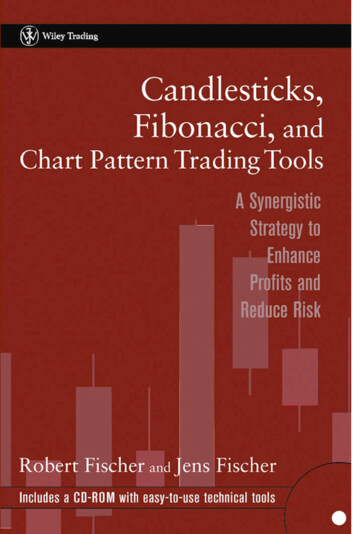
BULLISH REVERSAL PATTERNSHIGH RELIABILITYBULLISH PIERCING LINEDefinition : Bullish Piercing Line Pattern is a bottom reversal pattern. A long black candlestick is followedby a gap lower during the next day while the market is in downtrend. The day ends up as a strong whitecandlestick, which closes more than halfway into the prior black candlestick’s real body.Recognition Criteria:1. Market is characterized by downtrend.2. We see a long black candlestick.3. Then we see a long white candlestick whose opening price is below previous day’s low on the second day.4. The second day’s close is contained within the first day body and it is also above the midpoint of the firstday’s body.5. The second day however fails to close above the body of the first day.Explanation:The market moves down in a downtrend. The first black real body reinforces this view. The next day themarket opens lower via a gap. Everything now goes, as bears want it. However suddenly the market surgestoward the close, leading the prices to close sharply above the previous day close. Now the bears are losingtheir confidence and re-evaluating their short positions. The potential buyers start thinking that new lows maynot hold and perhaps it is time to take long positions.Important Factors:In the Bullish Piercing Pattern, the greater the degree of penetration into the black real body, the more likelyit will be a bottom reversal. An ideal piercing pattern will have a real white body that pushes more than halfway into the prior session’s black real body.A confirmation of the trend reversal by a white candlestick, a large gap up or by a higher close on the nexttrading day is suggested.
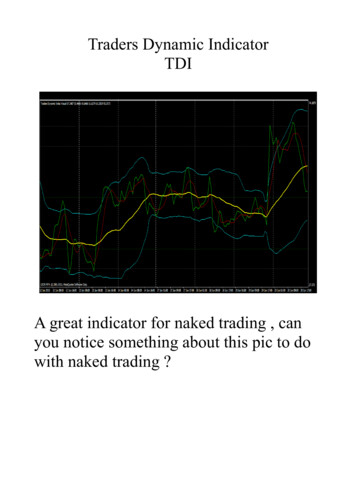
BULLISH KICKING PATTERNDefinition: The Bullish Kicking Pattern is a White Marubozu following a Black Marubozu. After the BlackMarubozu, market gaps sharply higher on the opening and it opens with a gap above the prior session’sopening thus forming a White Marubozu.Recognition Criteria:1. Market direction is not important.2. We first see a Black Marubozu pattern.3. Then we see a White Marubozu that gaps upward on the second day.Explanation:This Bullish Kicking Pattern is a strong sign showing that the market is headed upward. The previous marketdirection is not important for this pattern unlike most other candle patterns. The market is headed up with theBullish Kicking Pattern as the prices gap up the next day. The prices never enter into the previous day'srange. Instead they close with another gap.Important Factors:We should be careful that both of the patterns do not have any shadows or they have only very small shadows(they both are Marubozu).The Bullish Kicking Pattern is somewhat similar to the Bullish Separating Lines Pattern. The opening pricesare equal in Bullish Separating Lines Pattern while in the Bullish Kicking Pattern a gap occurs.The Bullish Kicking Pattern is highly reliable, but still, a confirmation of the reversal on the third day shouldbe sought. This confirmation may be in the form of a white candlestick, a large gap up or a higher close onthe third day.
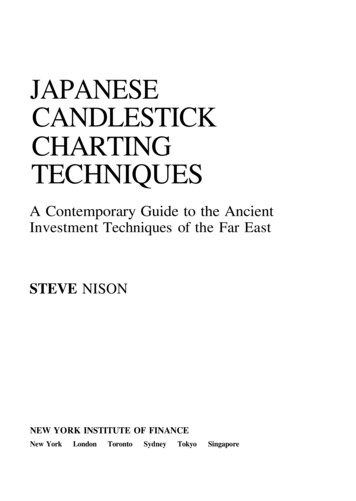
BULLISH ABONDONED BABYDefinition: The Bullish Abandoned Baby Pattern is a very rare bottom reversal signal. It is composed of aDoji Star, which gaps away (including shadows) from the prior and following days’ candlesticks.Recognition Criteria:1. Market is characterized by downtrend.2. We usually see a long black candlestick in the first day.3. Then a Doji appears on the second day whose shadows gap below the previous day's lower shadow andgaps in the direction of the previous downtrend.4. Then we see a white candlestick on the third day with a gap in the opposite direction with no overlappingshadows.Explanation:We have a similar scenario that is valid for most of the three-day star patterns. In a falling market, the marketshows bearish strength first with a long black candlestick and opens with a gap on the second day. Thesecond day trading is within a small range and second day closes at or very near its open. This now suggeststhe potential for a rally showing that positions are changed. The signal of trend reversal is given by the whitethird day and by well-defined upward gap.Important Factors:The Bullish Abandoned Baby Pattern is quite rare.The reliability of this pattern is very high, but still a confirmation in the form of a white candlestick with ahigher close or a gap-up is suggested.
BULLISH MORNING DOJI STARDefinition: This is also a three-candlestick formation signaling a major bottom reversal. It is composed of along black candlestick followed by a doji, which characteristically gaps down to form a doji star. Then wehave a third white candlestick whose closing is well into the first session’s black real body. This is ameaningful bottom pattern.Recognition Criteria:1. Market is characterized by downtrend.2. We see a long black candlestick in the first day.3. Then we see a Doji on the second day that gaps in the direction of the previous downtrend.4. The white candlestick on the third day confirms the reversal.Explanation:Black real body while market is falling down may suggest that the bears are in command. Then a Dojiappears showing the diminishing capacity of sellers to drive the market lower. Confirmation of bullascendancy is the third day’s strong white real body. An ideal Bullish Morning Doji Star Pattern must have agap before and after the middle line’s real body. The second gap is rare, but lack of it does not take awayfrom the power of this formation.Important Factors:The Doji may be more than one, two or even three.Doji’s gaps are not important.The reliability of this pattern is very high, but still a confirmation in the form of a white candlestick with ahigher close or a gap-up is suggested.
BULLISH MORNING STARDefinition: This is a three-candlestick formation that signals a major bottom. It is composed of a first longblack body, a second small real body, white or black, gapping lower to form a star. These two candlesticksdefine a basic star pattern. The third is a white candlestick that closes well into the first session’s black realbody. Third candlestick shows that the market turned bullish now.Recognition Criteria:1. Market is characterized by downtrend.2. We see a long black candlestick in the first day.3. Then we see a small body on the second day gapping in the direction of the previous downtrend.4. Finally we see a white candlestick on the third day.Explanation:We see the black body in a falling market suggesting that the bears are in command. Then a small real bodyappears implying the incapacity of sellers to drive the market lower. The strong white body of third dayproves that bulls have taken over. An ideal Bullish Morning Star Pattern preferably has a gap before and afterthe middle candlestick. The second gap is rare, but lack of it does not take away from the power of thisformation.Important Factors:The stars may be more than one, two or even three.The colour of the star and its gaps are not important.The reliability of this pattern is very high, but still a confirmation in the form of a white candlestick with ahigher close or a gap-up is suggested.
BULLISH THREE INSIDE UPDefinition: The Bullish Three Inside Up Pattern is another name for the Confirmed Bullish Harami Pattern.The third day is confirmation of the bullish trend reversal.Recognition Criteria:1. Market is characterized by downtrend.2. We see a Bullish Harami Pattern in the first two days.3. Then we see a white candlestick on the third day with a higher close than the second day.Explanation:The first two days of this pattern is simply the Bullish Harami Pattern, and the third day confirms the reversalsuggested by the Bullish Harami Pattern, since it is a white candlestick closing with a new high for the lastthree days.Important Factors:The reliability of this pattern is very high, but still a confirmation in the form of a white candlestick with ahigher close or a gap-up is suggested.
BULLISH THREE OUTSIDE UPDefinition: The Bullish Three Outside Up Pattern is simply another name for the Confirmed BullishEngulfing Pattern. The third day is confirmation of the bullish trend reversal.Recognition Criteria:1. Market is characterized by downtrend.2. We see a Bullish Engulfing Pattern in the first two days.3. The third day is a white candlestick with a higher close than the second day.Explanation:The first two days of this three-day pattern is simply a Bullish Engulfing Pattern, and the third day confirmsthe reversal suggested by the Bullish Engulfing Pattern since it is a white candlestick closing with a new highfor the last three days.Important Factors:The reliability of this pattern is very high, but still a confirmation in the form of a white candlestick with ahigher close or a gap-up is suggested.
BULLISH THREE WHITE SOLDIERSDefinition: Bullish Three White Soldiers Pattern is indicative of a strong reversal in the market. It ischaracterized by three long candlesticks stepping upward like a staircase. The opening of each day is slightlylower than previous close rallying then to a short term high.Recognition Criteria:1. Market is characterized by downtrend.2. We see three consecutive long white candlesticks.3. Each candlestick closes at a new high.4. The opening of each candlestick is within the body of the previous day.5. Each consecutive day closes near or at its highs.Explanation:The Bullish Three White Soldiers Pattern appears in a context where the market stayed at a low price for toolong. The market is still falling down and it is now approaching a bottom or already at bottom. Then we see adecisive attempt upward shown by the long white candlestick. Rally continues in the next two dayscharacterized by higher closes. Bears are now forced to cover short positions.Important Factors:The opening prices of the second and third days can be anywhere within the previous day's body. However, itis better to see the opening prices above the middle of the previous day's body.If the white candlesticks are very extended, one should be cautious about an overbought market.The reliability of this pattern is very high, but still a confirmation in the form of a white candlestick with ahigher close or a gap-up is suggested.
BULLISH CONCEALING BABY SWALLOWDefinition: This pattern is highlighted by two consecutive Black Marubozu. They are characterized by thefact that a gapping black candlestick trades into the body of the previous day and it is seen during adowntrend. Then there is another Black Marubozu on the third day showing sale of positions since it closes ata new low. However this may give incentive to the shorts to cover their positions implying that a bullishreversal is now possible.Recognition Criteria:1. Market is characterized by downtrend.2. We see two consecutive Black Marubozu in the first and second days.3. Then we see a black candlestick on the third day opening with a downward gap but trading into the bodyof the second day and it is characterized by a long upper shadow.4. Finally we see another Black Marubozu on the fourth day that completely engulfs the candlestick of thethird day including the shadow.Explanation:Two black Marubozu show that downtrend is continuing to the satisfaction of the bears. On the third day, wesee a downward gap further confirming the downtrend. However, prices on the third day start going abovethe close of the previous day causing some doubts about the bearish direction even though the day closes ator near its low. The next day shows us a significantly higher gap in the opening. After the opening, however,prices again go down closing at a new low. This last day may be interpreted as a good chance for the shortsellers to cover their short positions.Important Factors:The reliability of this pattern is very high, but still a confirmation in the form of a white candlestick with ahigher close or a gap-up is suggested.
MEDIUM RELIABILITYBULLISH DRAGONFLY DOJIDefinition: The Bullish Dragonfly Doji Pattern is a single candlestick pattern that occurs at the bottom of atrend or during a downtrend. The Bullish Dragonfly Doji Pattern is very similar to the Bullish HammerPattern
Candlestick charts display the open, high, low, and closing prices in a format similar to a modern-day bar-chart, but in a manner that extenuates the relationship between the opening and closing prices. Candlestick charts are simply a new way of looking at prices, they don't involve any calculations. Each candlestick represents one period (e.g., day) of data. The figure below displays the .