Transcription
CONTENTSACKNOWLEDGMENTS .viABSTRACT .11INTRODUCTION .21.1 Fuel Cycle Analysis .1.2 Fuel Cycle Analysis of Renewable Natural Gas .1.3 Scope .346FUEL CYCLE ANALYSIS OF RENEWABLE NATURAL GAS FROMANAEROBIC DIGESTION OF ANIMAL WASTE .822.12.22.32.42.5Biogas Production in AD Pathways and Reference Case .Animal Waste Transportation and Operation of Anaerobic Digester .Application of AD Residue to Soil .Biogas Processing for RNG Production .RNG Compression, Liquefaction, Transportation, Distribution andVehicle Use .9111315RESULTS .173.1 Energy and GHG Emissions per MJ .3.2 Energy and GHG Emissions per Mile .3.3 Sensitivity Analysis .1822254CONCLUSIONS.275REFERENCES .29316FIGURES1Stages in a CNG Pathway .42Carbon Cycle of Anaerobic Digestion-Based RNG from Animal Waste.43Disposition of Animal Waste .64System Boundary of Renewable Gas Production from AD of Animal Waste .85Carbon Left in Soil After AD Residue is Applied to Soil .14iii
FIGURES (CONT.)6WTW Total Energy Use for AD-Based RNG Pathways Compared toConventional NG, Gasoline and Diesel Pathways .19WTW Fossil Fuel Use for AD-Based RNG Pathways Compared toConventional NG, Gasoline and Diesel Pathways .19WTW GHG Emissions for AD-Based RNG Pathways Compared toConventional NG, Gasoline and Diesel Pathways .20GHG Emissions from Renewable CNG, Fossil CNG and PetroleumGasoline Pathways .2110 Disposition of Carbon from Animal Waste in AD Gas Pathways andthe Reference Case .2211 WTW Total Energy Use for AD-Based RNG Pathways Compared toConventional NG, Gasoline and Diesel Pathways .2312 WTW Fossil Fuel Use for AD-Based RNG Pathways Compared toConventional NG, Gasoline, and Diesel Pathways .2313 WTW GHG Emissions for AD-Based RNG Pathways Compared toConventional NG, Gasoline and Diesel Pathways .2414 Sensitivity of GHG Emissions from AD-Based Renewable CNG Pathways .26789TABLES1“New” RNG Pathways and Reference-Case Parameters in the GREET Model .72Manure Share and Methane Conversion Factor of Manure Management Systems.103Operational Anaerobic Digesters and Methane Reduction by LivestockType and Biogas End Use in the United States .104Methane Conversion Factors of Anaerobic Digesters .115Characteristics of Manure .126Process Heat and Electricity Inputs for Anaerobic Digesters of Manure .13iv
TABLES (CONT.)7Direct and Indirect N2O Emission Factors and Indirect N2O Loss Factors .158Key Parametric Assumptions .179WTW Results for AD-Biased Renewable CNG Pathways Compared toConventional CNG and Gasoline Pathways .2010 WTW Results for AD-Based Renewable LNG Pathways Compared toConventional LNG and Diesel Pathways .2111 WTW Results for AD-Based Renewable CNG Pathways Compared toConventional CNG and Gasoline Pathways .2412 WTW Results for AD-Based Renewable LNG Pathways Compared toConventional LNG and Diesel Pathways .25v
ACKNOWLEDGMENTSThe authors gratefully acknowledge Dennis Smith, National Clean Cities Director andVehicle Technologies Deployment Manager at the U.S. Department of Energy, who supported thiseffort. We also acknowledge Edward Frank, Anant Vyas, and Amgad Elgowainy of Argonne’sCenter for Transportation Research for providing their time and expertise to analyze and interpretdata and advise us of its strengths and limitations, as well as our three technical reviewers:Jim Wegrzyn of Brookhaven National Laboratory, Jim Jensen of Washington State University, andGary Radloff of the Wisconsin Bioenergy Initiative. We sincerely appreciate the time, insight, andexpertise they contributed to this effort.vi
1WASTE-TO-WHEEL ANALYSIS OF ANAEROBIC-DIGESTION-BASEDRENEWABLE NATURAL GAS PATHWAYS WITH THE GREET MODELJeongwoo Han, Marianne Mintz, and Michael WangABSTRACTIn 2009, manure management accounted for 2,356 Gg or 107 billionstandard cubic ft of methane (CH4) emissions in the United States, equivalent to0.5% of U.S. natural gas (NG) consumption. Owing to the high global warmingpotential of methane, capturing and utilizing this methane source could reducegreenhouse gas (GHG) emissions. The extent of that reduction depends on severalfactors—most notably, how much of this manure-based methane can be captured,how much GHG is produced in the course of converting it to vehicular fuel, andhow much GHG was produced by the fossil fuel it might displace.A life-cycle analysis was conducted to quantify these factors and, in sodoing, assess the impact of converting methane from animal manure intorenewable NG (RNG) and utilizing the gas in vehicles. Several manure-basedRNG pathways were characterized in the GREET (Greenhouse gases, RegulatedEmissions, and Energy use in Transportation) model, and their fuel-cycle energyuse and GHG emissions were compared to petroleum-based pathways as well asto conventional fossil NG pathways. Results show that despite increased totalenergy use, both fossil fuel use and GHG emissions decline for most RNGpathways as compared with fossil NG and petroleum. However, GHG emissionsfor RNG pathways are highly dependent on the specifics of the reference case, aswell as on the process energy emissions and methane conversion factors assumedfor the RNG pathways. The most critical factors are the share of flaredcontrollable CH4 and the quantity of CH4 lost during NG extraction in thereference case, the magnitude of N2O lost in the anaerobic digestion (AD) processand in AD residue, and the amount of carbon sequestered in AD residue. In manycases, data for these parameters are limited and uncertain. Therefore, moreresearch is needed to gain a better understanding of the range and magnitude ofenvironmental benefits from converting animal manure to RNG via AD.
21 INTRODUCTIONIn 2009, the United States consumed 23.4 quadrillion Btu of natural gas (NG) for energy,equivalent to 25% of total primary energy consumption, according to the U.S. EnergyInformation Administration (U.S. EIA, 2011). In the process, 1,221 million metric tons (MMT)of carbon dioxide equivalent (CO2e) were released to the atmosphere, accounting for 22.6% ofU.S. greenhouse gas (GHG) emissions from energy consumption (U.S. EIA, 2011). In additionto its use as a fuel for boilers and other combustion equipment, NG is also used as a feedstock inthe production of ammonia, plastics and other products, as a dehumidifier or desiccant, and forvarious other industrial processes. Although GHG emissions are also produced from these uses,they are at a much lower level (e.g., 0.01 MMT in ammonia production, according to theU.S. Environmental Protection Agency [U.S. EPA], 2011b).While most of the NG consumed in the United States is from conventional wells locatedin North America, an increasing portion comes from shale deposits, coal beds and otherunconventional sources. The shift to these unconventional sources of fossil NG has raised anumber of environmental concerns, including the effect of effluent discharges from productionfluids on groundwater and the potential for increased GHG emissions.Newly revised results obtained with the Greenhouse gases, Regulated Emissions, andEnergy use in Transportation (GREET) model show less relative advantage for fossil NG ascompared with conventional gasoline in vehicular applications. This is primarily because ofupward revisions to EPA’s methane leakage and venting assumptions for conventional gasproduction. Renewable NG or RNG (also known as biogas, landfill gas [LFG] or digester gas)typically contains 50% or more methane and is itself a significant source of GHG emissions thatmay be released to the atmosphere—either as a mixture of methane (CH4), CO2 and other gases,or as the CO2 combustion product from the flaring of those gases. EPA estimates that in 2009over 190 MMT of CO2e emissions came from landfills, animal manure and wastewater treatment(WWT) facilities (U.S. EPA, 2011b), while another 98 MMT and 16 MMT, respectively, wereavoided by LFG-to-energy and manure biogas recovery projects (U.S. EPA, 2011b, 2011c). Byavoiding the release of CH4 and instead recovering and using the RNG in vehicles, very largereductions in GHG emissions can be realized relative to petroleum gasoline.At present, there is no generally accepted estimate of the potential RNG resource base,although several sources have investigated portions of it (QSS Group Inc., 1998; Milbrandt, 2005;Saber and Takach, 2009). Hamberg (2011) reports that in the 2035 2050 timeframe, RNGproduction could reach 4.84 tcf, with 0.54 tcf coming from LFG, municipal wastewater, andlivestock manures.1.The RNG potential from the anaerobic digestion (AD) of food waste ishighly speculative. Assuming that it could double production from municipal wastewater andlivestock manures, the resulting renewable gas resource base (excluding gasification) could be1The bulk of the 4.84 tcf comes from the gasification of energy crops, agricultural waste, and other waste.Although the 0.5 tcf from anaerobic digestion does not explicitly include food waste, some may be included as aco-digestate. More complete estimates are currently under development and may be available later in 2011.
30.74 tcf per year, which is comparable to the American Gas Foundation (2011) estimate of0.34 0.87 tcf per year.Although the resource base may be limited, an understanding of RNG pathways and theirGHG reduction potential has important policy implications. Because it is chemically identical tofossil NG yet produces far fewer GHG emissions, the blending of relatively small quantities ofRNG with fossil gas can provide significant GHG benefits. For example, our previous analysis ofcompressed NG (CNG) and liquefied NG (LNG) from LFG showed 77–101% reductions inGHG emissions as compared with petroleum gasoline (Mintz et al., 2010). Even blends of 20%RNG and 80% fossil NG were found to yield reductions of 30% or more (Mintz and Han, 2011).In those analyses, individual pathways differentiated by the source of process electricity and themethod of distributing the CNG/LNG produced substantially different results. Likewise, formanure-based pathways, reductions in GHG emissions and fossil fuel use are likely to differ byfeedstock and pathway because collection, composition, conversion and purification processesdiffer by type of manure as well as by climate, the composition of digester residue and the fate ofthat residue. Thus, typical pathways must be defined and analyzed on a life-cycle basis, andcompared using a tool like GREET.1.1 FUEL CYCLE ANALYSISUnderstanding the impacts of a fuel on energy use and emissions requires life-cycleanalysis (LCA), a systematic accounting of the energy use and emissions at every stage of thefuel’s production and use. The stages included in LCA are raw-material acquisition,transportation and processing and product manufacturing, distribution, use and disposal orrecycling. LCA of a fuel is also called fuel-cycle analysis. A fuel cycle typically includesfeedstock recovery and transportation, fuel production, transportation and distribution, andcombustion as an end use. For example, as shown in Figure 1, a CNG pathway for today’s CNGfueled vehicles includes stages corresponding to gas exploration and recovery, gas venting andflaring and NG upgrading and compression, as well as stages accounting for non-NG inputs likepetroleum, coal, and renewables. The stages from exploration and recovery (well) totransportation and distribution (pump) are collectively called well-to-pump (WTP), while the laststage, corresponding to combustion by an internal combustion engine (ICE), is called pump-towheel (PTW). The entire pathway is known as well-to-wheel or, in the case of RNG, waste-towheel (WTW). In other words, WTW is a term specific to a fuel-cycle analysis of transportationfuel, and a WTW analysis is a LCA of transportation fuels.To conduct fuel-cycle analyses, Argonne National Laboratory has developed andcontinuously updated the GREET model. Since 1995, GREET improvements have beensupported with funding from several programs within DOE’s Office of Energy Efficiency andRenewable Energy. Developed in Microsoft Excel with a graphical user interface, GREET isstructured to systematically account for a range of potential feedstocks, fuels and conversionprocesses for any defined WTW pathway. GREET calculates emissions of three GHGs (CO2,CH4 and N2O) and six criteria pollutants (VOCs, CO, NOx, SOx, PM10 and PM2.5), andconsumption of each of the following: total energy, fossil fuel, petroleum, NG, and coal.
4EnergyEnergy SourcesSourcesCoalCoalExploration andRecoveryNaturalNatural GasGasOilOilEmissionsEmissions toto WaterWaterandand LandLandNatural GasTransport andDistributionNatural GasProcessingEmissionsEmissions toto Air,Air,includingincluding COCO22RenewablesRenewablesCompressedNatural GasCombustionNatural GasCompressionNaturalNatural GasGasFIGURE 1 Stages in a CNG PathwayDownloadable at http://greet.es.anl.gov/, GREET currently has more than 15,000 registered usersworldwide from academia, industry and government.1.2 FUEL CYCLE ANALYSIS OF RENEWABLE NATURAL GASFigure 2 illustrates the carbon cycle corresponding to RNG produced from the AD ofanimal waste. Currently, manure management systems treat most animal waste, recovering someenergy in the form of a nutrient-rich residue but typically not producing energy. With AD, RNGalso can be produced from animal waste and used to fuel vehicles or generate electricity.C in AirC in PlantC in Emissions(CO2, CO, VOC, CH4)C in Emissions(CO2, CO, VOC, CH4)C in AnimalWasteCurrent ManureManagementC in SoilRenewable NGProductionC in RenewableNatural GasRenewable NGCombustionC in SoilFIGURE 2 Carbon Cycle of Anaerobic Digestion-Based RNG from AnimalWaste
5This study examines the fuel cycle of animal waste conversion to CNG and LNG vehiclefuels. As compared with fossil NG (shown in Figure 1), WTW analysis of RNG is morecomplicated, since it must account for energy use and emissions in a reference or base case aswell as in a “new” pathway (i.e., conversion of AD gas to RNG and its use in vehicles). Unlikefossil fuels, where no fossil carbon-associated emissions occur if the fuel stays in the ground,renewable fuels involve a recycling of carbon and emissions in both a reference case and a “new”pathway that is being modeled. The reference-case pathway consumes energy and generatesemissions in the absence of conversion to vehicular fuel. These reference-case emissions must besubtracted from emissions that occur in the “new” pathway being modeled. Portions (or stages)of the reference and “new” pathway that are unchanged can be ignored, since they do not affectthe calculation.Constructing an appropriate reference case for RNG pathways is further complicated bycurrent and future diversity in manure management systems and energy recovery. For example,only 167 of the more than 2 million farms in the United States currently recover AD-based RNGto produce electricity for on-site consumption or export to the grid, a handful produce pipelinequality gas for injection to the natural gas system, and only one farm currently produces NG as avehicle fuel from animal waste because of the technical and financial difficulties of producingand injecting RNG into a NG pipeline (U.S. EPA, 2011a).2 Even if AD gas-based CNG/LNG forvehicle fuels is not developed in the future, the number of farms producing electricity from ADgas could increase as illustrated by the solid blue line in Figure 3. Thus, if AD gas-basedCNG/LNG were introduced as a transport fuel, the reference-case feedstock for the CNG/LNGwould include not only the animal waste traditionally treated by manure management (the palered area in the figure) but also animal waste that is converted to electricity (the pale blue area inthe figure). Therefore, following the introduction of AD gas-based CNG/LNG, the share ofanimal waste for electricity generation with AD gas-based CNG/LNG would be smaller than thatwithout AD gas-based CNG/LNG.Either marginal analysis or energy allocation can be applied to deal with this issue. Inmarginal analysis, the reference case is assumed to include a mix of animal waste disposaloptions with some waste treated by conventional manure management and some converted toelectricity, with the actual share illustrated by the solid blue line in Figure 3 and the amount ofanimal waste that otherwise would generate electricity noted as A in the figure. If “A” were to beused for RNG, then conventional fuel (such as fossil NG) would be needed to replace theelectricity that otherwise would be produced from animal waste. This fuel should be added to thecalculation for the RNG pathway. However, the size of “A” is difficult to measure. Moreover, itdepends on various factors (such as policy incentives, regulation, relative NG and electricityprices, and technology development) that change over time. Thus, estimating the mix ofsupplemental electricity generation is highly uncertain.2Another, Fair Oaks Dairy, is expected to begin production by the end of 2011.
6Shares of manure for each end useShares of manure for each end useCurrent manure managementACurrentmanuremanagementRecoveredto RNGfrom otherwisecurrent reotherwiseotherwisecurrentmanagementrecovered to electricityRecoveredfrom manureRecoveredtotoRNGelectricityotherwise recovered to electricityRecoveredto electricityManure sharew/o AD-based RNGdevelopedManureManuresharesharew/ow/ AD-basedAD-based RNGRNGdevelopeddevelopedManure share w/ AD-based RNGdeveloped0.0%0.0%2011FutureFIGURE 3 Disposition of Animal WasteOn the other hand, using the energy allocation approach, the reference case is consideredto be simply traditional manure management and both CNG/LNG and electricity are consideredto be products of the “new” pathway. Then, energy and emissions associated with the avoidedemissions from manure management can be allocated to LFG-based electricity and RNG by theirrespective energy shares. Since energy allocation does not require uncertain projections(e.g., future shares of waste-to-electricity conversion and the marginal supplies used to offsetwaste-to-electricity conversion displaced by RNG conversion), this study uses that approach.Once WTW results for a given fuel pathway are estimated, they should be compared withthose for baseline or reference-case pathways that the examined fuel may displace. Since CNG isexpected to be used primarily in light-duty vehicles (LDVs), the baseline pathway for CNGshould be petroleum gasoline, which is used widely for passenger cars in the United States.Similarly, since LNG is expected to be used in heavy-duty vehicles (HDVs), the baselinepathway for LNG should be petroleum diesel. Table 1 summarizes some of the parameters of“new” and reference-case AD gas-, LFG- and fossil NG-to-CNG/LNG pathways.1.3 SCOPEThis report summarizes WTW analyses of RNG produced from the AD of animal waste.It describes the pathways, feedstock characteristics, conversion processes and efficiencies, coproducts and indirect emissions assumed for the analysis and presents results.The report is organized into four sections. Following this introduction, Section 2describes the RNG pathways, their key stages and important features of the fuel cycle analysis.In Sections 3 and 4, estimates of WTW energy use and GHG emissions are presented andconclusions are discussed.
7TABLE 1 “New” RNG Pathways and Reference-Case Parameters in the GREET ModelRNG (“New”)Pathway and FuelAD gas-based CNGAD gas-based LNGLFG-based CNGLFG-based LNGFossil CNGFossil LNG1Reference Case of Feedstock and Fuel DisplacedCurrent manure management1Current manure management1Flaring LFG1Flaring LFG1No activityNo activityPetroleum gasolinePetroleum dieselPetroleum gasolinePetroleum dieselPetroleum gasolinePetroleum dieselWith the energy allocation methodology, the reference case does not include competing pathways(e.g., electricity generation from AD gas or LFG).
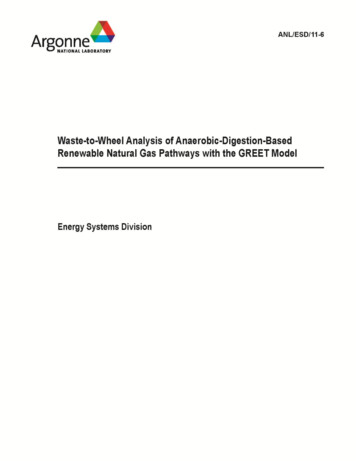
82 FUEL CYCLE ANALYSIS OF RENEWABLE NATURAL GAS FROM ANAEROBICDIGESTION OF ANIMAL WASTEFigure 4 shows the system boundary of RNG pathways from animal waste. The systembegins with collected animal waste because waste is collected in both the reference case (currentmanure management) and the “new” AD cases. In the latter, collected waste is transported to anAD facility where biogas and AD residue are produced. Some biogas is combusted to produceelectricity and heat for the digestion process, biogas cleanup, and on-site liquefaction, while therest is purified to produce commercial-grade NG. The produced NG is then either 1) transportedas a gas to off-site refueling stations, compressed to 3,600 psi and dispensed to CNG vehicles or2) liquefied on-site, transported as a liquid to off-site stations, and dispensed to LNG vehicles.3CEmissionsCarbon SequestrationCO2 EmissionsP,KCurrent ManureManagementResidueSoil ApplicationNSoil ApplicationAnimal WasteTransportationAnaerobicDigestionN2O and NOx EmissionsCCarbon SequestrationP,KDisplacement of Synthetic FertilizersNBiogasNGProductionN2O and NOx EmissionsNGTransportation& DistributionLiquefactionHeatReference CaseCO2 EmissionsAD ResidueAnimalWasteDisplacement of Synthetic FertilizersInternalElectricityGeneration ElectricityCompressionTransportation& DistributionLight Duty VehicleOperationHeavy DutyTruck OperationFIGURE 4 System Boundary of Renewable Gas Production from AD of Animal WasteThe liquid AD residue from the digestion process contains significant quantities of N, Pand K. It is transported off-site and applied to soil to displace synthetic fertilizers. The solidportion of the residue may be recycled for animal bedding or as a soil amendment, but this is notconsidered in our analysis.3Alternatively, the gas could be injected into a pipeline and liquefied off-site. This pathway is not modeledexplicitly in GREET.
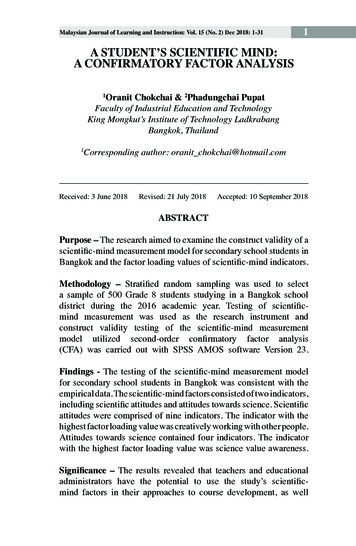
92.1 BIOGAS PRODUCTION IN AD PATHWAYS AND REFERENCE CASEUnlike the LFG pathways already contained in GREET (see Mintz et al., 2010), ADpathways include the bio-methane production step and soil application of AD residue. Therefore,the amount of bio-methane produced is important and can be estimated for a given livestock typeas follows:where CH4,Manure is the amount of CH4 produced in ft3/lb of volatile solid (VS), B0 is themaximum methane-producing capacity for manure of a given livestock type in ft3/lb of VS,MCFS,k is the methane conversion factor (MCF) for each manure management technology S byclimate region k in %, and MSS,k is the manure share (MS) handled by manure managementtechnology S by climate region k (IPCC, 2007). B0 depends on species and diet; the MCF ofconventional manure management varies by technology and climate while the MCF of anaerobicdigesters depends on technology, residence time and temperature.The energy use and emissions associated with current manure management should betaken as a credit, which depends not only on the manure management system but also on climate,livestock species and diet. IPCC provides recommended values for B0 and MS for nine regions(i.e. North America, Latin America, Western Europe, Eastern Europe, Oceania, Africa, MiddleEast, Asia, and Indian Subcontinent) and MCFs for a range of annual average temperatures from10 C to 28 C (IPCC, 2007). The U.S. EPA summarizes B0 for livestock in the United States fromvarious sources in the literature, and estimates MS for manure management systems used in theUnited States by state (U.S. EPA, 2011a). EPA also estimates MCFs of wet (e.g. anaerobiclagoon, liquid slurry and deep pit) and dry (e.g. daily spread and pasture) manure managementsystems for cool, temperate and warm climate zones. EPA uses the same climate zone definitionsas the IPCC (i.e., cool climate zone: 10–14 C, temperate climate zone: 15–25 C and warmclimate zone: 26–28 C) and annual average temperatures reported by the U.S. National Oceanicand Atmospheric Administration (NOAA, 2011). Average MS and MCF values for theUnited States as a whole are obtained using the livestock population from the U.S. Departmentof Agriculture (USDA, 2011). All data available from IPCC, EPA, NOAA and USDA areincluded in GREET. For this study, we use average U.S. values for dairies as reported by U.S.EPA and USDA, and conduct sensitivity analyses using data for California and Wisconsin, thetwo states with the largest dairy populations. Table 2 summarizes average MSs and MCFs for theUnited States, California, and Wisconsin. Note that in Wisconsin, solid storage is used for alarger share and anaerobic lagoons for a smaller share of manure than in the United States as awhole, while in California more than 50% of manure is treated by anaerobic lagoon. B0 for dairycows is 0.24 m3 CH4/kg of VS (USDA, 2011).According to EPA’s AgSTAR Program, 167 farm-based AD projects are currentlyrecovering energy in the United States, reducing CH4 emissions by 1.1 Tg CO2e, as shown inTable 3 TABLE 3(U.S. EPA, 2011b). Despite this reduction, EPA estimates that total methaneemissions from manure management in the United States were still 49.5 Tg CO2e in 2009, whichis significant compared to other sectors (U.S. EPA, 2011a). For example, in 2009, NG systems in
10the United States generated 130.3, 17.5, 44.4 and 29.0 Tg CO2e emissions from field production,processing, transmission, and storage and distribution, respectively. Owing to increasingconcerns about global warming, manure management systems are expected to capture or flare anincreasing share of CH4 from manure. Therefore, we assume that CH4 from all manuremanagement systems except pasture and daily spread will be flared, and provide a sensitivityanalysis for the share of flared CH4 from current manure management (see Sec. 3.3). Pasture anddaily spread are excluded from this assumption because of the difficulty in collecting CH4 fromland application.TABLE 2 Manure Share (MS) and Methane Conversion Factor (MCF) of Manure ManagementSystemsWasteManagementSystemPastureMS by system and locationU.S. Average7%California1%Wisconsin7%MCF by system and locationU.S. .6%4.0%2.0%28.6%35%22%69.9%75%66%28.6%35%22%TABLE 3 Operational Anaerobic Digesters and Methane Reduction by Livestock Type and BiogasEnd Use in the United StatesHeatElectricityCogenerationVehicle FuelPipeline NGFlaredNot SpecifiedTotalDairyBeefSwinePoultryMethaneNo. ofReductionProjects (Gg CO2e/yr)MethaneNo. ofReductionProjects (Gg CO2e/yr)MethaneNo. ofReductionProjects (Gg CO2e/yr)MethaneNo. ofReductionProjects (Gg 778410220232.2152.75223177230517
11MCFs for AD pathways are estimated from EPA’s AgStar project database (U.S. EPA,2011b). From a consideration of 92 projects without co-digestion among the 137 active dairyprojects in the United States, total CH4 emissions
Vehicle Technologies Deployment Manager at the U.S. Department of Energy, who supported this effort. We also acknowledge Edward Frank, Anant Vyas, and Amgad Elgowainy of Argonne's . and in AD residue, and the amount of carbon sequestered in AD residue. In many . avoided by LFG-to-energy and manure biogas recovery projects (U.S. EPA, 2011b .