Transcription
Axway SoftwareInvestor PresentationOctober 2019
Forward-looking statements This presentation contains forecasts that may be subject to various risks and uncertaintiesconcerning the company’s future growth and profitability. The Group highlights that signatures oflicense contracts, which often represent investments for clients, are historically more significant in thesecond half of the year and may therefore have a more or less favorable impact on full-yearperformance. Furthermore, activity during the year and/or actual results may differ from those described in thisdocument as a result of a number of risks and uncertainties set out in the 2018 RegistrationDocument filed with the French Financial Markets Authority (Autorité des Marchés Financiers, AMF)on April 26, 2019 under number D.19-0404. The distribution of this document in certain countries may be subject to prevailing laws andregulations. Natural persons present in these countries and in which this document is disseminated,published or distributed, should obtain information about such restrictions and comply with them.2
Investor Presentation – October 2019Content1 - Company overview2 - Market overview3 - Update on the transformation project4 - H1 & Q3 2019 Highlights & Performance5 - Targets & Ambitions6 - Appendices3
Company Overview
Axway at a glanceA long-standing specialist in Middleware marketsand the 5th largest software publisher in France*,Axway develops, distributes, integrates andmaintains its own infrastructure solutions toenable optimized data flow governance in themost complex organizations.Euronext Paris – Compartment BBloomberg : AXW:FRReuters : AXW.PAMarket Cap (31/12/18) : 264mMain Indexes CAC Mid Small CAC TECHNOLOGY ENT TECH 40Axway solutions are deployed by over 11,000 customers spanning 100 countriesFrench-American dual nationality Headquartered in Phoenix, AZ – USA Listed on Euronext Paris (France)17 Locations worldwide1,850 employees – 680 in R&DFigures as of 31/12/201823%ServicesLicenseRest of Europe29%14%Subscription2018 Revenue : 283,8mProfit on Operating Activities : 11.2%Free Cash Flow / Revenue : 6.2%Balance sheet and debt capacity to seizestrategic acquisition 64% recurring revenue5%Asia - Pacific2018Revenue43%Americas71% of revenue generated outside FranceMain vertical markets: Financial Services / Manufacturing - Retail - Transport / Public Sector* Source Top 250 EY – Syntec Numérique 20185
A balanced history of organic and external growth2016300250Acquistion’s Strategic Rationale2012 Customer Position20192014Businessmodeltransition Technology / Know-how200 m20172008150200620071002002500Incubationwithin Sopra1985 - 2000B2B and Integration2001 - 2005CollaborativeBusiness Solutions2006 - 2009Network ofprofessionalinteractionsMFT market leader2010 - 2012Governingthe flow of dataAxway 5 Suite2013 - 2015Becoming a leader inHybrid Integration Platforms2016 - Today6
Axway enables business to leverage changeData ker2002458Minternet users(7.6% world)2006GoesliveAutomatingsupply chains20072008EngagementSecuring filetransfer2011Apple iPhone changessmartphone marketProtecting SOA andservices through APIs201220132014Increasingbusiness visibility20152016Unifying 01.86Bsmartphone users4.17Binternet users(54.6% world)15B connected IoTdevices2.8Bsmartphone users28B connectedIoT devices7
Axway PartnersCloud ProvidersGlobal SystemIntegratorsDigital SolutionProvidersResellers8
Axway’s historical performance300Profit on Operating ActivitiesRevenue250 3237.51501005035.335.037.539.744.50Total GrowthOrganic GrowthMargin on Operating Activities20112012201320142015201620172018 4.2% 5.7%16.3% 3.3%-1.6%15.6% 5.9% 3.7%15.8% 10.1% 3.6%15.2% 8.8% 0.0%15.6% 5.8% 4.4%16.9%-0.4%-3.8%13.5%-5.3%-3.6%11.2%9
Axway’s historical net profit & dividend40Net 0.400,500.400,400,400.352015 m250,6031.50,300.250.2011.0104.450,100Payout Ratio 21%29%23%31%30%27%95%77%10
A shareholding structure backing the corporate projectSopra es outstanding32.57%Voting rights36.09%Shareholders’ agreement56.92% of shares outstanding / 65.31% of voting rights21,225,381 Shares outstanding34,712,232 Voting rightsFigures as of 31/08/201911
Axway’s Corporate Social Responsibility2018 Initiatives & Labels Member of theUN Global Compact Awarded SilverEcovadis CSR Label Selected for the Gaïa Index Reinforced Ethics Charter& Alert SystemGovernanceHuman ResourcesBoard of Directors:- 57% independent- 43% of women- 95% attendance rateAxway University:- 36K Hours of training formore than 1,250 AxwegiansEnvironment- Promotingeco-responsible practices- Measures to take account ofenvironmental issues andcarry out evaluations orcertification proceduresAxway’s CSR Report available at Investors.axway.com12
Market Overview
Axway’s market in the Software industry[ Enterprise Software Market ]estimated at 417 billion in 2019*Application DevelopmentApplication Infrastructure and MiddlewareApplication SoftwareMarketestimated at 209 billion in 2019*Infrastructure SoftwareMarketData Integration Tools and Data Quality Toolsestimated at 208 billion in 2019*Master Data Management ProductsDatabase Management SystemsIT OperationsOperating SystemsAn estimated 18.9Bmarket for Axway**Other Infrastructure SoftwareSecurityStorage ManagementVirtualisation Infrastructure Software* Source Gartner / ** Source Axway14
Axway’s historical Middleware market AAABPM / BAMDataIntegration(ETL, MDM, )MFTB2BEFSSApplicationIntegration(ESB, MOM, )IntegrationBrokerage(VAN ), iPaaSIntegrationMiddlewareSOA Governance / API ManagementAAA15
and its digital evolution sEnd-UsersCustomer Experience Economy16
Axway’s purpose remains the sameWe moved and integrated data securely for businesses It is the foundation of what we doWe will still move, integrate and expose data securelyfor businessesNEWWAYAxway's mission remains the same, we are merely implementing our market strategy:Become a leader in Hybrid Integration Platforms17
2019 Market Forecast and 2019-2022 CAGRTotal market estimated at 18.9 billion in 2019 / Average CAGR 2019-2022 estimated at 11.2%18
Competitive landscapeIntegrationEngagementthe samethe sameIaaS19
Evolution of practices in a Subscription worldSequences of a perpetual License offeringPURCHASESALEIMPLEMENTSUPPORTCycle of a Subscription offeringSUBSCRIPTIONRENEWIT FocusBusiness FocusCustomer AcquisitionCustomer GrowthUpfront RevenueLifetime RevenueEpisodic engagementContinuous engagementReactive supportProactive ValueImplementation servicesCustomer OutcomesTry & Buy / Sales20
Update on thetransformation project
Transformation projectUpgrading the product portfolioStrengthening the management team and engaging employeesImplementing a structure adapted to changes in the business modelIncreasing awareness and sustaining a growth dynamic In Progress22
AMPLIFY : 15 years of strategic evolution2006SECURELY MOVING AND INTEGRATING DATA2008BUSINESS CONTEXT2013DATA OPENESS2017 CUSTOMER CENTRICITYAMPLIFY 202023
Axway’s solutions evolutionSpecialised productsAMPLIFY ProductsApp DevTrack &TraceB2B / yticsIT ntentCollaboration24
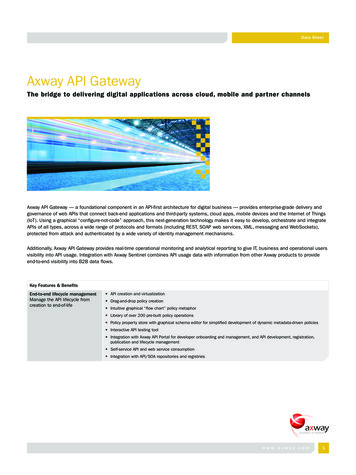
AMPLIFY : Continued investments, Strengthened offerAllocation of R&D resources (%)AMPLIFY Investments100%up 80%49 % in H1 2019 vs. H2 2017 Launch of the new AMPLIFY components at the endof March 201960%40%555561626366706920% Integration of Streamdata.io and launch ofAMPLIFY Streams in June 2019 Investments in MFT and API assets to maximize thecapabilities of the HIP platform Strengthening of the HIP and UX in progress0%Q3 2017 Q4 2017 Q1 2018 Q2 2018 Q3 2018 Q4 2018 Q1 2019 Q2 2019AMPLIFYMaintenanceOthers25
AMPLIFY : Continued investments, Strengthened offer sinceApril 2019Unified Catalogfor multiple integration patterns26
AMPLIFY : Setting the standard for HIPEndpointsCRMsCloud ServicesAMPLIFY ProductsApp DevelopmentB2B / EDIMFTGeneral LedgersAnalyticsLegacy Systemsetc.API ManagementContent Collaboration27
Better TogetherStrengthened management team-Appointment of D. Fougerat, EVP Human Resources and C. Allmacher, Chief Financial Officer-Entry into function of 3 new business leaders in Europe, the United States and the Asia-Pacific region-Creation of a dedicated Go-to-Market team, supported by product experts, under the responsibility of Paul French,newly hired EVP, Go-to-MarketRenewed employee engagement-Training and enablement through Axway University 2.0-Quarterly satisfaction surveys and enhanced dialogue with the management team-Implementation of a free share grant plan for all employees with a vesting date of 2022 Attrition down 33% in H1 2019 compared to H1 2018”Make Axway the place to be”28
Customer Success OrganisationObjectives Help customers accelerate theirtransformation through rapidresults Allow incremental AMPLIFY serviceconsumption Facilitate and accelerate thetransition to the Subscription modelCustomer Centric Bring together and align all playersinteracting with customers Optimize the Acquisition, Adoption,Expansion and Renewal cycle Making the customer experience adifferentiatorOrganisation Creation of the Customer SuccessManager function to supportcustomers throughout their lifecycle Proximity to customers withregional General Management29
Customer Success Organisation – H1 2019 evolutionOrganisationNew Regional Leadership Asia-Pacific (January 2019) USA (April 2019) Europe (July 2019)Customer SuccessGo-To-MarketEvolve our Customer SuccessManagement TeamStrengthen Go-To-Marketleadership, processes and focus: Accelerate our CustomerSuccess Management practices API First approach Grow and expand Inside Sales Evangelization API GM / EVP Go-To-Market30
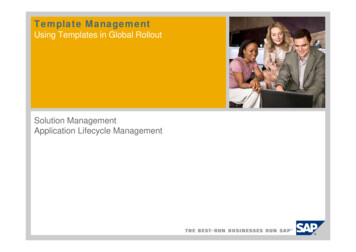
Go-To-Market – Axway Catalysts Team and OfferingsAxway CatalystsA team of trusted advisors who help customers make digital strategy, design andtechnology decisionsThought LeadershipProactive outreach and value delivery to the API Community through keynote presentations,networks of knowledge and workshop facilitationAxway AccelerateHigh-impact consulting services to enable Integration Strategy, Digital Transformation, APILifecycle Design and Continuous Delivery31
Our customers’ success is our successMission CriticalAxway Solutions at the heartof our customers’ strategicbusiness outcomesAMPLIFY Flexible solutions to secureand transform criticalbusiness processes whileprotecting past investmentCustomer CentricServing our customers as avalued, strategic partner“From Start to Forever”32
H1 & Q3 2019Highlights & Performance
H1 2019
2019 Half-Year - Revenue by ActivityH1 2019H1 2018Restated*H1 .5-4.3%-6.8%Axway138.6138.9134.92.7%-0.2%[ m]16 %License15 %Services17 %Subscription52 %Maintenance69% Recurring revenuevs. 61.0% in H1 2018* Alternative performance measures are defined in the glossary at the end of this document Significant growth in Subscription revenueResilience of the Maintenance activityDecrease in License and Services activitiesIncrease of 8 points in the Group's share of recurring revenues to 69% of total revenue35
2019 Half-Year - Income StatementIn millions of eurosRevenueCost of salesGross Profit ( % of Revenue)Operating expensesof which Sales and marketingof which Research and developmentof which General and administrativeProfit on operating activitiesProfit from recurring operationsOperating profitIncome taxesNet profit ( % of Revenue)Basic earnings per share (in )H1 .1-0.2966.8%1.8%-1.9%-2.1%-4.4%H1 0.1868.3%9.1%5.8%3.7%2.9% Stable organic* revenue,growth of 2.7 % in total In line with budget, profit onoperating activities of 2.5m(1.8% of Rev.) due to theplanned acceleration inoperating investments Net profit of - 6.1mor - 0.29 per share* Alternative performance measures are defined in the glossary at the end of this document.36
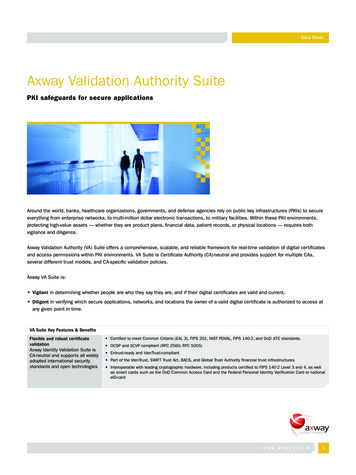
AMPLIFY : Continued investments, Strengthened offerR&D Investments ( m)32.631.2Advancing our innovation27.9 R&D investments up 22% between H1 2019 and H1 2018,stabilization and decrease expected in the coming quarters Rationalization of the portfolio and strategic priorities Significant improvement in attrition in the R&D workforce(20% decrease between H1 2019 and H1 2018)26.8H2 2017H1 2018H2 2018H1 201937
2019 Half-Year - Signatures trackingNewSignaturesValueWeightingFactorWeighted NewSignaturesLicense21.81x21.8NewSubscription (ACV*)3.53x10.6Half-year 2019 Weighted Signatures32.4Organic Growth*-15.4%[ m] New ACV down 25.5% organically Signatures metric down15.4% organically The interest generated by theGroup’s new offers, combinedwith investment effortsdedicated both to strengtheningthe sales force and marketing,should allow a gradualreacceleration in new signaturesas we move into 2020* Alternative performance measures are defined in the glossary at the end of this document38
Market Shift to Subscription Transition to subscription accelerating across allverticals and regionsTry & BuySubscription Significant increase in number of subscriptiontransactions between H1 2018 and H1 2019 Large subscription deals are taking much longer toexecute as customers “learn” new processes anddelivery modelsLANDADOPTEXPANDRENEW39
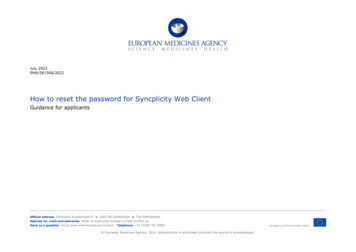
AMPLIFY API Management : Pipeline and SuccessesAPIM Pipeline trends ( m)Competitive win to drive a critical APIimplementation for a European Satellite program825857October2018January201967April2019 Sales and Marketing investment up 14%between H1 2018 and H1 2019 APIM Pipeline growth of 40%PSD2 compliance and creation of newcommercial channels for a major European bankJuly2019Extension of Axway's APIM and MFT offerings toall data movement for one of the largesthealthcare systems in the United States40
Main Balance Sheet items at 30/06/2019Cash and equivalentsDSOTotal Assets 32.3m61 days 569.5mvs. 35.8m at 31/12/2018vs. 63 days at 30/06/2018vs. 553.8m at 31/12/2018Net debtCurrent deferred revenuesTotal Equity 12.3m 85.6m 356.4mvs. 10.2m at 31/12/2018vs. 75.2m at 31/12/2018vs. 362.7m at 31/12/201841
Cash flows & Covenants at 30/06/2019In millions of eurosNet profit for the periodChange in operating working capitalrequirementsNet cash from operating activitiesFree cash flow30/06/2019-6.13.93.016.08.625.54.721.8Net cash used in investing activities-4.5-3.2Net cash from (used in) finacing activities-7.8-2.5Net change in cashand cash equivalents-3.619.4Opening cash position35.828.1Closing cash position32.147.5 Free cash flow of 4.7m at 30/06/201930/06/201931/12/201830/06/2018EBITDACost of debt45.245.2101.4Net debtEBITDA0.470.310.02Net debtEquity0.030.030.0030/06/2018(covenant 5)(covenant 3)(covenant 1) All bank debt covenants fully met Balance sheet and debt capacity to seize strategicacquisition opportunities42
Q3 & 9M2019
Q3 2019 HighlightsHighlights of the 3rd quarter 2019 Strong growth in Subscription revenue( 14.9%), in line with the roadmap Maintenance resilience (-2.2%) Significant progression in pipelinearound new AMPLIFY offers Recognition of Axway's leadership inAPI management44
9M Performance45
Targets & Ambitions
Targets & Ambitions 2019 Return to organic growth, continuing into 2020, enabling Axway to achievetargeted revenue of around 300 million 2019 Operating margin on business activity between 8 and 10%, the low point duringthe transformation period, before a rebound expected in 2020 Become a Leader in the Hybrid Integration Platform market by the end of 202047
Appendices
FY 2018
Full-Year 2018 - Income Statement2018In millions of eurosRevenueof which Licenseof which Subscriptionof which MaintenanceSubtotal License, Subscription & MaintenanceServicesCost of salesGross Profit ( % of Revenue)Operating expensesof which Sales and marketingof which Research and developmentof which General and administrativeProfit on operating activitiesProfit from recurring operationsOperating profitIncome taxesNet profit ( % of Revenue)Basic earnings per share (in 9.427.940.530.727.7-24.04.40.21 Revenue down 3.6%organically*, 2.7% atconstant exchange rates,5.3% in total70.6%13.5%10.2%9.2% Profit on operating activitiesmaintained at 11.2% throughsound cost management Net profit of 11.0 million(3.9% of revenue) or 0.52per share compared with 0.21 in 20171.5%* Alternative performance measures are defined in the glossary at the end of this document.50
Full-Year 2018 - Revenue by Activity[ .3%-3.6%50.3%Maintenance64.5% recurring revenuevs. 61.0% in 2017* Alternative performance measures are defined in the glossary at the end of this document Growth in Subscription and Resilience of MaintenanceDecline in License activity at year-endContinued strategic refocus on high value-added ServicesIncrease of 3.5 points in the Group's recurring revenues to 64.5% of total revenue51
Full-Year 2018 - Revenue by Geography[ rowth*23%29%France80.983.883.8-3.4%-3.4%Rest of 8-5.0%-1.6%Asia / 5.3%-3.6%Rest of EuropeFrance5%Asia - Pacific43%Americas71% of revenue generated outside Francestable compared to 2017* Alternative performance measures are defined in the glossary at the end of this document52
Full-Year 2018 - Advancement toward our new business model[ m]LicenseNewSubscription Signatures56.51x56.513.13x39.3Full-Year 201895.8Organic Growth* 7.8%* Alternative performance measures are defined in the glossary at the end of this document Accelerate the transitionto Subscription modelsBusiness Improve theModelCustomer life cycleClients Increase the number ofaccess points to Axwaysolutions Enable an adoption andextension strategy Platform giving accessto the various dataintegration andOfferingmovement services Hybrid architectures Signatures metric (License 3X New ACV) up 7.8% organically53
Main Balance Sheet items at 31/12/2018Cash and equivalentsDSOTotal Assets 35.8m77 days 553.8mvs. 28.1m at 31/12/2017stable vs. 31/12/2017vs. 551.1m at 31/12/2017Net debtCurrent deferred revenuesTotal Equity 10.2m 75.2m 362.7mvs. 24.1m at 31/12/2017vs. 67.3m at 31/12/2017 ( 11.8%)vs. 344.1m at 31/12/201754
Simplified Balance Sheet at 31/12/2018In millions of euros31/12/201831/12/2017AssetsGoodwillNon-current assetsTrade receivablesOther current assetsCash and cash equivalentsCurrent 228.1130.4Total Assets553.8551.1Equity and LiabilitiesEquityFinancial debt - long-term portionOther non-current liabilitiesNon-current liabilitiesFinancial debt - short-term portionDeferred RevenuesOther current liabilitiesCurrent 7.822.570.34.567.364.9136.7Total Liabilities191.1207.0Total Equity and Liabilities553.8551.1 High cash position at 35.8 million 77-day DSO, stable compared to 2017 Bank debt of 46.0 million,net debt of 10.2 million Current Deferred Revenues up 11.8%to 75.2m55
Cash flows & Covenants at 31/12/2018In millions of eurosNet profit for the periodChange in operating working capitalrequirementsNet cash from operating activitiesFree cash flowNet cash used in investing activitiesNet cash from (used in) finacing activitiesNet change in cashand cash t of debt45.240.2Net debtEBITDA0.310.47Net .617.524.3-4.0-57.5-10.76.87.6-23.6Opening cash position28.151.7Closing cash position35.828.1(covenant 5)(covenant 3)(covenant 1) Free cash flow of 17.5 million in 2018despite significant additional investment All bank debt covenants fully met Balance sheet and debt capacity to seize strategicacquisition opportunities56
Changes in equity and Earnings per share at 31/12/2018In millions of eurosEquity at Beginning of Period31/12/201831/12/2017344.1374.8Profit for the period11.04.4Dividends-4.2-8.5Capital n exchange translation adjustmentsEquity at End of PeriodIn Net profit for the periodWeighted average number of shares excluding treasury sharesBasic earnings per shareTheorical potential weighted average number of sharesDiluted earnings per share (in )31/12/2018 Distribution of a dividend of 0.40 per share submitted tothe shareholders' vote at thegeneral meeting scheduled forJune 5, 84M0.500.20 Basic earnings per share of 0.52 in 2018 compared to 0.21 the previous year57
Full-Year 2018 - 7518Rest of 839Asia - PacificAxway Recruitment stepped up significantly in the second half of 201858
Alternative Performance Measures Restated revenue: Revenue for the prior year, adjusted for the consolidation scope and exchange rates of the currentyear. Organic growth: Growth in revenue between the period under review and the prior period, restated for consolidationscope and exchange rate impacts. Growth at constant exchange rates: Growth in revenue between the period under review and the prior period restatedfor exchange rate impacts. ACV: Annual Contract Value – Annual contract value of the subscription agreement. TCV: Total Contract Value – Full value of the subscription agreement including both recurring revenues overthe contract term and one-time payments. Signature metric: Amount of License sales plus three times the annual value (3xACV) of new Subscription contractssigned over a given period. Profit on operating activities: Profit from recurring operations adjusted for the share-based payment expense for stockoptions and free shares, as well as the amortization of allocated intangible assets.59
Go-To-Market -Axway Catalysts Team and Offerings. Axway Catalysts Thought Leadership Axway Accelerate. A team of trusted advisors who help customers make digital strategy, design and technology decisions Proactive outreach and value delivery to the API Community through keynote presentations, networks of knowledge and workshop facilitation