Transcription
PARTICLE IMPACT NOISE DETECTION (PIND) COMBINESVIBRATION, SHOCK, AND ACOUSTICS FOR DETERMININGRELIABILITY OF ELECTRONIC COMPONENTSStewart J. SlykhousSpectral Dynamics, INC. - PIND Products Group804 N Twin Oaks Valley Rd., Ste. 116 , San Marcos, CA 92069(760) 761-0440 FAX (760) 761-0533Abstract: Particle Impact Noise Detection (P.I.N.D.) is a reliability screening technique thatemploys vibration, shock, and acoustics. As a requirement for MIL-STD883E, MIL-STD750,and MIL-STD39016, this test has helped the manufacturers of hermetically sealedelectronic components greatly increase the reliability of their product by eliminatingcontaminants within the cavity over the past thirty years. Recent advancements inpackaging methods have created significantly larger packages with increased weight andrequire improvements to the test equipment including advancements to the closed loopcontrol of vibration, increased dynamic range of closed loop control of shock, and theaddition of multiple crystal acoustic detection sensors. This paper will describe theseadvancements and their effects in helping the test systems to better handle the challengepresented by multi-chip modules (MCM), and Systems on Chip (SOC), and today’s’ largerhybrids circuits.INTRODUCTIONSmall contaminants inside of electronic packages that contain a cavity will move in a dynamicenvironment and locate into a position, typical the bond wires, which could short out the part for a brieftime during usage. Such a failure is critical for high dynamic stress environments and can pose asignificant integrity problem in high reliability electronics applications. As early as 1960, governmentspace organizations, electronic component manufacturers and end users employed PIND testing as anondestructive test to determine the integrity of electronic components.For the past thirty years, the PIND test with its series of mechanical shocks and vibrations has beenemployed by component manufacturers to screen electronic components. A significant trend in themodern manufacture of these components is to build larger and larger packages resulting in changingrequirements for the venerable PIND test equipment.DEFINITION OF PINDParticle Impact Noise Detection (PIND) is used to determine the integrity of electronic components by“listening” for the acoustic signals generated by impacts created by loose particles inside the cavities ofelectronic components such as transistors, integrated circuits, hybrids, diodes, relays, and switches.The PIND test simulates dynamic environments such as aircraft landings and aerospace launchings byadministering a series of mechanical shocks and vibrations to the device under test. These shocks andvibrations free particles adhering to the component cavity walls. The high frequency acoustic noise fromthe resulting impacts between the particles and the package interior are detected by a transducer onwhich the test component is mounted.ALTERNATE TESTS FOR LOOSE PARTICLE DETECTIONVibration Testing
In addition to the PIND test, there are two other procedures for conducting electrical monitoring duringvibration for particle detection. These procedures are (1) monitored vibration with power applied to thedevice, and (2) Sinusoidal vibration with mechanical shocks applied at various intervals.[3].The monitored vibration method is usually specified for testing power transistors and diodes. Thetechnique uses a sinusoidal vibration either at a fixed frequency or a swept range of continuousfrequencies. Power is applied to the device under test and a latching circuit is used to detect electricalanomalies or malfunctions in the device output functions. This test is not considered completely effectivebecause in order to be detected a particle must occupy one of many specific locations at a specific time.This is lengthy and expensive, problems that get worse as the parts increase in size.The sinusoidal vibration test is sometimes termed the autonetics test. It is similar to monitored vibrationtests except that it subjects the device under test to shocks at frequent intervals.[3]. These shocks serveto dislodge particles that may be adhering to cavity walls and allows them to freely move about the cavity.As with the monitored vibration test the sinusoidal vibration test is considered ineffective; correlation ofdata on devices identified as containing particles and the results of analysis on the devices were poor. [3].Analysis of defects that passed sinusoidal vibration tests indicated that many contained particles.Additionally, the imposed mechanical stresses are believed to generate particles. This test is alsoconsidered impractical due to high cost, limitation of available test equipment, and the time and cost ofdesigning and implementing the driving and monitoring circuitry.Radiographic MonitoringRadiographic tests can be effective in detecting large loose or affixed particles as well as manufacturingprocess deficiencies. It is inexpensive and very easily performed. Some of the draw backs of X-raytesting of electronic components include: some conductive particles are invisible to X-rays due tocomposition and size; particles smaller than 0.025 mm (0.001 in.) are not detectable and some small particles can be masked by silicon-gold die attached material.A variation on radiographic testing combined with vibration is conducted by imaging the device andmaking a radiograph. The device is then subjected to a shock and vibration environment and a secondradiograph is taken. The two exposures are compared to locate particles that have moved duringvibration.PIND TESTING HISTORYParticle impact noise detection, once known as acoustical loose particle detection (ALPD)) began toemerge in the early 1960’s with the widespread use and acceptance of transistors in applications such asmissiles and satellites.[4]. The problem of loose particles was identified when an analysis of telemetrydata from a failed satellite mission showed the cause of failure to be a short in a transistor. The cause ofthe short was due to a small conducting particle encapsulated within the device cavity.Texas Instruments began developmental work on equipment to detect loose particles insidesemiconductors in the early 1960s. Their first PIND tester consisted of a sinusoidal vibration shaker, anaccelerometer with a high output voltage, a passive low frequency filter, and an oscilloscope.[5]. In 1966,both Lockheed (Sunnyvale) and General Electric (Valley Forge) experienced problems with particulatecontamination in relays. Lockheed attempted to duplicate GE's system for PIND testing which consistedof a large vibration shaker and a very low g force. During Lockheed’s attempt problems in mountingdevices were experienced. Lockheed borrowed an ultrasonic frequency translator and used a smallershaker and the first PIND system for relays was born.[6].Around 1976, PIND testing was also used in electromechanical relays during a Delta launch vehiclecountdown.[7]. A critical part failure was traced to a loose wire and a million dollar retrofit ensued.McDonnell Douglas was contracted by NASA to update and improve the equipment system andtechnique. As a result of McDonnell Douglas’s work and the SPWG, Military Standard 883, Method 2020evolved.
A commercial mechanical PIND system was built in 1970 by Dunegan Corporation, today SpectralDynamics, Inc. This system consisted of a vibration shaker, acoustic emission transducer, high frequencyamplifier, active low noise filter, oscilloscope, and audio speaker. The system has evolved into asophisticated microprocessor based unit with software tailored to military specification requirements.The importance of PIND testing can be most dramatically illustrated with the US Space Shuttle Columbia.In November 1983, the Columbia's landing was delayed eight hours with speculation about indefinitesuspension in space because of loose particles in integrated circuits (which had not been PIND tested)that were housed in the guidance and navigation computers.[1][2]. Another example of a high visibilityPIND failure was seen during the early launches of the Trident Missile for the US Navy.MILITARY STANDARDS GOVERNING PIND TESTINGParticle impact noise detection of completely fabricated electronic components is most often employedbecause it is generally accepted as the most economic and technically the best test for a finisheddevice.[8]. This is supported by the fact that PIND testing has been incorporated into the most widelyused PIND Military Standard 883 Method 2020, Military Standard 750 Method 2052, Military Standard202F Method 217, Military Standard 39016 Appendix B and is required for Class-S microcircuits andsemiconductors.Military Standard 883C Method 2020 falls under the auspices of the Air Force and defines testing ofintegrated circuits and hybrids. Devices are tested in one of two categories; condition-A or condition-B.Components tested in condition-A are usually high reliability flying hardware type components and aretested at 20 g peak vibration at frequency ranges of 40 to 130 Hz. Components tested in condition-B areusually ground based hardware and are tested at less stringent levels of 10 g at 60 Hz.Military Standard 750C Method 2052 under the auspices of the Air Force and defines testing of discretedevices while Military Standard 202F Method 217 falls under the auspices of the US Army and definestesting of relays.INSTRUMENTATION OVERVIEWThe PIND tests are monitored with special ultrasonic sensors to “listen” to high frequency acousticsignals produced by particle impacts and convert that energy to electrical signals. The very smallelectrical signals produced by this transducer are amplified by a factor of 1,000 to increase theiramplitude for processing. Thee different methods are used for detection of impacts. They are (1) audiodetection; (2) oscilloscope (visual); and (3) threshold detection (electronic).INSTRUMENTATION SPECIFICATIONSMilitary Standard 883 Method 2020 defines the major specifications of the instrumentation (see Figure 1)used for PIND testing.The detection transducer is specified as using a nominal peak sensitivity of 77.5 dB referred to one voltper microbar. Restated in other terms, a transducer with this sensitivity produces 133 microvolts ofelectrical signal from a pressure of one microbar. The senor is used at a frequency that corresponds toone of the crystal resonances, and that resonance must lie between 150 and 160 KHz.Typically the amplifier assembly consists of a low noise preamplifier, followed by a filter to limit the noisebandwidth and a second amplifier to bring the total amplification to 1,000. In one commercial system, thepreamplifier is located on the sensor head itself. The amplifier must contribute no more internal noisethan the equivalent of a ten microvolt transducer signal.
Audio detection uses electronic circuits to shift the ultrasonic acoustic signal down to the audiblefrequency range. It is amplified and applied to either a loudspeaker or headphones. The operator listensfor the characteristic slightly musical click or click from particle impacts.Oscilloscope detection applies the amplified ultrasonic signal to the vertical axis of an oscilloscope havinga sensitivity of 20 millivolts per vertical division. Impacts appear as sinusoidal bursts having a fast risingedge and a longer (approximately exponentially decaying) trailing edge. The exact nature of theoscilloscope display depends on how the horizontal axis of the oscilloscope is driven. Military Standard883C Method 2020 allows the horizontal beam position to be a function of the shaker excitation orsemiconductor acceleration or a linear triggered sweep.Threshold detection compares the amplified ultrasonic signal to a precision threshold that is set to 5 mVabove peak system noise. When the amplifier output exceeds this threshold, it typically lights an indicatorlamp that must be manually reset.FIGURE 1. PIND Systems Block TER SIGNAL CONDITIOININGAUDIO SYSTEMPIND ELECTRONICSMOTION GENERATORAND AMPLIFIERTRANSDUCERISOLATOR ANDACCELEROMETERSHAKERNATURE OF PARTICLESIt is important to point out that particle mass, shape, size, composition and the type of device tested allhave direct bearing on whether the particle is detectable, whether the PIND test results are repeatableand whether the particle is capable of compromising device integrity.
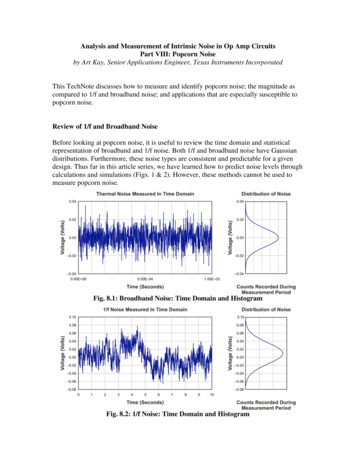
A variety of examples of contaminant loose particles have emerged from various PIND test studies.These include textile fibers, silicon splinters, gold wire, glass beads, aluminum wire, weld splatter, pottingparticles, acoustic ceiling fibers, hair, ceramic splinters and even a contact lens.In the early years of PIND testing before the advent of more sophisticated sensor devices, the first PINDsystems were capable of reliably detecting particles with masses of 30 micrograms or greater. Detectionof particles with masses of 7 micrograms was sometimes possible. Today, the practical detection limit fora typical Mil-Std PIND test is particles as small as 0.16 micrograms (using a gold ball as a standard).An excellent study was conducted where high speed movies were made to view the behavior of particlesat frequency ranges of 60 to 2000 Hz at levels of 7 to 35 G and power spectral density levels of 0.0065 to0.49 G2 per hertz.[8]. Device types used were specially fabricated glass cans mounted on headers.Particle sizes and compositions included: 0.05 and 0.1 mm (0.002 and 0.004 in.) lead spheres, 0.05 and0.1 mm (0.002 and 0.004 in.) gold flakes and 0.18 x 0.1 mm (0.007 x 0.004 in.) gold wire. The followingobservations were made.1. At 2000 Hz, vibration of 35 G, only the 0.1 mill (0.004 in.) sphere and gold flakes exhibited activity.The sphere moves along the cavity floor but the flakes bounce height is significant enough to allowshorting in some devices.2. At 1,000 Hz, vibration of 35 G, particles exhibit virtually the same behavior as 2,000 Hz. Bothmasses are capable of causing component failure under this condition.3. At 300 Hz, vibration of 35 G, vigorous activity is displayed by all particles, allowing frequent contactof critical component elements both vertically and laterally.4. At 60 Hz, vibration of 7 G, only the spheres are active, bouncing off cavity floor and ceiling but withlittle lateral movement.5. At 150 Hz to 2,000 Hz random vibration at 0.49 G2 per hertz, all particles are very active verticallyand laterally. All particles make contact with critical component elements.6. At 150 11z to 2,000 Hz random vibration at 0.0065 to 0.49 G2 per hertz, activity is very limited until abreak away point is reached.MEASURING PIND PARAMETERS AND RELATING TO PARTICLE SIZEThe PIND test is somewhat unique in that the particles themselves are never measured directly. Only avery sensitive acoustic detector measures the effects of moving particles as they impact the inside of thecavity. There are three basic direct measurements, which result in the PIND TEST system measurement:1. DETECTION2. VIBRATION3. SHOCKDetectionWhen the particles in motion contact the lid of the cavity part of their kinetic energy is transferred toacoustic energy in the form of a longitudinal particle wave, which propagates through the cavity lid to theultrasonic detector below. The sensors of choice use a piezoelectric element of Lead Zirconate Titanatemost often called PZT-5A. Acoustic energy, generated by the particle impact with the cavity lid,propagates through the cavity lid until it reaches the sensor wear plate. The acoustic pressure causes itto deflect ever so slightly pushing on the crystal, which then generates an electrical output. Please notethat if the signal is forced to propagate further such as through the substrate, it will lose significantenergy.
The sensor is defined in terms of its longitudinal sensitivity -77.5dB /-3dB ref 1V/microbar to the physicalparameter of pressure. The measurement of the sensitivity of these electro acoustic sensors is describedwell in United States Naval Research Laboratory (NRL) texts and has been made into an ANSI standardwhich used a full-field three sensor underwater reciprocity calibration technique to accurately measurethe sensitivity of the crystal response. Less accurate methods of sensitivity measurement used includecapacitive pickup calibration or ultrasonic white noise calibration. Either of these methods can be used tomeasure the sensor output but are only relative measurement methods and can made accurate only byreferring back to the absolute calibration method of ANSI S1.2-1988.The PZT-5 sensors are simply the most sensitive sensors available. To get maximum sensitivity they areused at peak resonance. The exact sensitivity and resonant frequency can both vary at time ofmanufacture and over time with use. The frequency of resonance is allowed to vary from 150 to 160 KHz.The peak sensitivity can be dampened by a variety of factors including improper or weakened bonding tothe wear plate. The most common reason for sensors to lose sensitivity over time is the bond that holdsthe crystal to the front surface wear plate will begin to micro crack with use and age.After the sensor converts the acoustic energy to electrical energy, it is amplified and filtered to yield asignal of sufficient amplitude and then displayed on a monitor scope, converted to a low frequency audiosignal for audio interpretation, and finally compared to a threshold to provide an impartial indicator ofsignal. The amplification is described by the Military Standards to be 60dB /- 2dB. Tight frequencyfiltering helps to eliminate unwanted noise from RFI or line voltage spikes.As the sensor and the source of the acoustic wave get farther apart the measured energy is reduced. TheThe PIND test is applicable to a wide variety of package types. Signal loss is caused by three factors:attenuation, reflection, and geometric spreading.1.Attenuation is the absorption of energy as the acoustic wave propagates through a material.Metals have low absorption while softer materials have higher absorption. Eutectic would attenuate signalsgreater than metals.2.Reflection is caused by the boundary between two dissimilar materials. In the case of the PINDtests the path from the lid to the work surface is simple with low reflection loss. But the path through thesubstrate is more complex with the die, die bonding material, substrate, and finally substrate bondingmaterial all comprising different materials leading to reflection losses.3.Geometric spreading is the greatest source of signal loss. At the time of impact, all of the energyof the acoustic signal is contained in a single point. Later the wave has expanded into a circle (in threedimensions a sphere) but still contains the same energy. In this two dimensional model a circle ofcircumference 2*π*radius contains the same energy as the original point source. In short the longer thesignal path the greater the attenuation.The diagram below is experimental data showing the actual sensitivity loss as the signal moves furtheraway from the source.
The older discrete packages tended to be small with at least one flat surface. For years these were testedwith a small, about one-inch sensor active area. When tested lid down, the particle impinges on the lid,and the energy is transferred through the lid to the work surface of the sensor and is converted to anelectrical signal. If one places the part substrate down, the acoustic signal must propagate either throughthe substrate or around the substrate to the work surface of the sensor causing significant signal loss.Today the parts are much larger often measuring several inches across. To PIND large parts one needs totest them multiple times with a single crystal sensor or employ multiple crystals within the sensor. Below isa picture of a modern four crystal sensor used for larger hybrid and Multi-Chip Module package types.Placing more crystals in the sensor allows for the testing of larger packages in a single pass.VibrationVibration is used to impart kinetic energyto particles that are contained within thecavity. The energy can be described by1/2 (Mass of particle) * (Velocity ofparticle) 2. If there are no particles orthere is no movement then the particleenergy is zero and hence the electricaloutput of the sensor is also zeroed. Theeffect of vibration on loose particles hasbeen well studied. The graphs of Figures2-6 describe the effects of varying theparticle velocity and mass. Adjusting thevibration amplitude and/or the frequencyof vibration can alter the velocity of theparticle. The velocity is determined by
the rate of change of the displacement so the greater the displacement the greater the velocity. Figure 2shows the effect of varying the frequency on amplified sensor output from a known particle. Note thatover the normal range of frequencies used to PIND test, 45 to 130Hz, the voltage output is nearlyconstant. Testing at higher than normal frequencies will produce less throw and hence less voltageoutput.FIGURE 2Figure 3 is a graph that shows the amplified output of the sensor in voltages as a function of "G" level. Ofnote is the increasing output as a function of acceleration. Doubling the acceleration from 10 to 20 "G"can increase the output by 30-50%. Overall the effect of varying velocity within the framework of the PINDtest can have the result of increasing or decreasing the output by 50%.
Figure 4 is a graph showing the amplified voltage output as a function of "G" level for particles of differingmass. Higher mass give higher voltage outputs. The 6-microgram particle gives an output that is aboutfour times greater than the 1.24 microgram particle expected with the higher particle energy.Figure 5 shows the amplified voltage output versus frequency for particles with the same mass but withdifferent shapes. Within some error they behave about the same. The sphere gives greater signalsbecause it is round and is less dependent on direction of impact than those of non-uniform shape.Finally Figure 6 shows the amplified voltage output versus frequency for three different particles in thesame TO-5 package. With the two wire type particles the voltage output is double for the wire with twice
the mass.Both velocity and mass can affect the signal output from the PIND test. Velocity is constrained by thedimensional limits of the PIND test and is generally limited to about 50% change. The particle mass onthe other hand has a great affect on the output as one would effect from the initial kinetic energy equationfor a particle in motion.For ever larger packages care must be taken to insure that the particle velocity is created repeatedly byusing the same acceleration level for all tests. This is best accomplished through the user of feedbackcontrol of the acceleration as measured by a sensor.ShockThe shock is used in the PIND test to knock particles that adhere inside the cavity loose to allow thevibrating motion. Particles can be both mechanically trapped as well as electrical trapped. As particlesimpact the inside of the cavity the triboelectric effect causes them to acquire a static charge. Neither allparticles nor elements within the cavity are perfect conductors many are "semiconductors" which increasethe triboelectric problem. Both conductive and partially conductive particles acquire charge duringvibration and then adhere to the inside of the cavity most notably somewhere on the substrate.Without the particle sticking problem there would be no need for the shock. Figure 8 is a plot of amplifiedsensor output as a function of mass of several known loose particles. The dotted line is an extrapolationof the data to small particles. Note that for the threshold limit described by MILSTD-883E (20millivolts) thelimit of detection is about 0.03 microgram. In practice the industry cannot detect particles that are thissmall with the normal PIND test. The problem is that the smallest particles exhibit the property ofadhesion and stop moving during the vibration cycle.
Larger particles, those with masses greater then about 6 micrograms, need no shock to be detected. Butsmaller particles require shock energy to knock them back into motion so they can be detected. Figure 8is the summary of results of a work performed by Raytheon Electronics in Massachusetts to create an“enhanced PIND test” with an increase in the sensitivity of the PIND test. Because the shock energy isthe product of both the amplitude and pulse width, it is best described as a percentage of the designqualification shock pulse. Nearly all electronic packages use the same design qualification shock pulse,with amplitude of 1500 "G" and full pulse width measured at the 10% amplitude of 500 microseconds. Theshock energy for wider pulse widths requires a small amplitude or "G" value to give the same energy. Theinvestigation at Raytheon has shown that shock pulses of up to 50% of qualification design are effectivein knocking even the smallest particles loose, thus insuring adequate sensitivity of the PIND test. Theresults of this work clearly show that it is the shock pulse that determines the "SENSITIVITY" of the PINDtestIn Mil-Std 883E, the PIND test shock pulse is described by measuring at the 50% of peak amplitude.Thus for a half sine shock the full pulse width would be 200microseconds. The amplitude is targeted for1000G. Since the shock pulse energy is the area under the curve the target PIND shock pulse is 26% ofthe qualification design shock pulse. The newer PIND specification of MIL-STD-39016D, Appendix B,describes a PIND test shock pulse with full pulse width of 1000microseconds and amplitude of 200G,again 26% of qualification design. The language of the Military standards is very weak in that they use theold terminology of "not to exceed" assuming that everyone would understand that the pulse width isimportant. In fact one could decrease the shock pulse width to nearly zero and still comply with themilitary standard. There is an active effort started to correct this language in the military standards.Clearly a 200G, 50microsecond pulse width (4% of qualification design) does very little good to knocksmall particles loose, making the shock clearly ineffective.
Shock is the single most valuable tool for failure analysis applications. If the loose particles are large theparticles can be vibrated out easily. BUT when the particle size decreases then the small particles adhereeasily. Once tested then the particles latch up. It can take up to 24 hours for the static charges todissipate. The only tool available to free these loose particles is shock. Increasing the shock energy willknock even the most stubborn particles loose again to be vibrated out for further analysis.As the parts get heavier more shock energy is required to achieve the same resultant shock level. Thechart above shows the measured shock level as the load increases for a modern system that employsadaptive control of the shock level versus an old mechanical spring actuated system. As the load increasethe open loop system soon goes out of tolerance while the closed loop controlled system continues withintest tolerances.CONCLUSIONLoose particle detection in hermetic electronic packages has been a problem since the early 1960s.Since then, PIND systems have provided an economic and effective tool to screen out defective parts.The equipment used has evolved from custom mechanical systems to the more sophisticatedmicroprocessor based systems available today. PIND system detection capability has dramaticallyincreased from 30 micrograms to less than 0.10 micrograms.In comparison to alternate test methods, and because the PIND test has been incorporated into MilitarySpecifications 883, 750 202, 39016 and is required for Class-S microcircuits and semiconductors, it iswidely accepted as the most economical and technically advanced test for finished electronic devices.
It is important to remember that particle mass, shape, size, composition and the type of device theparticle is encapsulated in have direct hearing on whether the particle is detectable, whether the PINDtest is repeatable and whether the particle is capable of compromising device integrity.Larger packages often require multiple crystal sensors to insure the signals generated by the looseparticles are not attenuated before they are detected. Larger parts often require larger shakers and bettercontrol of the vibration creation. Finally larger parts require a closer monitoring of the shock energy usedto keep the loose particles within the cavity moving ideally with closed loop control.[1]. Golden, Frederic. "Those Balky Computers Again." Time Magazine (December 19, 1983).[2]. Dembart, Lee. "Computer Flaws on Shuttle Tied to Tiny Objects." Los Angeles Times (December 22,1983).[3]. Adolphsen, John, William Kagdis, and Albert Timmins. A survey of Particle Contamination inElectronic Devices. Greenbelt, MD: Goddard Space Flight Center (December 1976).[4]. Clark, I.D., J.C. Burnes, and B.D. Clark “Evaluation of selected Methods for Detecting Contaminantswithin Semiconductors" Proceedings of the Institute of Environmental Sciences Annual TechnicalMeetings (1965).[5]. Reynolds, Willy. PIND Test Training Report. Report No. 03-060-WRR. Texas Instruments (May1985).[6]. Hurd, Walter. Personal correspondence. Burbank CA Lockheed Corporation. (March 1984).[7]. McGuiness, N. PlND Testing Workshop Report. Report TOR 0082 (2902-04)-4 (March 1982): pp 14.[8]. Adolphsen, John W. The Effectivity of PlND Testing. Greenbelt, MD. NASA Goddard Space FlightCenter (1979)[9]. McCullough, Ralph E. ''Screening Techniques for Intermittent Shorts." IEEE Reliability PhysicsSymposium. New York, NY: Institute of Electrical and Electronics Engineers (1972): pp 19.[10]. McCullough, Ralph E. "Hermeticity and Particle Impact Noise Test Techniques.” - IEEE ReliabilityPhysics Symposium.
employs vibration, shock, and acoustics. As a requirement for MIL-STD883E, MIL-STD750, and MIL-STD39016, this test has helped the manufacturers of hermetically sealed . Analysis of defects that passed sinusoidal vibration tests indicated that many contained particles. Additionally, the imposed mechanical stresses are believed to generate .