Transcription
COMPREHENSIVE HOUSING MARKET ANALYSISDayton, OhioU.S. Department of Housing and Urban Development,Office of Policy Development and ResearchAs of April 1, 2021Share on:
Executive Summary 2Dayton, Ohio Comprehensive Housing Market Analysis as of April 1, 2021Executive SummaryHousing Market Area DescriptionThe Dayton Housing Market Area (HMA) includes Greene,Miami, and Montgomery Counties in Ohio and is coterminouswith the Dayton, OH Metropolitan Statistical Area (MSA). TheHMA is in the Miami Valley region of southwest Ohio betweenthe Cincinnati, OH-KY-IN MSA and the Columbus, OH MSA.The current population of the HMA is estimated at 810,200.The HMA is known as the birthplace of aviation becausethe inventors of the first successful airplane, Orville andWilbur Wright, were from the city of Dayton. During WWI,more than 3,000 airplanes were manufactured at DaytonWright Airplane Company plants throughout the HMA, andairplane manufacturing continues to support the economyof the HMA. The HMA is home to Wright-Patterson Air ForceBase (AFB), which had an economic impact of 15.54 billionon the HMA in 2018 (Dayton Development Coalition).Tools and ResourcesFind interim updates for this metropolitan area, and select geographies nationally,at PD&R’s Market-at-a-Glance tool.Additional data for the HMA can be found in this report’s supplemental tables.For information on HUD-supported activity in this area, see the Community Assessment Reporting Tool.Comprehensive Housing Market Analysis Dayton, OhioU.S. Department of Housing and Urban Development, Office of Policy Development and Research
Executive Summary 3Dayton, Ohio Comprehensive Housing Market Analysis as of April 1, 2021Market QualifiersEconomySales MarketRental MarketFollowing a period of economic expansion from2011 through 2019, significant nonfarm payroll lossin April 2020 contributed to overall joblosses during the 12 months ending March 2021from a year earlier. Nonfarm payrolls in the HMAdeclined by 26,900 jobs, or 6.9 percent, to365,600 during the 12 months ending March 2021from the same period a year earlier. All nonfarmpayroll sectors except the transportation andutilities sector contributed to the job loss. Duringthe 3-year forecast period, nearly all the lostjobs are expected to be recovered, and nonfarmpayroll growth in the HMA is estimated to average1.2 percent a year.The sales housing market in the HMA is tightdespite the recent economic contraction, with anestimated 1.3-percent vacancy rate—down from2.7 percent in 2010, when conditions were soft.During the next 3 years, demand is estimated for3,575 new homes. Demand in the HMA is expectedto increase throughout the 3-year forecast periodbecause of low mortgage interest rates, continuednet in-migration, and improving economicconditions. The 310 homes under constructionin the HMA are expected to satisfy some of theforecast demand.Rental housing market conditions in the HMA arebalanced. The overall vacancy rate is estimatedat 8.2 percent—down from 12.3 percent in 2010,when conditions were soft. An increase in renterhouseholds since 2010 has contributed to theabsorption of excess vacant rental units. Theapartment market in the HMA is tight, with a3.1-percent vacancy rate during the first quarter of2021, compared with 2.9 percent during the firstquarter of 2020 (Moody’s Analytics REIS). Duringthe forecast period, demand is expected for 2,825rental units in the HMA. The 1,325 rental unitscurrently under construction are expected to satisfya portion of demand during the forecast period.Weak, but Improving: On a monthto-month basis, 30.8 percent ofthe 57,100 nonfarm payroll jobslost during March and April 2020due to countermeasures implementedin March 2020 to slow the spreadof COVID-19 were recoveredby the end of March 2021 (notseasonally adjusted).Balanced: Renter householdscurrently account for 36.3 percentof all households in the HMA—upfrom 35.1 percent in 2010.Tight: The average home salesprice in the HMA has been risingfor more than 8 years, and therate of growth accelerated to thehighest level, 13 percent, during the12 months ending March 2021, asthe inventory of homes for saledeclined significantly.TABLE OF CONTENTSEconomic Conditions 4Population and Households 8Home Sales Market 12Rental Market 17Terminology Definitions and Notes 223-Year Housing Demand ForecastDayton HMATotal DemandUnder ConstructionSales UnitsRental Units3,5752,8253101,325Notes: Total demand represents estimated production necessary to achieve a balanced market at the end of the forecast period. Units underconstruction as of April 1, 2021. The forecast period is April 1, 2021, to April 1, 2024.Source: Estimates by the analystComprehensive Housing Market Analysis Dayton, OhioU.S. Department of Housing and Urban Development, Office of Policy Development and Research
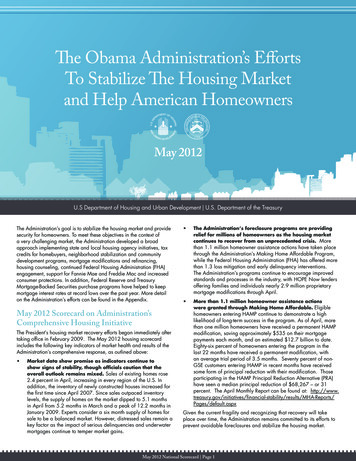
Economic Conditions 4Dayton, Ohio Comprehensive Housing Market Analysis as of April 1, 2021Economic ConditionsLargest Sector: Education and Health ServicesThe education and health services sector accounts for 19 percent of allnonfarm payroll jobs in the HMA and was the sector that added the mostjobs from 2001 through 2019, before the current economic downturn.Primary Local Economic FactorsThe HMA is the home of Wright-Patterson AFB and is a center for aerospaceresearch and development. With 20,675 active military and civilianemployees, Wright-Patterson AFB is the largest employer in the HMA(Table 1) and the largest single-site employer in Ohio. In 2018, the AFB hadan economic impact of 15.54 billion on the HMA (Dayton DevelopmentCoalition). Located on base is the National Museum of the United StatesAir Force, the oldest and largest military aviation museum in the world,which attracts more than 800,000 visitors a year and has an economicimpact of approximately 40 million a year (Houston Business Journal).Along with defense and aerospace, the HMA is home to several privateTable 1. Major Employers in the Dayton HMAName of EmployerNonfarm Payroll SectorWright-Patterson Air Force BasePremier Health PartnersKettering HealthThe Kroger Co.Dayton Children’s HospitalAmerican Honda Motor Co., Inc.Sinclair Community CollegeAmerican CareSource Holdings, Inc.LexisNexisUniversity of DaytonGovernmentEducation & Health ServicesEducation & Health ServicesWholesale & Retail TradeEducation & Health ServicesManufacturingGovernmentFinancial ActivitiesProfessional & Business ServicesEducation & Health ServicesNumber of 13,0003,000Notes: Excludes local school districts. Data include military personnel, who generally are not included innonfarm payroll survey data.Sources: Moody’s Analytics; Defense Manpower System, September 2020and public universities and several healthcare providers, which represent5 of the 10 largest employers in the HMA. As a result, the government, themanufacturing, and the education and health services sectors combine toaccount for 46 percent of nonfarm payrolls (Figure 1).Current Economic Conditions and theEffects of COVID-19—Recent 24 MonthsEconomic conditions have improved since May 2020, when businesses beganto reopen gradually following the closure of nonessential businesses to slowthe spread of COVID-19. By March 2021, 30.8 percent of the 57,100 jobs loston a monthly basis during March and April 2020 (not seasonally adjusted)Figure 1. Share of Nonfarm Payroll Jobs in the Dayton HMA, by SectorState 1%Mining, Logging, & Construction 4%Local 9%Manufacturing 11%Federal 5%Other Services 3%Wholesale4%Government16%Leisure &Hospitality 9%Total365.6Trade 14%Retail10%Transportation& Utilities 4%Education &Health Services 19%Information 2%Financial Activities 5%Professional & Business Services 13%Notes: Total nonfarm payroll is in thousands. Percentages may not add to 100 percent due to rounding.Based on 12-month averages through March 2021.Source: U.S. Bureau of Labor StatisticsComprehensive Housing Market Analysis Dayton, OhioU.S. Department of Housing and Urban Development, Office of Policy Development and Research
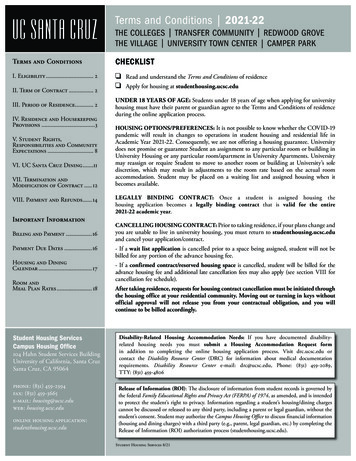
Economic Conditions 5Dayton, Ohio Comprehensive Housing Market Analysis as of April 1, 2021had been recovered. As a result of those losses,economic conditions during the 12 months endingMarch 2021 were weak, but improving, comparedwith a year earlier. During the 12 months endingMarch 2021, jobs declined by 26,900 jobs, or6.9 percent, to 365,600 (Table 2)—slower thanthe national rate of 7.4 percent. By comparison,during the 12 months ending March 2020, jobsin the HMA increased by 2,200, or 0.6 percent.Job losses in the HMA during the 12 monthsending March 2021 occurred in nearly all sectorsand were largest in sectors with jobs that cannoteasily be done remotely. Nearly one-third of netjob losses occurred in the leisure and hospitalitysector, which lost 7,700 jobs—a 19.4-percentdecline. Approximately 410 employees werelaid off at two hotels, including the Marriott atthe University of Dayton and the Crowne PlazaDayton (Ohio Department of Job and FamilyServices, Worker Adjustment and RetrainingNotification). The education and health servicessector contracted by 4,300 jobs, or 5.7 percent,from a year earlier, to 70,800 jobs, partly becausehospitals were temporarily unable to provide manyelective procedures and colleges and universitiesmoved to remote learning or closed during the2020 spring and fall semesters. Payrolls in themanufacturing sector declined by 3,900, or8.9 percent, from a year earlier, partly becausethe production of some manufactured goods wasdeemed nonessential. Sectors in which a largepercentage of the workforce was able to workTable 2. 12-Month Average Nonfarm Payroll Jobs (1,000s) in the Dayton HMA, by Sector12 Months EndingMarch 202012 Months EndingMarch 2021Total Nonfarm Payroll Jobs392.5365.6-26.9Goods-Producing Sectors57.653.4-4.2-7.313.813.5-0.3-2.2-8.9Mining, Logging, & ConstructionManufacturingAbsolute ChangePercentage Change-6.943.839.9-3.9Service-Providing Sectors334.9312.3-22.6-6.7Wholesale & Retail Trade52.650.4-2.2-4.2Transportation & nancial Activities18.217.8-0.4-2.2Professional & Business Services52.549.1-3.4-6.5Education & Health Services75.170.8-4.3-5.7Leisure & Hospitality39.631.9-7.7-19.4Other 3Notes: Based on 12-month averages through March 2020 and March 2021. Numbers may not add to totals due to rounding. Data are in thousands.Source: U.S. Bureau of Labor Statisticsremotely were less affected by the countermeasures used to slow the spread of COVID-19, includingthe government sector, which declined by 2,700 jobs, or 4.3 percent. The transportation and utilitiessector was the only sector to add jobs during the past 12 months, increasing by 500 jobs, or 3.8 percent.More than two-thirds of the gain was in the transportation and warehousing industry, which increased by300 jobs, or 2.8 percent. Greater demand for e-commerce over the past few years was compounded byphysical distancing measures and the temporary closure of nonessential brick-and-mortar retail duringthe pandemic.Current Conditions—UnemploymentAs the economy of the HMA contracted during the 12 months ending March 2021, the average unemploymentrate nearly doubled, to 8.1 percent from 4.2 percent a year earlier, but is below the 8.7-percent rate for thenation (Figure 2). The increase in the average unemployment rate in the HMA is in contrast to a generaldecline that occurred from 2011 through 2019. Although high, the current unemployment rate remains belowthe previous high of 11.7 percent during the 12 months ending March 2010.Comprehensive Housing Market Analysis Dayton, OhioU.S. Department of Housing and Urban Development, Office of Policy Development and Research
Economic Conditions 6Dayton, Ohio Comprehensive Housing Market Analysis as of April 1, 2021Figure 2. 12-Month Average Unemployment Rate in the Dayton HMA and the NationEconomic Periodsof SignificanceUnemployment Rate ar-19Mar-20Mar-212.0Note: Based on the 12-month moving average.Source: U.S. Bureau of Labor StatisticsFigure 3. 12-Month Average Nonfarm Payrolls in the Dayton HMANational RecessionNonfarm r-00340MDuring 2000, jobs in the HMA peaked at 424,400,but from 2001 through 2010, the HMA lost jobsevery year, with most of the job loss concentratedat the beginning and the end of the 10-yearperiod, when the nation underwent two economicrecessions (Figure 3). From 2001 through 2010,jobs in the HMA declined by an average of 6,400,or 1.6 percent, annually. Job losses occurredin 10 of 11 nonfarm payroll sectors, and themanufacturing sector led declines with an averageloss of 3,900 jobs, or 7.1 percent, annually. Thelargest manufacturing job reduction of 8,900 jobs,or 19.7 percent, occurred in 2009, in part becausea General Motors Company (GM) assembly plantclosed in the city of Moraine, laying off 1,075employees. In 1990, the HMA had the largestconcentration of GM employees outside Michigan.Government sector jobs decreased by an averageof 300, or 0.5 percent, annually from 2001through 2008 before increasing by an average of1,100, or 1.7 percent, annually from 2009 through2010. During the latter part of the period, thefederal government subsector increased by anaverage of 1,100 jobs, or 6.5 percent, annuallywhen the Base Realignment and Closure (BRAC)process added approximately 1,120 new militaryand civilian employees at Wright-Patterson AFB.From 2001 through 2010, the mining, logging,12.0Nonfarm Payrolls (in Thousands)Contraction: 2001 Through 2010Dayton HMANote: 12-month moving average.Sources: U.S. Bureau of Labor Statistics; National Bureau of Economic ResearchComprehensive Housing Market Analysis Dayton, OhioU.S. Department of Housing and Urban Development, Office of Policy Development and Research
Dayton, Ohio Comprehensive Housing Market Analysis as of April 1, 2021and construction sector lost an average of 500 jobs, or 3.8 percent, annually.Residential construction declined in response to the national housing marketdownturn and net out-migration of people seeking jobs in larger employmentcenters, including the Cincinnati and Columbus MSAs. From 2001 through2010, the education and health services sector was the only sector with a netgain in jobs, increasing by an average of 1,000 jobs, or 1.6 percent, annually,to 67,800 jobs. The sector became the largest nonfarm payroll sector in2005, contributing nearly 16 percent of jobs, a proportion that increased to19 percent by 2010.Economic Recovery: 2011 Through 2019Following 10 years of economic contraction, the economy of the HMA generallyexpanded from 2011 through 2019, but job growth started decelerating in2016. From 2011 through 2015, nonfarm payrolls rose by an average of 3,800jobs, or 1.0 percent, annually and slowed to an average gain of 3,000 jobs,or 0.8 percent, a year from 2016 through 2019, to 391,900 jobs. From 2011through 2019, job growth in the HMA was slower than the 1.6-percent annualgrowth rate for the nation. Within the HMA, 8 of the 11 sectors added jobsduring the 9-year period. The manufacturing sector added the most jobs,Employment ForecastDuring the 3-year forecast period, nonfarm payrolls are expected to increaseby an average of 1.2 percent annually. By the end of the 3-year forecast, thelevel of nonfarm payrolls is expected to be only 1 percent below the February2020 level, before the onset of the pandemic. Stronger economic conditionsare expected in the early part of the forecast period as COVID-19 precautionsare relaxed and businesses continue to reopen. Job growth is expected toresume in the manufacturing and the education and health services sectors.Defense aircraft manufacturing employment is expected to increase by morethan 400 jobs when the F-35 Hybrid Product Support Integrator OrganizationEconomic Conditions 7increasing by an average of 900 jobs, or 2.2 percent, annually. Expansionsin the manufacturing sector included a 350 million Fuyao Glass Americaautomotive glass manufacturing plant at the former GM plant, adding 1,550employees in 2015. From 2011 through 2019, the education and health servicessector added an average of 800 jobs, or 1.1 percent, annually. In 2019, KetteringHealth completed a 25 million expansion of Grandview Medical Centerin the western portion of the city of Dayton, which doubled the size of theemergency department from 25 to 50 beds. From 2011 through 2019, jobs inthe professional and business services sector also increased, by an averageof 800, or 1.6 percent, a year, to 52,400 jobs. From 2011 through 2019, jobgrowth in the mining, logging, and construction sector resumed, increasing byan average of 300 jobs, or 2.9 percent, annually, partly because of increasedresidential construction in response to net in-migration. The governmentsector lost an average of 200 jobs, or 0.4 percent, annually from 2011 through2019 because job losses in the state and local government subsectorsoffset an average annual increase of 100 jobs, or 0.5 percent, in the federalgovernment subsector. Job growth in the federal subsector occurred partlybecause employment at Wright-Patterson AFB began increasing in 2015 insupport of increasing projects, including the development of flying cars.is fully operational in 2022 at Wright-Patterson AFB. In addition, a new 78 million Dayton Children’s Hospital specialty care outpatient center isscheduled to be completed in 2023 at the main campus of the hospital.Leisure and hospitality sector jobs are expected to recover a portion of thejobs lost during the pandemic. Four new hotels, with a combined 490 rooms,are scheduled to open, including two in downtown Dayton: the 25 million118-room Hotel Ardent Tapestry by Hilton, which is being converted from anoffice building, and the 134-room AC Hotel by Marriott, which was scheduledto be completed in the summer of 2021 but is expected to open in the fall of2022 because of delays caused by COVID-19.Comprehensive Housing Market Analysis Dayton, OhioU.S. Department of Housing and Urban Development, Office of Policy Development and Research
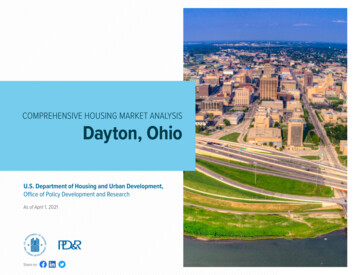
Population and Households 8Dayton, Ohio Comprehensive Housing Market Analysis as of April 1, 2021Table 3. Dayton HMA Population and Household Quick FactsPopulation growth in the Dayton HMAhas accelerated since 2015 despite aslowdown in net natural increase becauseof a shift to net in-migration.Population Trends2010CurrentForecastPopulationAverage Annual ChangePercentage ouseholdQuick Facts2010CurrentForecastHouseholdsAverage Annual ChangePercentage otes: Average annual changes and percentage changes are based on averages from 2000 to 2010, 2010 to current, and current to forecast.The forecast period is from the current date (April 1, 2021) to April 1, 2024.Sources: 2000 and 2010—2000 Census and 2010 Census; current and forecast—estimates by the analystFigure 4. Components of Population Change in the Dayton HMA, 2000 Through the ForecastNet Natural ChangeNet MigrationPopulation Growth3,000Population oreturren2015–C2000–201510-4,00020Population trends have generally mirroredeconomic conditions in the HMA since 2000.From 2000 to 2010, a period when the localeconomy was contracting, the populationdecreased by an average of 650, or 0.1 percent,annually (Table 3; Census Bureau decennialcensus counts). During the period, net outmigration averaged 3,325 people, annually, andoffset average annual net natural increase of2,675 people (Figure 4). Subsequently, when theeconomy began expanding, the population grewby an average of 250, or less than 0.1 percent,annually from 2010 to 2015. During the period,net out-migration slowed, averaging 1,225 peopleannually, and net natural increase slowed toan average of 1,475 people a year. During the15-year period, net out-migration from the HMAwas highest to Warren and Franklin Counties,which are part of the Cincinnati and ColumbusMSAs, respectively (Internal Revenue Service,County-to-County Migration Data). Economicconditions in those MSAs were stronger. SincePopulationQuick Facts10–Current Population: 810,2002015, the population has grown an average of 1,675, or 0.2 percent, a year despite the slowdown andsubsequent decline in job growth because of a shift to net in-migration, which averaged 1,250 peoplea year, accounting for 75 percent of population growth. Simultaneously, net natural increase fell to anaverage of 425 people annually. Some net in-migration was from Warren and Franklin Counties, partly20Population andHouseholdsNotes: Average annual changes and percentage changes are based on averages from 2000 to 2010, 2010 to current, and current to forecast.The forecast period is from the current date (April 1, 2021) to April 1, 2024.Sources: 2000 and 2010—2000 Census and 2010 Census; current and forecast—estimates by the analystComprehensive Housing Market Analysis Dayton, OhioU.S. Department of Housing and Urban Development, Office of Policy Development and Research
Population and Households 9Dayton, Ohio Comprehensive Housing Market Analysis as of April 1, 22,000Active Military and Civilian PersonnelActive-Duty Military Personnel and Civilian Personnel38,00008Population growth from 2015 to 2019 was mostlythe result of an increase in the retirement-ageportion of the population, generally definedas residents age 65 and older. This age cohortincreased by an average of 3,050, or 2.2 percent,annually (American Community Survey [ACS]1-year estimates) during the period. The relativelyaffordable housing market and services providedby Wright-Patterson AFB to retired militarypersonnel attracted or retained retired civilianand military personnel; approximately 14,000military retirees reside in the HMA (DaytonBusiness Journal, 2020). At the same time, theHMA is a popular place to live for young adults,including students and military personnel, ages18 to 39. During 2019, this age cohort increasedby an average of 1,500 people, or 0.6 percent,annually and accounted for 29 percent of thepopulation—slightly higher than the proportionin 2015 (Figure 6). During the same period, theportions of the population younger than 18 yearsold and age 40 to 64 years decreased by annualaverages of 490 and 2,700 people, or 0.3 and1.1 percent, respectively.Student Enrollment20Age Cohort TrendsFigure 5. Student Enrollment and Active-Duty Military and Civilian Personnel Trends in the Dayton HMAStudent Enrollmentbecause the HMA is more affordable than theCincinnati and Columbus MSAs. An increase inpersonnel at Wright-Patterson AFB slightly offsetdecreased student enrollment at universities andcolleges (excluding Sinclair Community College)in the HMA since 2011 (Figure 5)—a reversal fromincreasing enrollment from 2001 through 2010.Note: Student enrollment figures exclude Sinclair Community College.Sources: Integrated Postsecondary Education Data System, with estimates by the analyst; Defense Manpower System, September 2020Figure 6. Population by Age Range in the Dayton HMA2015201935%30%25%20%15%10%5%0%Younger than 18 Years18–39 Years40–64 YearsOlder than 65 YearsSource: U.S. Census BureauComprehensive Housing Market Analysis Dayton, OhioU.S. Department of Housing and Urban Development, Office of Policy Development and Research
Population and Households 10Dayton, Ohio Comprehensive Housing Market Analysis as of April 1, 2021Nearly two-thirds of the population isconcentrated in Montgomery County; however,Montgomery County has had net out-migrationsince people began leaving the city of Daytonduring the 1960s. In 1960, the population of thecity of Dayton peaked at 262,332 but decreasedan average of 1.2 percent annually, to 141,527 in2010. From 2010 to 2020, the population of thecity declined an average of 0.1 percent annually,to 139,900. Slower net out-migration from thecity partly resulted from the revitalization ofdowntown Dayton, boosted by economic growthand the popularity of urban living. The populationin the suburban and rural counties of Greene andMiami accounts for 21 and 13 percent of the HMApopulation, respectively.of net household formation since 2010, compared with all of the household increase during the 2000s.As a result, the homeownership rate fell to an estimated 63.7 percent as of the current date—down from64.9 percent in 2010 and 66.4 percent in 2000 (Figure 7).Military and Student HouseholdsWright-Patterson AFB and colleges and universities affect household formation in the HMA. WrightPatterson AFB provides unaccompanied housing for 400 military personnel and 100 single-family homesfor officers and their dependents. The AFB also provides 2,100 privately operated single-family homes,duplex homes, and townhomes for rent. Of the remaining 2,950 active-duty employees who live off base,approximately 34 percent own homes and 66 percent rent private units (estimates by the analyst). Of themore than 50,600 students that attend colleges and universities in the HMA (Integrated PostsecondaryEducation Data System, with estimates by the analyst), approximately 14,800 are housed in dormitoriesor university-affiliated student apartments. The remaining 35,800 students who live off campus anddo not live with their parents occupy an estimated 8,600 housing units; approximately 95 percent ofFigure 7. Households by Tenure and Homeownership Rate in the Dayton HMAOwnerHousehold TrendsHomeownership Rate (%)67400,00066.466300,000HouseholdsHousehold growth has exceeded populationgrowth in the HMA since 2000, partly becauseof a higher proportion of students, activeduty military, and retirees, which have smallerhousehold sizes than family households. Thenumber of households is currently estimated at338,600, reflecting an average annual increase of1,000, or 0.3 percent, from 327,630 householdsin 2010. Among the households in the HMA,a greater proportion have traditionally beenowners, but that proportion has been decliningfor the past two decades, albeit at a slowing rate.Renter households have accounted for 73 ent64Homeownership Rate (%)Population by Geography63Note: The current date is April 1, 2021.Sources: 2000 and 2010—2000 Census and 2010 Census; current—estimates by the analystComprehensive Housing Market Analysis Dayton, OhioU.S. Department of Housing and Urban Development, Office of Policy Development and Research
Dayton, Ohio Comprehensive Housing Market Analysis as of April 1, 2021those households rent private units, and the remainder are homeowners(estimates by the analyst). Together, military and student households accountfor an estimated 1 and 8 percent of the 215,700 owner and 122,900 renterhouseholds, respectively.Population and Household Growth ForecastDuring the 3-year forecast period, population growth is expected to continueat the same rate it has been since 2015, increasing by an average of 1,600,or 0.2 percent, annually, to 815,000 by April 1, 2024. Net in-migration isPopulation and Households 11expected to account for 93 percent of the growth during the forecast period,as people continue to move to the HMA for job opportunities and affordablehousing; at the same time, net natural increase is expected to continueslowing. During the next 3 years, the rate of household growth is expectedto rise slightly, increasing by an average of 1,325 households, or 0.4 percent,annually, reaching 342,600 households by April 1, 2024. The homeownershiprate is expected to continue falling—although at a slower rate than from 2010to the current date—to 63.5 percent.Comprehensive Housing Market Analysis Dayton, OhioU.S. Department of Housing and Urban Development, Office of Policy Development and Research
Home Sales Market 12Dayton, Ohio Comprehensive Housing Market Analysis as of April 1, 2021Home Sales MarketTable 4. Home Sales Quick Facts in the Dayton HMADayton HMAMarket Conditions: TightDuring March 2021, the HMA had0.6 months of available for-saleinventory—down from 1.4 months ayear earlier and significantly below apeak of 12.6 months of availableinventory in 2011 (CoreLogic, Inc.).Current ConditionsThe home sales market in the HMA is currently tight,with an estimated vacancy rate of 1.3 percent—down from 2.7 percent in April 2010 (Table 4).Sales market conditions were generally balancedin the early 2000s and began to soften in2006 during the buildup to the housing marketdownturn. Conditions softened further through2011, with the onset of the Great Recessionand the subsequent housing market downturn.Substantial overbuilding and net out-migrationalso contributed to softening conditions.Subsequent economic growth, a shift to netin-migration, and lower levels of homebuildingactivity shifted the market to balanced conditionsfrom 2012 through 2019. In 2020, despitesignificant job losses and increased homebuildingactivity, the sales market tightened, partiallybecause of a decline in the number of homeslisted for sale and because mortgage interestrates reached their lowest levels in more thanVacancy RateHome SalesQuick FactsNation1.3%NAMonths of Inventory0.61.2Existing Home Sales11,3506,010,000-22%12% 337,400 397,8006%6% 184,400 355,2001-Year ChangeNew Home Sales Price1-Year ChangeExisting Home Sales Price1-Year ChangeMortgage Delinquency Rate16%12%3.1%3.7%NA data not available.Notes: The vacancy rate is as of the current date; home sales and prices are for the 12 months ending March 2021; and months of inventory andmortgage delinquency data are as of March 2021. Th
The Dayton Housing Market Area (HMA) includes Greene, Miami, and Montgomery Counties in Ohio and is coterminous with the Dayton, OH Metropolitan Statistical Area (MSA). The HMA is in the Miami Valley region of southwest Ohio between the Cincinnati, OH-KY-IN MSA and the Columbus, OH MSA. The current population of the HMA is estimated at 810,200.