Transcription
A NEW LOOK: A SURVEYOF ARIZONA’S HOMELESSPOPULATIONE.C. Hedberg, Ph.D.& Bill HartMorrison Institutefor Public PolicyJune 2013
A NEW LOOK: A SURVEY OFARIZONA’S HOMELESS POPULATIONE.C. Hedberg, Ph.D. and Bill HartMorrison Institute for Public PolicyArizona Commission on Homelessness and HousingArizona Department of Economic SecurityJune 2013Executive SummaryThis report presents the findings of a new approach by the Arizona Department ofEconomic Security (DES) and the Arizona Commission on Homelessness and Housing(ACHH) to learn more about of the nature and needs of Arizona’s homeless population.A small army of trained surveyors interviewed a sample of homeless individuals in thePhoenix and Tucson areas and across the state. The survey was organized and supervisedby the state’s three Continuums of Care and was conducted in the summer of 2012.Though the survey fell short of its goal of interviewing 2,030 homeless individuals – afigure based on estimates of homeless people drawn from the 2011 Street and ShelterCount – it did succeed in gathering responses in the targeted percentages from the threegeographic areas.The results portray an “average” Arizonan experiencing homelessness today as a single,childless White male in his mid-40s; he has been homeless for several months and hasexperienced two bouts of homelessness in the past three years. He probably spent lastnight in an emergency shelter; he most likely became homeless after losing a job orfollowing conflict or violence in his family. This profile will not surprise those familiarwith homelessness in Arizona; in fact, it generally matches findings from DES’s annualhomelessness report and other sources.However, this new infusion of empirical data – supplied directly by homeless personsthemselves – arguably lends support for policies targeting critical service needs, such as:Job creation and trainingIncentivizing more individuals to use shelterSubstance abuse treatmentAid for victims of domestic violenceMental health servicesCase management Affordable housing 2
IntroductionHomelessness presents a formidable array of challenges for Arizonapolicymakers. This large, mobile, constantly renewing population of adults and childrenincludes many of Arizona’s most needy and troubled residents. They are difficult tolocate, count and characterize, let alone assist. Secondly, there is no overwhelming publicpressure to do so; this may be because, for the general public, homelessness remains alargely hidden phenomenon. Most tend tolive just out of sight, in the margins andThe U.S. Department ofoverlooked spaces of communities, urbanHousing and Urbanand rural, across the state. On any givenDevelopment defines peopleday, tens of thousands of Arizonans arein the following situations asofficially “homeless”:homeless. But most Arizonans glimpsethem only in ones or twos. Many who do Literally Homeless: “Annotice them react with fear, or shame, orindividual or family who lackseven disgust.It is tempting – albeit easier - toapproach the state’s homeless populationas a homogenous group with essentiallythe same sets of past woes and presentneeds. For most, however, homelessnessis a temporary misfortune, not a lifestyle.Every person on the street or in a sheltertoday has a face, a name and a personalhistory. Some are middle-aged men whofell out of an increasing unforgiving jobmarket and can’t quite climb back in.Some are young mothers fleeing abusedirected against themselves or theirchildren. Others are struggling withphysical or mental disabilities. Still othersare veterans haunted by battlefields theycan’t fully leave behind. Faced with this needy, complexand varied population, how shouldpolicymakers respond? Some Arizonansargue for a minimal approach; they regretthe suffering but ultimately view it as aninevitable consequence of the free marketat work, and warn against attempts atsocial engineering. Others argue for arobust public policy effort, both for moral 3a fixed, regular, and adequatenighttime residence.” Thisgenerally means peoplespending their nights in “apublic or private place notmeant for human habitation,”such as outside, in a car, or inshelters.At imminent risk ofhomelessness: “Anindividual or family who willimminently lose their primarynighttime residence,” usuallywithin two weeks, and can’tafford other permanenthousing.Homeless under otherfederal laws: This includes“unaccompanied youth under25 years of age” and familiesthat haven’t had stablehousing for at least 60 daysand have few prospects ofgetting it.Domestic violencevictims: “Any individual orfamily who is fleeing, orattempting to flee domesticviolence, and is incapable ofsecuring other permanenthousing.”
reasons and because such a large cohort of dependent, unproductive residents creates adrag on all Arizonans’ economic prosperity. Recent history may bolster this argument:The national economic catastrophe laid bare the fragility of most people’s economicsecurity. Compared to a state population of 6.3 million, a relatively small number ofresidents fit the official definition of “homeless” in Arizona. But many more arethemselves only one serious medical mishap or one layoff away from the street.This report presents the findings of a new approach by the Arizona Department ofEconomic Security (DES) and the Arizona Commission on Homelessness and Housing(ACHH) to learn more about of the nature and needs of Arizona’s homeless population:A small army of trained surveyors interviewed a sample of homeless individuals in thePhoenix and Tucson areas and across the state. The survey was organized and supervisedby the state’s three Continuums of Care and was conducted in the summer of 2012. Asurvey pool of 2,030 was targeted, based upon estimates of homeless people drawn fromthe 2011 Street and Shelter Count. The survey proposed to interview 1,177 respondentsin Maricopa County, 548 in Pima County and 304 in the Balance of State (BOS). Half ofthe surveys were to be conducted in emergency shelters and half on the streets.While the survey fell short of its goals, ending with just more than 1,300 totalresponses, the responses were obtained in roughly the same percentage distribution acrossthe three geographic areas as was originally planned. Based on the 1,300-plus returns,this report presents notable findings from this first-time survey and discusses somestatistically significant relationships found in the data. It also includes a discussion ofmethodology and suggestions about the design of future surveys.Indeed, it may be most useful to view this report as the beginning of a process ofdiscovery rather than its end. Due to the design of the survey, the findings presented herecannot be considered statistically representative of all Arizona homeless people andfamilies. Nor, in many cases, do they provide direct support for one policy option overanother. However, the amount of data, and the fact that they come from homeless peoplethemselves, should assist ACHH and others in identifying important service needs, and inprioritizing items for future surveys that will further amplify the voices of Arizona’shomeless.The report is organized as follows. We first present descriptive statistics from thesurvey, breaking the results down by area as well as statewide. This is followed by adiscussion of the correlations found among the key variables in the data. This section ispresented under several subsections, each providing information about the comparisonsfound to be statistically significant, then posing questions for another round of datacollection. We then provide utility sections that outline the methodology employed totest the correlations, and a section outlining next steps.A Profile of HomelessnessEach person is unique. However, the collective survey responses can helpconstruct a useful profile of the “average” Arizonan experiencing homelessness today.Considering all survey data statewide, this composite person is a single, childless White4
male in his mid-40s. He currently has been homeless for several months and hasexperienced two bouts of homelessness in the past three years. He probably spent lastnight in an emergency shelter. He became homeless after losing a job; he’s not currentlyworking, and is unlikely to have income. If he has income, it’s likely to be around 200 amonth, but could range higher, especially if it comes from Supplemental Security Income(SSI) or Social Security Disability Insurance (SSDI), the two most common sources. Hehas no military experience. He wants to be housed but is not currently on a waiting listfor housing. If he could afford to pay rent, he would like to pay just over 250 per month.Among public services, he is most likely to utilize shelter and food assistance. He doesnot have health insurance, but has been in the Arizona Health Care Cost ContainmentSystem (AHCCCS) or some other insurance program within the past year.Table 1, reproduced in full at the end of this report, provides means andpercentages for the characteristics noted above, both for the state as a whole and for eachof the three geographic regions. The data are generally uniform across all sectors,suggesting that the characteristics, challenges and needs of Arizona’s homelesspopulation exhibit more similarities than differences. Some response sets do, of course,display wide variations. But such disparities must be viewed with caution, as apparentdifferences in various categories may not be statistically significant. The variations anddata connections discussed in this report are limited to those that do display statisticalsignificance; this issue will be further discussed below.The data in Table 1, as elsewhere in this report, are of particular interest becausethey come from homeless individuals themselves. Some merely add telling details – suchas the comparatively high percentage of BOS respondents who have pets. Others offer asobering look at the fate of many Americans who are approaching middle age, a periodideally associated with raising families and pursuing careers. Many of these people havemany more years to live, but few apparent prospects for living well. The data on race andethnicity reflect the socio-economic and demographic realities of Arizona today: Whites(i.e., non-Hispanic Whites) are present in the survey population at roughly the samepercentage as they are in the total population, while Hispanics are underrepresented;African Americans are overrepresented, while Native Americans are proportionately farmore numerous on the street or in shelters than among Arizonans as a whole. Fortunately,children are also well underrepresented in the homeless population.Table 1 shows that most respondents found some sort of refuge on the nightbefore the survey was taken, mostly in shelters but also in someone’s home or, in a fewcases, in a hotel or motel. Still, well more than one-third of homeless Arizonans spentthat night outside or in a vehicle. And, for many, it was far from a new experience: Askedhow long they’d been homeless, responses averaged nine months; asked how many timesthey’d been homeless in the past three years, the average answer was more than twice.And many have had to cope with unstable lives since childhood: About 14 percent saidthey had been in foster care.The most commonly cited causes – both general and specific – for homelessnessin Table 1 are reviewed in some detail below. One rarely mentioned cause is having been5
in prison. It’s difficult to assess how candid respondents are in regard to this metric. Butgiven Arizona’s 40,000-prison population and the fact that it releases some 1,500 inmateseach month into a still-struggling economy, one could easily expect prison to be cited as acause more often than it was. One of the most striking contrasts in Table 1 is that betweenrespondents who say they want to find housing (91% overall) and those on waiting lists(19%). Given the increasing national adoption of “housing first” as a central strategyagainst homelessness, this disparity seems worthy of further examination. It is likely areflection of Arizona’s relative lack of affordable housing, which not only limits shelterfor the homeless but also keeps many other individuals and families teetering on the brinkof homelessness.Table 1’s section on income reflects the wide variety of potential financialresources for Arizona’s homeless, from children’s contributions to veterans’ disabilitypayments. However, it also displays what small percentages of respondents are receivingincome from most sources, whether due to ineligibility, ignorance of opportunity or otherreasons. Few respondents are working; most of those receiving income are doing sobecause of past work – pensions, disability, veteran’s status, retirement, etc. In any case,the statewide mean monthly income of 218.20 remains well below the federal povertylevel as well as the Arizona “living wage” as calculated by the Living Wage Project atMIT.The responses in Table 1 also illustrate the general similarities in service useacross the three geographic regions, with food and shelter topping the list. They alsoreflect the substantial utilization of services for physical and mental health – again fairlyuniform across the state; these services are likely to be impacted, perhaps heavily, by thecoming expansion of Medicaid in Arizona. Finally, Table 1 points out areas in whichservices for BOS are relatively underutilized, such as food assistance, employmentprograms and case management.Correlations in the DataThe goal of any analysis of survey data is to identify “levers” and “questions.”Levers refer to characteristics that can plausibly be affected by policy decisions. Forexample, the survey unsurprisingly identifies job loss as a key instigator of homelessness.Having this empirical evidence supports arguments for policies that reduce job loss. Ofcourse, this is not a simple task, but it is a plausible method to reduce homelessness.Data also help identify more useful questions. At the start of a research agenda,most questions begin with anecdotally supported brainstorming. While this is useful, itoften is not focused enough to provide many levers. However, it does confirm someconjectures and identifies more specific questions. This allows for the new survey totarget specific issues that are useful to policy makers.In this section we discuss several relationships identified in the data that arestatistically meaningful (see Methodology, p. 13). This begins the process of identifyinglevers. We then note some questions raised by the data for the next step in the research6
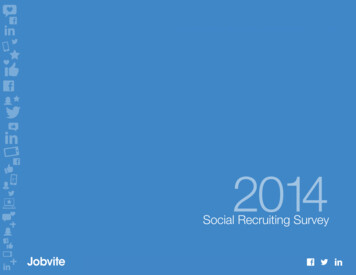
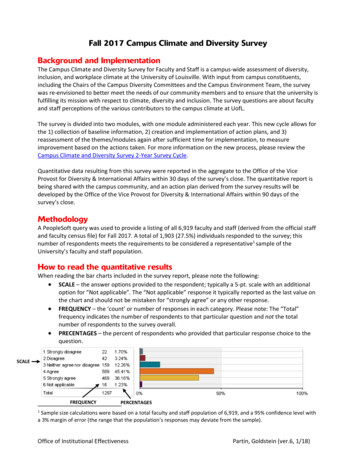
agenda. The goal is not of course to “solve” these complex issues, but to promote thenext iteration of questioning, data collection and knowledge production.Causes of HomelessnessAsked for a general explanation of why they were homeless, most statewiderespondents cited economic reasons (75 percent) followed by family issues (45 percent)and health reasons (37 percent; see100%Figure 1). Asked for a more specific75%80%reason, most (45 percent), as noted45%60%37%35%above, cited loss of a job – a reason that27%40%far outpaced other responses. A tie20%followed it at 16 percent between family0%conflict and alcohol use. However,looking more closely at these dataillustrates some potentially usefulconnections.Figure 1: Reasons for Homelessness (note: notFor example, the frequency of job mutually exclusive)loss as a reason for homelessness washigher among men than women acrossall age groups. However, it peaked at 3550%percent among women aged 25 to 34,40%while it peaked at 61 percent among men30%aged 35 to 44. This could be because17%20%many younger women may also be8%10%coping with raising young children and1%0%with family violence. Among men, itcould reflect the impact of ent just when workers wouldhope to be establishing themselves at ajob or trade, as well as the difficulty of Figure 2: Moved Cities as a Reason forlearning new skills and competing in Homelessness by Areatoday’s tight job market whileapproaching middle age. Job loss wascited as a specific cause of homelessness50%by a much higher percentage of Pima40%respondents than of those from the other26%30%two regions.20%16%12%10%In addition, BOS respondentswere more likely than those in Maricopa0%or Pima to cite “moved cities” as a reasonMaricopaPimaCountyRestoffor homelessness (Figure 2). This mayCountyArizonamean that the BOS homeless populationis more mobile – either by choice or by Figure 3: Alcohol Use as a Reason fornecessity – than those in the state’s two Homelessness by Area7
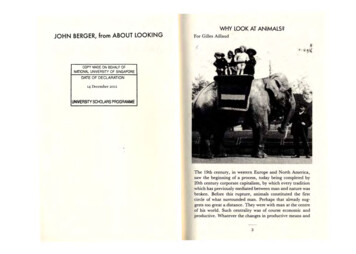
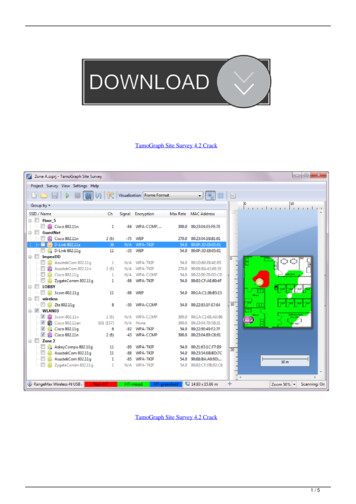
large population centers. BOS respondents were also more likely to cite alcohol use(Figure 3) and health problems (21 percent in BOS compared to 7 percent in Pima and 16percent in Maricopa); the latter finding may be in part due to a relative lack of medicalservices in BOS. On the other hand, Maricopa respondents also frequently (39 percent)cited health as a cause.Policy Questions about the Causes of Homelessness: Can Arizona do a better job of providing employment assistance to men in earlymiddle age?What’s behind the “moved cities” response among BOS respondents?Why do Pima respondents cite “job loss” at a significantly higher rate than otherrespondents?Family ViolenceAccording to the survey respondents, family conflicts and family violence loomlarge as causes of homelessness in Arizona. As noted in Figure 1, “familial” reasons weresecond only to economic issues as general causes cited for homelessness. Further, Figure4 notes that there were substantial differences by geographic region in the percentage ofrespondents citing familial reasons as a cause for homelessness. BOS respondents cited itmuch more often than the others, with Maricopa in second aCountyRestofArizonaFigure 4: Family as a Reason for Homelessness CountyLooking next at specific causes ofhomelessness, adding together thestatewide percentages of respondentsciting “family violence” and “familyconflict” indicates that more than onequarter of Arizona’s homeless individualsmay have become so at least in part due tofamily problems. In citing specific causes,BOS respondents mentioned familyconflict significantly more often (Figure5) than respondents from other areas.Family violence, on the other hand, is amore often cited as a cause ofhomelessness by respondents in MaricopaCounty and BOS (12 and 11 percent,respectively), and less so for those inPima County (3 percent). The data offerno reason why this should be the case.More importantly, the surveyhighlights the connection between familyviolence and homelessness, especially forwomen. Women respondents cited familyviolence as a cause of homelessnessnearly four times more often than menRestofArizonaFigure 5: Family Conflict as a Reason forHomelessness by Area8
(Figure 6). Single women with childrenwere especially at risk (Figure 7). Femalerespondents who described themselves assingle with one or more children citedfamily violence as a cause fully 30 percentof the time. Victims of family violence, onaverage, have 3 incidences ofhomelessness compared to 2 times forthose who are not victims.50%40%30%10% 5%0%MalePolicy questions aboutfamily violence: 18%20%FemaleFigure 6: Family Violence as a Reason forHomelessness by GenderHow can future inquiries betterdistinguish between “family conflicts” and “family violence?”Why did BOS respondents cite family issues as a cause of homelessness moreoften than other respondents?Why did Pima respondents cite family violence less often than others?How can Arizona better integrate services to its populations of domestic violencevictims and homeless women – populations that extensively rtnerwithchildFigure 7: Family Violence as a Reason for Homelessness by Gender and Family TypeMental IllnessEqually entangled with homelessness in Arizona is the problem of mental illness,which by itself afflicts hundreds of thousands of Arizonans, and, when untreated, isassociated with higher risks for such ills as poverty, failure at school and work, criminaljustice contact, early death, suicide – and, of course, homelessness. Statewide, 37 percentof the sample indicated that they received treatment for mental illness. Serious mentalillness, involving such severe afflictions as schizophrenia and bipolar disorder, is known,when untreated, to be a common affliction of the chronically homeless, who typicallypresent the most difficult and expensive cases to serve. Many resort to alcohol or drugs to“self-medicate.” Even lesser forms of mental illness are difficult topics to measure viasurveys, as some proportion of mentally ill individuals lack “insight” into their illness orare reluctant to acknowledge it.9
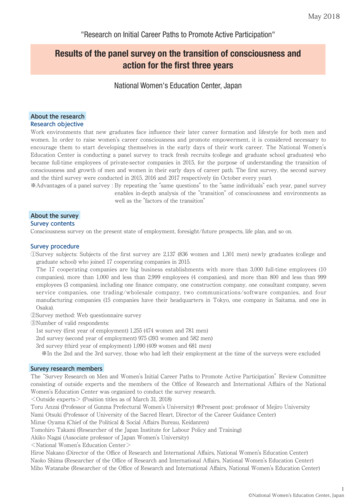
Among all respondents statewide,Table 1 shows that 14 percent citedmental health as a specific reason forhomelessness. However, Pima residentsmentioned it much less often than thosefrom Maricopa or BOS (Figure 8).Looking further into the data offersadditional information. For one thing,respondents who said they had receivedtreatment for mental illness reported 3periods of homelessness compared to 2periods for those who had not receivedtreatment. For another, they were twice aslikely to have cited a prison term as areason for homelessness (Figure 9).While this points to no clear conclusions,it is worth noting that Arizona’s jailscollectively constitute the state’s largestvenue for inpatient “treatment” of thementally ill, and that there is generalagreement that a high percentage of stateprison inmates are mentally ntyRestofArizonaFigure 8: Mental Illness as a Reason forHomelessness by Area50%40%30%20%12%5%10%0%YesNoSurvey respondents who had beentreated for mental illness were two-thirdsmore likely to have been hospitalized; 52percent compared with 31 percent. They also were nearly twice as likely to cite familyviolence as a reason for homelessness (13 percent compared to 7 percent) to cite drug use(20 percent compared to 7 percent) and, of course, to cite mental illness itself (28 percentcompared to 6 percent).Figure 9: Prison as a Reason for Homelessness byTreatment for Mental IllnessPolicy questions about mental illness: Why did respondents from Pima County cite mental illness as a cause much lessoften than other respondents?How can institutions such as prisons do a better job of preparing mentally illclients for release?Only a quarter of those treated for mental illness cited mental illness as a reasonfor homelessness; does mental illness lead to other factors that causehomelessness without itself necessarily being a direct cause?Use of ServicesThe survey offers indications that at least some of the state’s homeless mentallyill individuals are using services. Respondents who reported receiving treatment formental illness were more likely to use shelters (Figure 10). In addition, those treated for10
mental illness spend almost twice aslong in shelters than those who havenot been treated (8 vs. 5 months). Theywere also more likely to use soupkitchens, health care services and casemanagement (Figure 12).100%80%67%59%60%40%20%Survey findings also tended to0%reflect an overall paucity of services inYesNoBOS. Health care services (Figure 11)were also cited by many fewer BOSrespondents (28 Percent) than thoseFigure 10: Use of Shelters by Mental Healthfrom the two urban centers (40 percent). TreatmentEmployment programs (Figure13) were used by significantly morerespondents in Pima than Maricopa,and by more than twice as many as inBOS. Finally, case managementservices were cited by fewer than halfas many BOS respondents (Figure 14)than those in Maricopa or ountyRestofArizonaFigure 11: Health Care Service Use by AreaPolicy Questions about Service Use: Why don’t more homeless people use shelters? How can they be incentivized todo so?Many respondents said they had recently been on AHCCCS or some other healthinsurance program, and sizable segments said they used healthcare and eMgmt20%0%SoupKitchensFigure 12: Use of Select Services by Mental Health Treatment11TreatedNotTreated
health services. How will50%Medicaid restoration affect34%40%utilization of these services, and27%30%how can Arizona prepare forthis?14%20%Does the finding that10%respondents who had mental0%health treatment tended to useMaricopaPimaCountyRestofsome services more oftenCountyArizonaconstitute a policy success thatcould perhaps be enhancedFigure 13: Use of Employment Services by Areaand/or broadened?How can more services beextended to BOS homeless?How can Arizona act to create more affordable housing for homeless people andfamilies and those at risk of homelessness?Is service utilization a product of available services or is it a reflection ofdisparate needs?VeteransIn Arizona, as nationally,veterans are overrepresented in thehomeless population and often presentneeds related to a history of serioustrauma. This can include physicaldisability, Post Traumatic StressDisorder (PTSD) or Traumatic BrainInjury (TBI).In this survey, veterans citeddisabilities as a cause of homelessnesssignificantly more often than thepopulation as a whole (Figure 15).Veterans also were more likely tomention alcohol use as a reason(Figure untyRestofArizonaFigure 14: Case Management Service Use by Area50%40%30%23%20%15%On a more positive note, data10%collected through the HomelessManagement Information System0%(HMIS) indicates that Arizona’sVeteranNotaveteranpercentage of homeless veteransdecreased from 20 percent in fiscal yearFigure 15: Disability as a Reason for Homelessness2011 to 13 percent in fiscal year 2012.by Veteran Status12
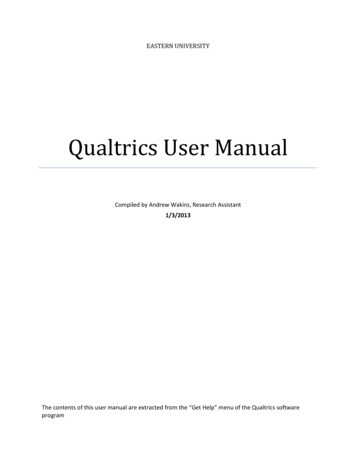
Policy Questions aboutVeterans: Arizona has received nationalrecognition for its policiesconcerning homeless veterans.Is this a “success story” that canbe replicated for other groups?50%40%30%20%16%8%10%0%How can Arizona meet theVeteranNotaveteranexpected increase in demand forservices from the influx ofreturning veterans from Iraq and Figure 16: Alcohol Use as a Reason forHomelessness by Veteran StatusAfghanistan, including agrowing population of femaleveterans?Native AmericansAlcohol use was frequently cited as a cause of homelessness by a broad range ofrespondents, and is clearly a core problem throughout this population. But it was mostoften cited, and by a large margin, by Native Americans (Figure 17). This is far from anew issue, but its importance and severity demand mention. Research has establishedethnic disparities in alcohol consumption and related disorders, notably higher rates ofalcoholism among Native Americans. Various studies by the Centers for Disease Controland Prevention and other organizations have also reported high incidences of heavydrinking, binge drinking and alcohol-related deaths among Native Americans than amongother racial/ethnic groups.13%15%15%14%AfricanAmericanHispanicWhite How can tribal and non-tribalpolicy makers better align theirefforts to reduce alcoholismamong Native Americanhomeless?What greater attempts can bemade to intervene earlier in thelives of Arizona’s NativeAmericans to prevent alcoholismfrom reaching such extreme anddestructive levels?36%Asian/Other 50%40%30%20%10%0%NativeAmericanPolicy Questions aboutNative Americans:Figure 17: Alcohol Use as a Reason forHomelessness by Race/Ethnicity13
METHODOLOGYThe comparisons of statistics by different groups that are noted in this report werescreened to meet a rigorous statistical standard. The differences in the report are directlyfrom the data, but the test was based on statistical estimations. To do this, we needed toestimate the differences across groups in such a way as to avoid falsely positive resultsdue to spurious relationships. For example, if we find an effect for gender (X) on somestatistic Y, but women are more likely to be affected by domestic violence (Z), the effectwe observe for gender may be caused by the domestic violence instead of gender. This isbecause the underlying pattern may be X Z Y, but without considering Z, we wouldthink X Y.To guard against this possibility, we employ statistical models that consider theeffects of each covariate while holding others constant. In other words, we are able toisolate the effect of X on Y, given any value of Z, and likewise the effect of Z on Y,given any value of X. We fit linear equations that predict various outcomes as a functionof all covariates. In doing this, we isolate the individual, or unique, effect of eachcovariate. Since the model includes the other factors as well, we are able to consider theeffect of any predictor while holding others constant.Once the models were fit using computer software, we estimated marginalpredictions for specific groups and tested whether these predictions differed. Weemployed simple t-test statistics where we calculated the difference between theestimates and divided this difference by an uncertainty parameter. If this ratio exceeded2, that was an indication that the likelihood of such a difference was small if the datawere collected from a population without such an effect. This logic, known as “rejectingthe null hypothesis,” implies that if what we observe is not likely given a nullassumption, then we can reject that null assumption in favor of an alternative narrativewhere there is a difference. This logic, combined with the inclusion of other covariates,allowed us to distinguish robust differences from plausible random artifacts of data.We fit several different types of models to estimate these differences, specific tothe distribution of the particular outcome. Where respondents slept the
Phoenix and Tucson areas and across the state. The survey was organized and supervised by the state's three Continuums of Care and was conducted in the summer of 2012. A survey pool of 2,030 was targeted, based upon estimates of homeless people drawn from the 2011 Street and Shelter Count. The survey proposed to interview 1,177 respondents