Transcription
2016 VIEWABILITY BEST PRACTICESFor U.S. Healthcare Publishers and AdvertisersPrepared By:R.J. Lewis, PresidentRenee Kennedy, Director of Digital Marketing & AnalyticsLauren Schulman, Director of Operations, Optimization & AnalysisLast Revised: 02/2/2016 2016 eHealthcare Solutions. All rights reserved.
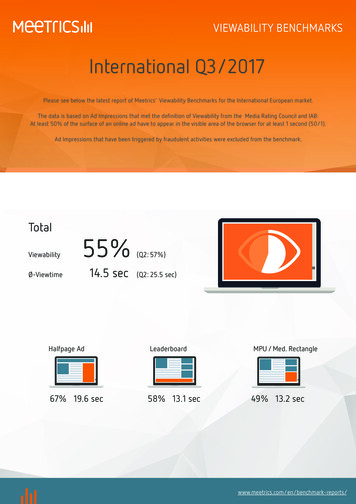
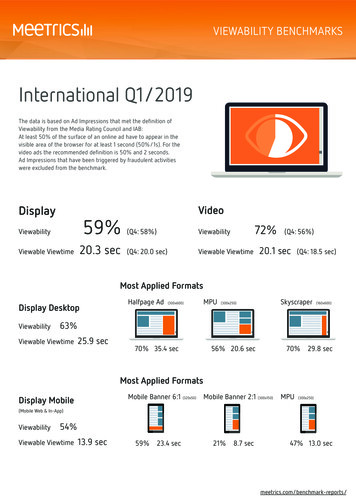
What is Viewability?Viewability is a metric used to determine if the ads on a website are actually being seen by visitors. An ad is considered “viewable”if 50% of the ad is visible for 1 second or more. Non-human traffic (NHT) is deeply integrated with viewability measurement. NHTis defined as traffic that comes from machines. Obviously, traffic from a machine means that the ad impression was not viewed bya human; therefore it should not contribute to in-view impressions. Both metrics need to be analyzed in order to understand whya specific campaign or website may be performing poorly for viewability.Throughout 2015, advertisers and agencies within the healthcare industry made strides to tie payment to viewability metrics,while publishers made efforts to improve their site viewability metrics. Viewability measurement tools also improved theirofferings.The following whitepaper will provide best practices, case studies and metrics to help both advertisers and publishers continue tomanage and improve viewability.Viewability Measurement ToolsViewability measurement programs are valuable additions to the digital marketing toolkit and provide excellent planning andoptimization opportunities. The Media Ratings Council (MRC) provides a list of 17 different vendors that provide viewability tools.However, it must be noted that there are discrepancies in viewability metrics between the different viewability tools. Viewabilitytechnologies are designed to ride along in the ad tag of each ad impression to measure whether or not each specific ad unit wasviewable when displayed, and determine if it was viewed by a human or a machine. Any Internet transaction requiring server hopscreates technical and latency issues that cause discrepancies between the different measurement systems—even when designedto measure the exact same thing. Every additional server call also adds its own latency to the loading of an ad. Performancemetrics, including viewability, are measured in milliseconds and it is important to keep efficiency within the coding—or riskhurting the user experience.For example, if you run Adobe Analytics (Omniture) and Google Analytics on the same exact pages, you will get different resultsfrom each. The same goes for viewability measurement tools and an ad server designed to count delivered impressions. If you getyour campaign impression counts from a publisher’s ad server, and those same counts from your agency ad server too, you willget different numbers. It’s not uncommon for mature technologies (like analytics and ad servers) to have discrepancies of about7% or more. Under 10% is considered to be “within an acceptable range” and not necessarily problematic or in need of deepinvestigation, while discrepancies over 10% are in need of a deeper investigation.However, in some cases, there has been up to a 40% discrepancy between viewability vendors. Sometimes, agencies oradvertisers will mandate a specific viewability vendor and solely use those metrics for payment. However, it is imperative thatpublishers have their own tool so that they can measure all of their ad campaigns (regardless of advertiser). Measuring all adssimultaneously with the same tool and analyzing the results will invariably help publishers improve placements for the larger goodof the site. Also, the reports provided to publishers by agency/advertiser tools are limited in information and may sometimes bedelayed.When choosing a viewability vendor, be sure the tool offers transparent explanations of NHT and how NHT is handled within theviewability metrics. There are subtle differences between vendors in the way their tools may measure NHT or calculate NHT intoviewability metrics. For instance, comScore has very robust NHT filters whereas Moat’s filters may be less robust but they aremore transparent about where the NHT is coming from. Publishers need to understand where the NHT is coming from in order toroot it out and deal with it. Advertisers and agencies need to be assured that the NHT is not malicious or fraudulent and that thepublishers they are working with understand NHT and are working to minimize it as much as possible.At eHealthcare Solutions we use a variety of viewability measurement tools including Moat, comScore, DoubleVerify, DoubleClickfor Publishers, DoubleClick for Advertisers, and Integral. We have an in-depth understanding of the different tools in order to helpall of our publishers and advertisers optimize campaigns to their full potential. 2016 eHealthcare Solutions. All rights reserved.1
Non-Human Traffic (NHT)If a site has an NHT higher than 3%, the publisher should analyze where that NHT is coming from and seek solutions to get rid ofit. With the publishers that eHS represents, NHT is rarely caused by fraudulent activity. More often, it is activity from automatedprograms the publisher may not even be aware of.One method of coping with NHT is to use a program that blocks machine traffic from the site. There are vendors, like WhiteOps,that offer programs that will identify fraudsters and then only allow the legitimate web requests through. However, first, apublisher might try less invasive techniques to rout out NHT. Viewability tools are a good place to start this process.Viewability tools will not only help to determine the amount of NHT, they can also help publishers find the root of the NHT inorder to block it. Unfortunately, there is no specific way to tell exactly where NHT is coming from with any viewability tool. This isbecause the tools are not allowed to render IP addresses for privacy’s sake. However, Moat has just recently come out with anenhancement that will show the referrers that are driving the NHT.Once an offender has been found, blocking can be accomplished through the ad server. For instance, if it is determined throughanalysis that a specific browser type may be the cause of NHT, targeting can be placed in the ad server to block that browser.However, this requires testing and further analysis to be sure that the browser is actually the cause of the NHT.Tips on finding out the source of NHT: Use your viewability measurement tool to determine the percent of NHT coming to your site. If it is higher than 3%, furtheranalysis and possible actions to remove the NHT are merited. As mentioned above, Moat has a new enhancement that willexpose the exact source of NHT in terms of the domain it may be originating from. However, most other tools may only showthe source of NHT in a general sense. They may not reveal the exact domain or IP address of where the NHT is coming from.The problem: In the example below, the first red flag is the high NHT%. Second, notice the NHT is coming from incongruousbrowsers and data center traffic. Third, outdated browsers and late night impressions seemed like standouts. In order todetermine these standouts, we compared this website to others in our publisher network. eHS has the advantage of datafrom over 80 websites and hundreds of ad campaigns running simultaneously.The solution: In the ad campaign, we blocked traffic from outdated browsers (not all of them) and this helped reduce abouthalf of the NHT. The other metrics also decreased. 2016 eHealthcare Solutions. All rights reserved.2
If nothing stands out from the viewability metrics, look at the referrals or sources of traffic in your site analytics (GoogleAnalytics, Adobe Analytics or others).The problem: In the next case below, the NHT% at 7.00% is a red flag. The other metrics show that the NHT is evenly spreadbetween Automated Browser, Incongruous Browser and Data Center Traffic.In Google Analytics, looking into the sources of traffic, the culprit should show up close to the top of the search. Other metricsincluding bounce rate, pages/session, and average session duration, can also help guide analysis. For instance, if the bouncerate was particularly high or the average session duration was low on a specific referrer, this might be a key to machineactivity.Drill down into any referrers that you don’t recognize or that have unusual metrics. What stood out for this example was aparticular referrer, simply because we didn’t recognize it. The chart below shows that specific referrer’s sessions against thepercent of NHT reported by Moat by day.25025%20020%15015%10010%505%00%% NHTSessionsReferrer Sessions against NHT%DaysNHT RateReferrer SessionsThe solution: Once the offender is recognized, you may take steps to understand why this is happening. In this case, wecommunicated with the referrer. After resolving the issue and taking another reading within Moat, the overall NHT droppedto 1.24%; the other NHT metrics also came down to reasonable levels. 2016 eHealthcare Solutions. All rights reserved.3
Mobile Responsive Sites & ViewabilityViewability does not always increase with the implementation of a mobile responsive site. This is because the publisher cannotmerely implement mobile responsive design: they must also implement responsive ad serving. This involves changing out largerad sizes for smaller ones, or not serving a larger ad when a person accesses the site on a mobile device. It also involves specificplacement of ads on the page in order to allow the ad to rise to the top of the page on a mobile device.In the following case study, the publisher site was mobile responsive, but not able to reach viewability standards on mobiledevices. They made the following changes: Since a 160x600 sized ad will not get good viewability on a mobile device (no matter where it’s located), the publisherdisables the 160x600 ad when a person comes to the site on a mobile device.A 728x90 also will not get good viewability on a mobile device because it does not appear in full (unless the creatives aremobile responsive, which in most cases they are not), so the publisher also made the 728x90 disappear when a personviews on mobile.The 300x250 was being pushed all the way to the bottom of the mobile device, due to placement below the content. Sothe publisher programmed the 300x250 to appear at the top of the mobile device (below the logo and navigation).BEFORE 2016 eHealthcare Solutions. All rights reserved.AFTER4
Results from the above changes: 106% increase in viewability on mobile devices In-View time decreased by -33%. However, benchmarks are 16 seconds on mobile and 25 seconds on desktop.Therefore, both in-view metrics are still well over benchmarks. And since, in this case, the publisher is not being paid onin-view time, they can stand the hit.MobilePrePost% DifferenceDesktopPrePost% DifferenceMeasurable ImpressionsIn-View le ImpressionsIn-View Impressions53,51679,90549%46,02269,93452%In-View %In-View Time (Seconds)35%72%106%In-View %2517-32%In-View Time (Seconds)86%88%2%4235-17%There are specific directions on how to implement mobile responsive ad serving in the eHS Mobile Responsive DesignWhitepaper. 2016 eHealthcare Solutions. All rights reserved.5
Changing Layout & Ad Placement for ViewabilityIn the following case study, the publisher was not reaching viewability standards on any level (mobile or desktop); the onlyposition that was working was the 300x250. They made the following changes: At top, moved the 728x90 from the top of the page to beneath the logo, directly above navigationOn right, put a combo ad higher on the page for any sizes within max width of 300 to max height of 600Removed 728x90 ad at the very bottom of the pageAdded a stationary/floating ad to the left side of the page, which will only show if the resolution of the browser allowsfor itAFTERBEFOREResults from the above changes: Moat: 101% improvement of In-View % with an increase of 40 percentage points. comScore: 72% improvement of In-View % with an increase of 25 percentage points.MoatPrePost% DifferencecomScorePrePost% DifferenceMeasurable ImpressionsIn-View %101%Measurable ImpressionsIn-View ImpressionsIn-View %112,532117,5594%39,80871,40879% 2016 eHealthcare Solutions. All rights reserved.In-View %35%61%72%6
Stationary/Floating Ad Placement for ViewabilityIn the following case study, the publisher tested usage of a floating ad. They made the following specific changes: Added a new placement that floats to the left of the regular body of the page; this placement tracks down the page asthe visitor scrolls down the pageIf the browser resolution is too small, the ad will not appear; therefore, it won’t be counted in the amount ofmeasureable impressionsAFTERBEFOREFloating Ad 2016 eHealthcare Solutions. All rights reserved.7
Results from the above changes: Floating Ad Results: 94% in view with 45 seconds in-view time! Total Results: increase of 25% for viewability and 2% for in-view time. In the metrics below, it is clear that this floating ad has a significant impact on overall viewability.160x600Measurable ImpressionsFloating Ad OnlyAll 160x60024,428Measurable ImpressionsIn-View Impressions23,056In-View ImpressionsIn-View %94%In-View %In-View Time (Seconds)45In-View Time 30-16%20%43%15%% Difference300 width comboMeasurable ImpressionsIn-View ImpressionsIn-View %In-View Time 51%54%2%-19%% Difference728x90Measurable ImpressionsIn-View ImpressionsIn-View %In-View Time (Seconds)Pre16,60415,26492%21Post6,9596,18989%20% Difference-58%-59%-3%-5%TOTALMeasurable ImpressionsIn-View ImpressionsIn-View %In-View Time 2%27-1%24%25%% Difference 2016 eHealthcare Solutions. All rights reserved.4%8
Lazy Loading Ad Placement for ViewabilityIn the following case study, the publisher tested a lazy loading ad placement. They made the following changes: At bottom of the page, replaced a 728x90 placement with a lazy load adThe ad within this placement is “lazy-loading” it will only come into view when a visitor scrolls to that part of the page.Lazy Loading AdResults from the above changes: 24% increase in viewability -18% decrease in viewable inventory In-View time remained the same728x90PrePost% DifferenceMeasurable ImpressionsIn-View Impressions187,162123,962-34%106,85387,831-18% 2016 eHealthcare Solutions. All rights reserved.In-View %57%71%24%In-View Time22220%9
Best Practices Checklist for Advertisers Strive for 70% viewability - According to a Sizmek Study, ads at a 70% in-view rate perform significantly better across allmeasured impressions (performance includes CTR and engagement). Use interactive formats - Sizmek also reports that viewable rates increase as advertisers adopt more interactive formats:1. Flash Rich improves viewability over Flash Standard2. HTML5 improves viewability rates over Flash Use different creative sizes - Provide different creative sizes to fit with Publisher’s placement needs and for testing. Also,sizes not in the norm have a higher % in-view, according to Moat’s Q4 2015 Benchmarks:300x1050 – 76%300x600 – 65%970x66 – 65%970x90 – 62%970x250 – 60%160x600 – 58%300x250 – 53%728x90 – 49% Use Mobile – But be sure the ads are being served responsively! Sizmek finds:1. Mobile-specific-sized creative has a higher viewability than desktop-sized creative2. Mobile-specific unit-sized ads were more viewable than desktop for both publisher direct and DSPs/exchanges(programmatic) Be selective with Programmatic - Ads served direct to publishers increase viewability over ads served via programmatic. Be selective with Publishers – A viewability rate around the norm of 54% for desktop and 44% for mobile generallymeans quality content. A low viewability rate under 35% could mean Non-Human Traffic and possible Ad Fraud; it couldalso mean a poorly designed web site or poor quality content. Be vigilant about your viewability metrics – Drill down to the following metrics that you have control over:1. Creative Sizes2. Creative Types3. Mobile v. Desktop 2016 eHealthcare Solutions. All rights reserved.10
Best Practices Checklist for Publishers Rich, Deep Content (in-depth, quality content) will encourage visitors to stay engaged with the page. Higher engagement willkeep visitors on the page longer and give ads a better chance of being viewed for 1 second or more. Reduce Latency by making sure that all ad tags are up-to-date. Ad tags calling multiple servers increase latency; usingoutdated ad tags may cause latency. Streamline code so that the page loads as quickly as possible, which maximizes the chance of keeping ads in view asvisitors move down the page. If the ad is not immediately viewable, a visitor could scroll by it in under a second. Build a responsive design site and use responsive ad serving so that regardless of the browser version(Chrome/Firefox/IE) or device version (mobile/desktop) the site and ads will render correctly in every instance. Lazy loading, smart loading, or “just-in-time” ads are a solution for long content pages. The lazy loading ad isprogrammed to render only when the viewer scrolls to the area of the page where the ad is placed. Ad placement should be as close to your content as possible; top of the page is not necessarily the best place. Placementjust above the fold has proved the best place for the highest viewability rates. Fixed place positioning can keep ads in place and in view as visitors scroll down the page. Implement stationary adsoutside of the content area. Consider placing a stationary ad either on the right or left sides. This is a good solution ifyou can’t immediately redesign the site for better placement within the content. If placed at the top of the page,consider keeping the top navigation stationary, as well. Quality of ad placement, not quantity is best practice with a maximum of 4 ads per page. The size of the creative will affect viewability; test to find out what placements will work best with your content. Placement of content should be considered. For instance, a juicy headline right above the fold will engage visitors andkeep them scrolling down to read more. Track viewability metrics to figure out what is working for your particular content on particular pages and be willing toadjust frequently. Metrics to watch that you have control over:a. Placement of ads on the page is an important criteria. If a specific placement is continually underperforming,consider removing it. If many of the placements are underperforming, consider a redesign.b. If the creative sizes you have open placements for aren’t working, try different sizes. Sometimes, just expanding theright side of the page may provide you with more size options. For instance, expanding from a 160x600 skyscraperto a 300x250 box or 300x600 half page, may help your viewability if size is the issue. 2016 eHealthcare Solutions. All rights reserved.11
2016 VIEWABILITY BEST PRACTICES For U.S. Healthcare Publishers and Advertisers Prepared By: . viewability metrics. For instance, comScore has very robust NHT filters whereas Moat's filters may be less robust but they are . In-View time decreased by -33%. However, benchmarks are 16 seconds on mobile and 25 seconds on desktop. .

