Transcription
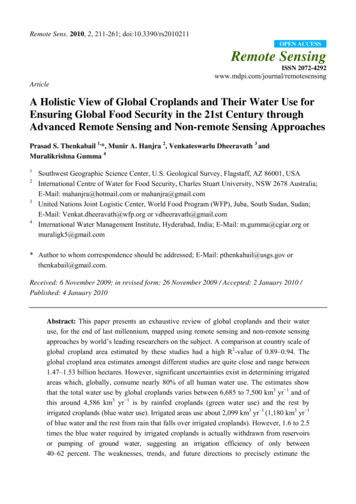
Remote Sens. 2010, 2, 211-261; doi:10.3390/rs2010211OPEN ACCESSRemote SensingISSN A Holistic View of Global Croplands and Their Water Use forEnsuring Global Food Security in the 21st Century throughAdvanced Remote Sensing and Non-remote Sensing ApproachesPrasad S. Thenkabail 1,*, Munir A. Hanjra 2, Venkateswarlu Dheeravath 3 andMuralikrishna Gumma 41234Southwest Geographic Science Center, U.S. Geological Survey, Flagstaff, AZ 86001, USAInternational Centre of Water for Food Security, Charles Stuart University, NSW 2678 Australia;E-Mail: mahanjra@hotmail.com or mahanjra@gmail.comUnited Nations Joint Logistic Center, World Food Program (WFP), Juba, South Sudan, Sudan;E-Mail: Venkat.dheeravath@wfp.org or vdheeravath@gmail.comInternational Water Management Institute, Hyderabad, India; E-Mail: m.gumma@cgiar.org ormuraligk5@gmail.com* Author to whom correspondence should be addressed; E-Mail: pthenkabail@usgs.gov orthenkabail@gmail.com.Received: 6 November 2009; in revised form: 26 November 2009 / Accepted: 2 January 2010 /Published: 4 January 2010Abstract: This paper presents an exhaustive review of global croplands and their wateruse, for the end of last millennium, mapped using remote sensing and non-remote sensingapproaches by world’s leading researchers on the subject. A comparison at country scale ofglobal cropland area estimated by these studies had a high R2-value of 0.89–0.94. Theglobal cropland area estimates amongst different studies are quite close and range between1.47–1.53 billion hectares. However, significant uncertainties exist in determining irrigatedareas which, globally, consume nearly 80% of all human water use. The estimates showthat the total water use by global croplands varies between 6,685 to 7,500 km3 yr 1 and ofthis around 4,586 km3 yr 1 is by rainfed croplands (green water use) and the rest byirrigated croplands (blue water use). Irrigated areas use about 2,099 km3 yr 1 (1,180 km3 yr 1of blue water and the rest from rain that falls over irrigated croplands). However, 1.6 to 2.5times the blue water required by irrigated croplands is actually withdrawn from reservoirsor pumping of ground water, suggesting an irrigation efficiency of only between40–62 percent. The weaknesses, trends, and future directions to precisely estimate the
Remote Sens. 2010, 2212global croplands are examined. Finally, the paper links global croplands and their wateruse to a paradigm for ensuring future food security.Keywords: croplands; remote sensing; water use; virtual water; food security;water productivity1. IntroductionGlobal change is putting unprecedented pressure on global croplands, vital for ensuring future foodsecurity for all. Declining per capita agricultural production requires immediate policy responses tosafeguard food security amidst global climate change and economic turbulence. The precise estimationof global croplands and their precise location are critical scientific tools for any policy response [1–3]at a time when most indicators point to worsening food security situation [4–6]. For instance, worldfood stocks are fast dwindling [7], cropland areas have nearly stagnated, yield per unit area haveplateaued [8], world population is increasing at nearly 100 million per year [9], croplands are beinglost to biofuel production [10], salinization [11], and urbanization [12,13], and nutritional transition israising the calorie intake swiftly in emerging markets due to economic change [14]. Already, recentglobal trends suggest that grain production increases are becoming more difficult to achieve as a resultof increasing population, and as the competition for water intensifies between agriculture, cities andthe environment [15]. There is a need to reduce the environmental footprint of food production.Declining per capita agricultural production and warming oceans are emerging threats to global andregional food security [16]. The drop in grain production in the Northern China Plain, which producesover half of China’s wheat and a third of corn, from its peak of 392 million tons in 1998 to 338 milliontons in 2003 (a drop equivalent to Canada’s entire harvest) has been attributed to the decliningwatertables and resulting loss of irrigated areas [17]. This is significant, since just a 3% drop inChina’s cereal production will claim 10% of the world export market and can potentially jeopardizeglobal food security [18]. Also, in China’s Yangtze Delta, for example, rice paddy areas havedecreased by a dramatic 22% over the last six decades, while an increase has been seen for urban areas(8%) and aquaculture (14%) [19]. Global wheat stocks reached historic lows this decade and wheatprices increased by about 30% in 2008 [20], resulting in further structural changes in global grainmarkets, and increased rice prices in recent years have also endangered food security [14,21]. Theglobal food outlook and price trends remains pessimistic and appear set to continue [22] over themedium term to 2015 [7], a year when the progress towards eradicating world hunger and otherMillennium Development Goals will be judged by the United Nations [23]. Food commodityspeculation and derivatives are a new cause of malnutrition [24]. Continuous food crisis will be newglobal norm unless international agricultural research and investment efforts are directed to find longterm solution to the world food security crisis [25].Increasing cropland areas for food security may not be feasible, due to potential negativeenvironmental impacts of the area expansion [26]. For instance, land use land cover (LULC) changes,specifically deforestation for crop production, are shown to have a stronger influence on ecosystemcarbon budgets than the projected climate change scenarios [27]. Cropland soils hold the key to
Remote Sens. 2010, 2213terrestrial carbon (C) sequestration as well [28,29], accounting for 0.5–0.7 GtC yr 1 in mid-century [30].The contribution from agricultural no-till soils by itself be about 40% by mid-century [30]. At currentlevels, agricultural croplands account for 50% of methane (CH4) and 60% of nitrous oxide emissions [31].Irrigated rice paddies are a major source of atmospheric CH4 [32,33].Above all, croplands are also water guzzlers [34], taking anywhere between 60% and 90% of allhuman water use. With increasing urbanization, industrialization, and other demands on water, there isincreasing pressure to reduce agricultural water use. Conversion from natural vegetation to irrigatedcropland also means greater water use. When large tracts of a river basin are converted from naturalvegetation to irrigated croplands, they will result in a substantial reduction in the volume of water instreams. Recent research in Brazil using Landsat data showed that the regional mean ET for irrigatedcrops was 3.6 mmd 1, being higher by an order of magnitude than for natural vegetation (1.4 mmd 1) [35].The above factors imply that there is a need to produce more food from existing or even reduced(a) areas of croplands (more crop per unit area); and (b) quantum of water (more crop per drop). Morecrop per unit area (crop productivity) along with crop intensification led to the Green Revolutionduring 1960–2000, that helped build food barriers against episodes of hunger [36] and lifted millionsout of malnutrition and poverty [37]. But, the Green Revolution has more or less stagnated lately, anddeclining yield gains are failing to keep up with population growth. More crop per drop (waterproductivity) is a concept that has yet to take off, but holds much promise amid caution [38]. In orderto produce more food from existing croplands and water resources, precise maps and data on croplandsand their water use are needed.Thereby, emerging strategies for feeding the growing population in spite of the stagnated and evendecreasing cropland areas will be to [1]:(A) grow less water consuming crops (e.g., more wheat and less rice);(B) increase water productivity through better water management and increasing irrigationefficiency;(C) educate people to eat less water consuming food (e.g., more vegetables and grains compared tomeat; more local and seasonal foods); and(D) emphasize rainfed crop productivity to reduce stress on water-intensive irrigated croplands.For planning these strategies and related incentive measures, we need to know the precise spatiallocation of agricultural crops, their water source (e.g., irrigation and/or rainfed), land use changes (e.g.,biofuel vs. food crops), and water use patterns (e.g., water productivity maps). Such an effort will helpagricultural policy makers and managers to plan and implement strategic goals of food securitythrough renewed investments in agriculture, education and markets [25,37] and direct involvement oflocal governments and farmers to enhance the future food security [39 this issue].Given the above background, the overarching goal of this paper is to produce a holistic review ofthe current state-of-art on information pertaining to global croplands and their water use with the aimto work towards a strategy for a food secure world. The main purpose of the paper is to identify theweaknesses and trends in existing methods and approaches and provide future directions to preciselyestimate the global croplands. More precise estimates of global croplands are essential for futurefood security.
Remote Sens. 2010, 22142. Global CroplandsGlobal croplands include irrigated and rainfed lands, but do not include pasture and rangelands.Cropland mapping at the global level [40–42] has become feasible by integrating agricultural statisticsand census data from the national systems with spatial mapping technologies involving geographicinformation systems (GIS). More recently, availability of advanced remote sensing data along withsecondary data and recent advances in data access, quality, processing, and delivery have made remotesensing based cropland estimates at the global level possible [1,2]. The specific remote sensingadvances enabling global cropland mapping and generation of their statistics include factors such as:(a) free access to well calibrated and guaranteed data such as Landsat and (Moderate ResolutionImaging Spectroradiometer) MODIS; (b) frequent temporal coverage of data such as MODIS backedby high resolution Landsat data; (c) free access to high quality secondary data such as long-termprecipitation, evapotranspiration, surface temperature, soils, and Global Digital Elevation Model(GDEM); (d) global coverage of the data; (e) web-access to data and faster download; (f) advances incomputer technology; and (g) advances in processing. Prior to this, irrigated and rainfed cropland areaswere estimated, at large scale, in global land use classifications [43–47] derived from remote sensing,which usually focused on other objectives, such as LULC for forestry, rangelands and rain-fedcroplands. Most remote sensing work at regional level produced LULC maps and not specific thematicmaps like croplands. The Global Land Cover Map produced by USGS [43] using Advanced VeryHigh-Resolution Radiometer (AVHRR) 1-km data had four irrigated classes: irrigated grassland, ricepaddy and field, hot irrigated cropland, and cool irrigated cropland.Currently, there are four main global cropland maps produced in recent times for the end of the lastmillennium. These are:1. Thenkabail et al. [1]—Figure 1;2. Ramankutty and Foley [48] —Figure 2;3. Goldewijk et al. [42]—Figure 3; and4. Portmann et al. [41] and Siebert and Döll [49]—Figure 4.Globally, cropland areas increased from 265 Mha in 1700 to 1,471 Mha in 1990, while the area ofpasture increased more than six fold from 524 to 3,451 Mha [50]. By these estimates, agriculture andpasture cover about 33% of the world’s land area. Foley et al. [51] and Ramankutty and Foley [48]estimate cropland and pasture to be nearly 40% of the world's terrestrial surface (148,940,000 Km2).The first remote sensing based global cropland estimate [1,2] for the nominal year 2000 showed globalcroplands as 1.53 billion hectares (Figure 1, Table 1). However, in all these studies, there is substantialscope for improvement in the precise spatial location of croplands, their characteristics (e.g., croppingintensity, crop calendar, type of crop grown), and their area estimates.The four major global cropland studies [1,2,40–42,49] estimated total cropland areas between 1.30to 1.53 Bha. Ramankutty et al. [40] (Figure 2) and Goldewijk [42] (Figure 3) do not differentiatebetween irrigated and rainfed cropland areas whereas Thenkabail et al. [1,2] (Figure 1) andPortsmann et al. [41] (Figure 4) and Siebert and Döll [49] (Figure 4) provide distinct irrigated andrainfed cropland statistics. A country-by-country comparison between cropland area estimates ofdifferent studies showed very high correlations. As shown in Figures 5a and 5b Ramankutty et al. [40]used a combination of agricultural statistics and remote sensing to determine cropland areas of 197
Remote Sens. 2010, 2215countries that were highly correlated (R2 value of 0.89) with the remote sensing based estimates ofThenkabail et al. [1,2]. Similarly, even though Portsmann et al. [41] and Siebert and Döll [49] usednon-remote sensing approaches involving agricultural statistics and GIS and Thenkabail et al. [1,2]used remote sensing approaches, a comparison of cropland areas derived using two products for the197 countries showed remarkable correlation with R2 value of 0.94 (Figure 5b). Nevertheless, variouscoarse resolution cropland area mappings have two highly significant differences: (A) Precise spatiallocation of these cropland areas; and (B) Estimates of irrigated areas versus rainfed areas.Both of these are crucial for water use assessments and practical applications of the data includingfood security planning. In addition to cropland maps and statistics, there are two premier globalirrigated area maps and statistics. These are:5. Thenkabail et al. [1,2]—Figure 1; and6. Siebert et al. [52]—Figure 4.These two premier products on irrigated areas are also referred as: (1) The International WaterManagement Institute’s (IWMI) global irrigated area map (GIAM), which is based on coarseresolution remote sensing [1,2,53,54]; and (2) Food and Agricultural Organization of the UnitedNations and the University of Frankfurt (FAO/UF’s) global map of irrigated areas (GMIA), which isbased on national statistics [52] (Figure 4, Table 1). The Siebert et al. [52] study provides estimates ofglobal area “equipped” for irrigation (but not necessarily irrigated) as 278.8 Mha, which is about 19%of the total croplands (1.5 Bha) around the year 2000. The Thenkabail et al. [1,2] study provides twotypes of areas: (a) total area available for irrigation (TAAI), which does not consider croppingintensity, and (b) annualized irrigated areas (AIA) which considers the intensity. The TAAI, which isequivalent to FAO/UF’s “areas equipped for irrigation” definition, was 399 Mha (Figure 1). This isnearly 120 Mha higher than FAO/UF estimates. The main differences occur in China and India. TheAIA, which has no equivalent in FAO/UF statistics, was 467 Mha.The importance of irrigation to global food security is highlighted in a recent study by Siebert andDöll [49] who show that without irrigation there would be decrease in production of various foodsincluding dates (60%), rice (39%), cotton (38%), citrus (32%) and sugarcane (31%) from their currentlevels. Globally, without irrigation cereal production in irrigated areas will decrease by massive 43%,with overall cereal production, from irrigated and rainfed croplands, decreasing by 20%. As theworld’s population grew from 2.2 billion in 1950 to 6.1 billion in 2001, irrigation played a major rolein tripling of the world grain harvest from 640 million tons to 1,855 million tons [17]. Irrigatedagriculture currently meets about 40% of global food needs from just 20% of the area that is irrigated.Khan et al. [55] studied irrigation systems in Australia, China, and Pakistan to show that none of themwere sustainable in the current operational conditions as a result of soil salinity [56], lack of adequatewater resources, groundwater mismanagement, and the mismatch between water policy andenvironmental policy for agricultural sustainability [11]. In contrast, rainfed croplands meet 60% ofthe food and nutritional needs of the world’s population from 80% of the global croplands. Irrigatedlands are at least twice more productive than rainfed croplands though the latter are considered moreenvironmentally friendly, and remain important to the food security of the marginal or subsistencefarmers in many developing countries [1,2,57].
Remote Sens. 2010, 2Figure 1. Global cropland map by Thenkabail et al. [1,2]. This includes irrigated andrainfed areas of the world as well as permanent crops. The product is derived usingremotely sensed data. Total area of croplands is 1.53 billion hectares of which 399 millionhectares is total area available for irrigation (without considering cropping intensity) and467 million hectares is annualized irrigated areas (considering cropping intensity). Theproduct is derived using 1–10 km base data. The output is given in nominal 1–kmresolution. Also see: http://www.iwmigiam.org.Figure 2. Global cropland map by Ramankutty et al. [40] and Ramankutty and Foley [48].This includes irrigated and rainfed areas of the world as well as permanent crops. Totalarea of croplands is 1.47 billion hectares. The product is derived using national agriculturalcensus data and remote sensing derived land use. The output is given in nominal 5-min(0.083333 decimal degrees) resolution.216
Remote Sens. 2010, 2Figure 3. Global irrigated cropland area map by Goldewijk et al. [42]. This includesirrigated and rainfed areas of the world as well as permanent crops. Total area of croplandsis 1.47 billion hectares. The product is derived using national agricultural census data andremote sensing land use. The output is given in nominal 5-min (0.083333 decimaldegrees) resolution.Figure 4. Global irrigated cropland area map [52]. This includes only areas “equipped” forirrigation in the world. Total area of irrigated croplands is 278 Mha. The product is derivedusing the national agricultural census data and GIS. The output is given in nominal 5-min(0.083333 decimal degrees) resolution.217
Remote Sens. 2010, 22183. Uncertainties in Cropland Area EstimatesUncertainties in cropland estimates (Table 1) are well established [1,58]. The greatest difficulty anddifferences in global cropland estimates is in differentiating between rainfed croplands versus irrigatedcroplands. This is also the most crucial difference because water use assessments and food productionestimates depend heavily on whether an area is irrigated or rainfed.A country-wise assessment of global irrigated areas using a remote sensing approach [1,2] (irrigatedareas in Figure 1) and a non-remote sensing approach [52] (Figure 4) showed a clear trend with highcorrelations (R2 value between 0.89 and 0.94; Figures 5a and 5b). However, there are highlysignificant differences for China and India—the two countries with nearly 60% of all annualizedirrigated areas of the world.Figure 5a. Cropland areas per year (annualized) compared for 197 countries [1,2, versus 40].Cropland areas include irrigated and rainfed crops as well as permanent crops. Ramankuttyet al. [40] used national agricultural statistics fused with remote sensing data whereasThenkabail et al. [1,2] used advanced remote sensing approaches. There is remarkably highcorrelation (R2 value of 0.89) for the 1:1 line for comparison, at countries scale, of croplandareas between the two approaches. However, large differences in areas for some countriesare clear. Reasons for the differences are discussed in the paper.
Remote Sens. 2010, 2219Figure 5b. Cropland areas per year (annualized) for 197 countries [1,2, v
global cropland area estimated by these studies had a high R2-value of 0.89–0.94. The global cropland area estimates amongst different studies are quite close and range between 1.47–1.53 billion hectares. However, significant uncertainties exist in determining irrigated areas wh