Transcription
Capturing the opportunity from new consumer trendsPatrice Bula: EVP, Strategic Business Units, Marketing and Sales1 September 26, 2017 Nestlé Investor Seminar 2017
DisclaimerThis presentation contains forward looking statements which reflectmanagement’s current views and estimates. The forward lookingstatements involve certain risks and uncertainties that could causeactual results to differ materially from those contained in the forwardlooking statements. Potential risks and uncertainties include suchfactors as general economic conditions, foreign exchangefluctuations, competitive product and pricing pressures and regulatorydevelopments.2 September 26, 2017 Nestlé Investor Seminar 2017
Being relevant to a new generationThe right productsExperiencesbeyond productEarn trustBe authentic andbenefit society- Clean recipes- Natural ingredients- Proximity- Authenticity- Convenience- Discovery- Enable self-expression- Be share-worthy- Transparency- Empathy- Engaged- Our purpose and values- Elevate social dimensions(CSV)3 September 26, 2017 Nestlé Investor Seminar 2017
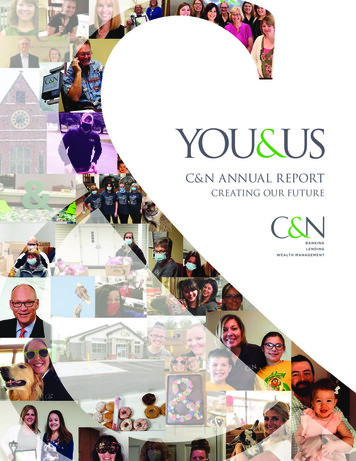
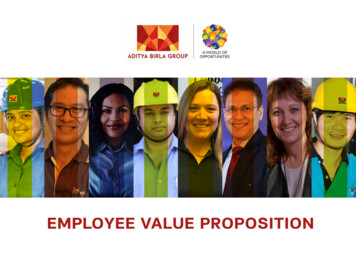
Changing Nutrition, Health and Wellness (NHW)expectations are leading to new growth opportunitiesEstimated market size in 2016* (CHF billion) 3%195 bn-1%136 bn 10%33 bnNatural**“Free-from”/reducedPlant-based 4%19 bnOrganic 7% 8% 12%7 bn4 bn3-6 bnLactose-freeHighprotein***Gluten-free(Reduced fat, sugar,salt, carbs, caffeine)Source: Euromonitor data 2016, in Nestlé-relevant categories* Market size based on retail sales price, CAGR % 2010-2015** Naturally Healthy: Food & beverage on the basis of naturally containing a substance that improves health & wellbeing beyond the product’s pure calorific value*** High protein data not available directly, as new categories are investing in high protein variants. High protein supplements and nutrition products estimated at CHF 9 bn; meat analogues and vegetarian products estimated at CHF 1.5 bn. Roughestimate related to Nestlé categories : CHF 4 bn.4 September 26, 2017 Nestlé Investor Seminar 2017
Consumer expectations are holistic, multi-dimensionaland intertwined5 September 26, 2017 Nestlé Investor Seminar 2017
Our core strategy: driving our portfolio transformationat scaleIntegrating new NHWdimensions into our core brands6 September 26, 2017 Creating new brandsNestlé Investor Seminar 2017Acquiring “born pure” brandsand accelerating their growth
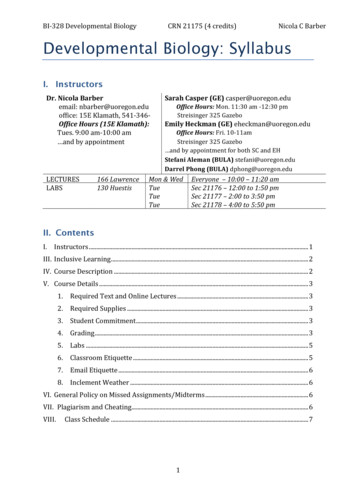
Example: driving “naturalization” of our petcare portfolioat scale“Naturalizing” the core portfolioCHF 375 million*, 51% CAGR**Creating new brandsCHF 154 million*, 54% CAGR***Sales FY 2016, **CAGR (2014-2016)7 September 26, 2017 Nestlé Investor Seminar 2017Acquiring “born pure” brandsAncestral dietsRegionally-sourcedHuman-grade qualityProtein-packed for active dogsCHF 381 million*, 26% CAGR**
Integrating organic as part of our brand offerInfant formula & baby foodFood2016 - 2018: U.S.2017: ChinaDairy2016: China, Mexico2017: ASEAN, Middle EastCoffee2017: U.S., EUR, Mexico8 September 26, 20172016 - 2017: U.S. Nestlé Investor Seminar 20172018: EUR2018: U.S.Ice cream2016: Italy
Authenticity: telling genuine brand storiesWaters9 September 26, 2017Nescafé Nestlé Investor Seminar 2017Uncle TobysIce cream
Proximity: locally-sourced ingredientsLean CuisineCailler10 September 26, 2017 Nestlé Investor Seminar 2017Herta
New “free-from / high-with” dietsGluten-freeLactose-freeReduced sugarHigh-protein7% avoid gluten4% avoid lactose56% of European adultconsumers reducing sugar75% of consumers increasingprotein intake11 September 26, 2017 Nestlé Investor Seminar 2017
Accelerating gluten-free new product offering withsuperior organolepticsFoodCereals2017: EUR2015 : U.S.2016: EURMaggi food service range2016: UK & Ireland, Australia, New Zealand, Germany, Switzerland, U.S.12 September 26, 2017 Nestlé Investor Seminar 20172017: U.S., Italy2016: EMENA, Mexico, Caribbean, CentralAmerica2016-2017: U.S., Canada,EMENA, Australia
Lactose-free: gaining momentum in LATAM, AOA, aswell as premium nutritionDairyNestlé Nutrition2016: Chile, Indonesia13 September 26, 20172016: Brazil Nestlé Investor Seminar 20172016: Brazil2016: LATAMIce cream2016: Switzerland
Naturally reducing sugarDairyConfectioneryUp to 30% reduced sugar14 September 26, 2017No added sucrose Nestlé Investor Seminar 2017Up to 30% reduced sugar
High-protein productsDairyFood2016: U.S.15 2017: AustraliaSeptember 26, 2017 2017: U.S.Nestlé Investor Seminar 2017Cereals2016: EURIce cream2018: U.S.
Plant-based dietFlexitariansVegetariansVegansDecide to reduce meat protein intake andactively seek plant-based alternativesDo not consume meat, fish or poultry butmay eat eggs / dairyConsume food and drink only fromplant sources( 14% globally)( 4% globally)( 2% globally)16 September 26, 2017 Nestlé Investor Seminar 2017
Offering plant-based alternatives across categories atscaleStarting from a solid baseAccelerating with new launchesMilk-free17 September 26, 2017 Nestlé Investor Seminar 2017FoodScaling up acquired “ born pure”brands
Offering healthier grain-based snacking acrossmultiple occasions and life stagesChildren’s breakfast18 September 26, 2017 Grain-based snackingNestlé Investor Seminar 2017Handheld snacks
Premiumization: authenticity, simplicity and nobleingredientsIce creamCulinary2017: U.S.19 September 26, 20172016: Mexico, ASEAN Nestlé Investor Seminar 2017Confectionery2017: EMENACoffee2018: EMENA
Accelerating Coffee growth through premiumizationand new experiencesPremiumization20 September 26, 2017Cold coffee Nestlé Investor Seminar 2017Blue Bottle coffee
Novel personalized experience and delivery modelsNespressoChocolatory2017: 15 boutiques 66 pop-ups**pop-ups: 1 to 3 weeks during festive seasons21 September 26, 2017 Nestlé Investor Seminar 2017Direct delivery of personalizedmenus
Novel personalized services and productsPersonalized PetcareNutritionChildren / MotherNutritional service70’000 kits sold22 September 26, 2017 Nestlé Investor Seminar 2017Nutrition for SeniorsNespresso “ for Chefs ”
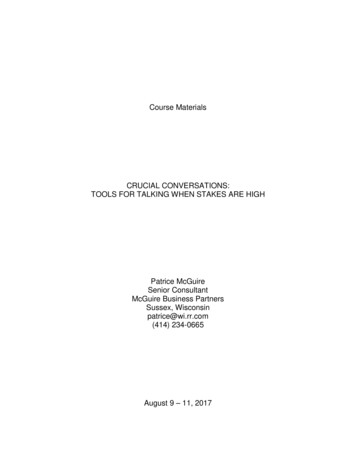
Connecting with a new generationMillennial-centric platform choicesMobile first creative designDigital media spend above FMCG industry averageNestléFMCG average40%30%30%25%20%10%0%2012201320142015Source: Nestlé media agencies23 September 26, 2017 Nestlé Investor Seminar 20172016When you recycle, yourused coffee grounds canbecome green energy.
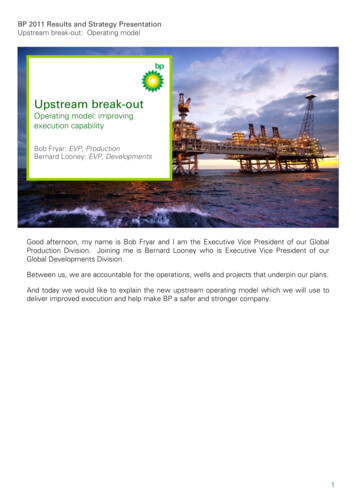
Empirically measured, externally recognizedcreative effectiveness% of aired Nestlé ads in top copyeffectiveness quartile*Effie effectiveness index 2017, Food63%0100Nestlé57%Peer 1Peer 242%Peer 3FMCG normfor aired ads(37%)Peer 4Peer 5Peer 6Peer 7Peer 820142015*Copy effectiveness measured using Millward Brown Short Term Sales Likelihood(STSL) Index. Database includes both aired and non-aired ads24 September 26, 2017 Nestlé Investor Seminar 20172016Peer 9Source: Effie Effectiveness Index worldwide 2017, Food Category200300
“Non-working” creative excellence working hardfor our brandsNespresso U.S.Felix Europe327%Felix FranceMain brandedcompetitor inFrance15%21%22%16%56%112%Main brandedcompetitor inUK201459%44%Share ofvoice109%2015Category growth2016201725%18%36%Effectiveshare of voiceSource: Millward Brown – Share of voice vs. Effective share of voice Nespressogrowth2013Felix UK25256%September 26, 2017 Nestlé Investor Seminar 2017Exposed to TV ad40%24%BrandawarenessNot exposed to TV ad4%PurchaseconsiderationSource: UBS Global Research August 2017; Kantar TNS Brand Tracker
26Nescafé SA)Milo(India)Purina Beyond (Global)Illuma(China)Nespresso(USA)Nespresso «the choices we make»(Global) September 26, 2017 Nestlé Investor Seminar 2017
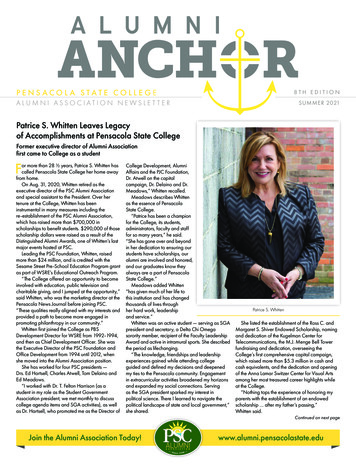
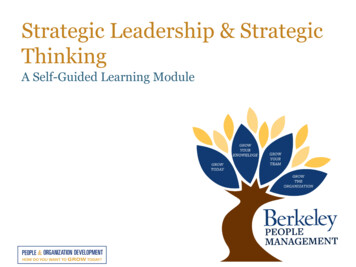
Media effectivenessOutperforming competition in media buyingEnhanced transparency and data integrity20% cost advantage vs. industry benchmarksNestlé online video viewability indexed to industry average1.8100%1.680%1.41.21.0Industry averageviewability0.8Nestlécost indexBenchmarkcost index0.6Q2’15Source: Audit of markets representing 80% of global media spend27 September 26, 2017 Nestlé Investor Seminar 2017Q3Q4Q1’16Q2Q3Q4Q1’17Q2Q3Source: Moat, an independent vendor for measuring viewability, brand safety, fraud and attention ofonline advertising. Industry average is among Moat clients for Q2 2017. All data desktop mobile.
More than CHF 500 million in savings have beenreinvested in productive brand building Media vendornegotiations Competitiveagency reviewsProductivespendWorkingmedia* Marketing spend cost savings 2015, 2016 and projected 201728 September 26, 2017 InefficientspendNestlé Investor Seminar 2017Inefficientspend Productivespend Non-workingmediaResearch agencynegotiationsCompetitive reviewsProduction decouplingE-auctionsDigital agencyconsolidationCreative agency feemanagement
In summary We are integrating consumers’ new NHW expectations across ourentire portfolio Acquired ‘born pure‘ businesses will bring additional sources ofgrowth, as well as inspiration Our brands will continue to strive to connect and dialogue withconsumers through creative excellence, new digital layers of servicesand personalization We will continue to gain efficiency in all dimensions of our brandbuilding It is less about “big food” vs. small brands, than it is about greatbrands genuinely answering new consumer expectations29 September 26, 2017 Nestlé Investor Seminar 2017
Thank you30 September 26, 2017 Nestlé Investor Seminar 2017
online advertising. Industry average is among Moat clients for Q2 2017. All data desktop mobile. Enhanced transparency and data integrity Nestlé online video viewability indexed to industry average Q2'15 Q3 Q4 Q1'16 Q2 Q3 Q4 Q1'17 Q2 Q3 0.6 0.8 1.0 1.2 1.4 1.6 1.8 Industry average viewability Outperforming competition in media buying