Transcription
Principles and applications of flow cytometryPeter NagyDepartment of Biophysics and Cell Biology, University of Debrecen Principles of the device Flow system Optical parts Measurement, display and analysis of signalsRepresentative applications Immunophenotyping, DNA content, cell cycle, FRET, ion concentrations, multiplexingapplications1/51
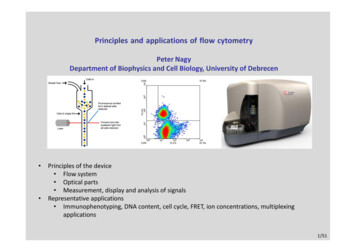
Principles of flow cytometryAn instrument which measures the fluorescence and light scatter parameters of suspended single cells with high speed (as high as several thousandcells/sec)Flow cytometryTypes of cellsSingle cell resolutionMeasured parametersuspendedsingle cells (nosubcell. resolution)fluorescent andlight scatterFluorescencemicroscopysuspended andattachedsingle cells withsubcell. resolutionsuspended (orattached)mainly fluorescentmainly fluorescentFluorometrypopulationSpeedseveral thousandcells/seca couple of cells/secN.A.Manipulationsortingmanipulation ofsingle cells2/51
The working principle of flow cytometrysamplesheath fluidpiezoelectriccrystal oscillatorfluorescencedetectorslaser beamsheathfluidlight scatter detectorcoredeflector condenser plates3/51
Fluidicssheath fluidsample fluidThe sheath fluid surrounds the sample in concentriclayers (laminar flow).In this way the sample fluid is centered (focused) intothe middle of the stream (hydrodynamic focusing).Purpose of hydrodynamic focusing:The cells shall be where the laser beam illuminates them.Hydrodynamicfocusing of inksheath fluidlaser beamTop view of a flowcell (nozzle)4/51
Hydrodynamic focusingBernoulli equation:v 3 , p31p v 2 gh const.2p2 p1v2 v1v3 v2 v1 v0(v0 0)forcep0v0If investigated at a given height (h):1p v 2 const.2If velocity (v) increases, pressure (p) must decrease.Laminar flow: concentric layersof fluid flowing with increasingspeed towards the center.p0 p1 p2 p3A cell is forced to move towards thecenter of the stream due to thepressure gradient.5/51
Cell sortingsampleVibration of the piezoelectric crystal breaksthe stream into droplets.sheath fluidpiezoelectriccrystal oscillatorfluorescencedetectorslaser beamsheathfluidlight scatter detectorcoreDroplets become positively or negativelycharged according to their measured lightscatter and fluorescence parameters.deflector condenser plates: charged with a constant voltage6/51
jet-in-air:IlluminationTop view of a flow cellDETECTORflow cell(nozzle)laser beamLENS with small NAemittedlight.stream inthe airlaser beamcuvette: a much higher% of emitted light isdetected.flow cell (nozzle)LENS with high NADETECTORlaser beam7/51
Light:Properties of light and fluorescenceBoth the electric and magnetic field are vectorquantities, i.e. they have magnitude and direction.520 nm long-pass (LP):630 nm band-pass (BP)white light620-640 nmwhite light 520 nm550 nm dichroic mirror:575 nm short pass (SP): 550 nmFluorescence:excited statewhite light 575 nmwhite lightexcitationfilterlaser lineground stateexcitationspectrum 550 nmemissionfilteremissionspectrum After excitation the molecule gets back to the lowest(vibrational) level of the first excited state. Everysubsequent process start from this level. Fluorescence has a longer wavelength than excitation light.wavelength8/51
DetectorsphotonPhotodiode: primary (photo)electron many secondaryelectrons amplification ( ): number of electrons 100number of photonsfinal number of electrons 100number of photoelectronse.g. every dynode emits 10 secondary electrons,and there are 8 dynodes:depletionzone- quantum yield ( ): 108 high quantum yieldp-typelight-induced impulsen-typePhotomultiplier (PMT):cathodewindow A- two modes: 1. no voltage, 2. reverse biasAvalanche photodiode:anodeamplifiedsignalincomingphotons zero amplificationdynodesan increasingly positive voltage is applied to the dynodes,and the accelerated electrons evoke several secondaryelectrons when they impinge into the dynodes low quantum yield high amplification a high reverse bias isapplied to the dynode, andthe photoelectrons areaccelerated to such anextent that they inducesecondary electrons ( 0) combines the goodproperties of photodiodesand PMTs high quantum yield high amplification drawback: high darkcurrent9/51
Comparison of detectors10/51
Signal to noise ratio in flow cytometry The quality of flow cytometric data is determined by the signal to noise ratio. The signal to noise ratio can be characterized by two factors: detection efficiency (Q), a.k.a. quantum yield ( ): number of photoelectrons produced permolecule of fluorophore background light level (B)due to the Poisson natureof photon countingnoise nrelative noise n1 nnThe relative noise is inverselyrelated to the square root of thenumber of photons.The Q factor was reduced by decreasing the laser intensity (while maintaining the brightestpopulation in the same mean channel by increasing the detector voltage) resulting in the lossof resolution.11/51
Arrangement of detectors I.flow cellfluorescencedetectorslaser(s)side scatter detector(SSC)forward angle lightscatter detector (FSC)12/51
Arrangement of detectors II.Excitation at the same place with different lasers:band-pass filtersPMT3PMT2PMT1PMT4575 BP525 BP675 BP 600 DL550 DLdichroic mirrors488 BP488 DLilluminating lasercellsBeams separated from thecommon beam by dichroicmirrors are further filteredby band-pass filters.FSCSpatially separated excitation:detectors forphotons excitedby the blue laserspatiallyseparatedlaser beamsmirrordetectors forphotons excitedby the red lasermirrordetectorsexcited by thegreen laser13/51
Arrangement of detectors III.PMT 5PMT MT 3PMT 2PMT 1laserband-passfilter14/51
Arrangement of detectors IV.New development: octagon or trigon arrangement of detectorsAdvantage and principles: The detector closest to the site of emission records the highest wavelength fluorescenceusually having the fewest photons. Lower wavelength photons are reflected to the rest of the detectors by (high-pass) dichroicmirrors. Light reflection is usually more efficient than transmission.green filterdichroic 1blue filterdichroic 1red filter15/51
Arrangement of detectors V.New development: spectral flow cytometryFilter 1 detector 1ConventionalFilter 3 detector 3Det 4Det 1Filter 2 detector 2Det 2Det 3Conventional detection: low number of detectors wide wavelength range of detectors limited number of fluorophores canbe separated (see compensationlater) not all photons are detectedFilter 4 detector 4A large number of detectors (e.g. 16)each with a narrow wavelength rangeSpectral detectionachieved by prisms (ormonochromators)Spectral detection: whole spectrum is recorded (withlow resolution) with a large number of detectors all photons detected many fluorophores can beseparatedSpectral detection achieved by a series of filters,mirrors and an array detector. Spectral 16/51
Light scatter signalsThe intensity of light scatter signals (both FSC and SSC) depends on the index of refraction of cells (how different it is from the index ofrefraction of the surrounding buffer) the orientation of cells relative to the laser beam factors specific to FSC and SSCSSC signal: proportional to theinternal granularity of cellsFSCSSCFSC signal: proportional tocell sizeSSCFSC17/51
Detection of signalsSignal detected by thedetector:heightareawidth18/51
Data storageData are usually saved in a so-called FCS (flow cytometry standard) file in which every measured pieceof data is recorded for every cell (list-mode file).headerIdentifies the file as FCS anddescribes the length of the textsegment.text FIL pi04.LMD INST EPICS DIVISION OF COULTERCORPORATION CYT Elite DATE 04-Jan-80 BTIM 19:21:30 SRC tr110901 SMNO 1TESTNAME Peter FITC/pmt4 lin/logTESTFILE Pe000093.PRO BYTEORD 12 DATATYPE I NEXTDATA 0 MODE L P1N FS P1S FS P1R 1024 P1B 16 P1E 0,0 P2N PMT1. TOT 25114dataCell 1Cell 2Cell 3.FSC674898648SSC334393417FL1873799937.19/51
Data resolution Most biological parameters span several (3-4) orders of magnitude. Most flow cytometers used to have 10-bit resolution (because detectorswith a higher resolution were prohibitively expensive), i.e. fluorescenceintensities were recorded with a resolution of 10 bits (210 1024). The capability to measure 3 orders of magnitude difference influorescence intensity is not sufficient, therefore logarithmic amplifierswere used which compressed the high intensity part of the scale100101 102101023 041031023 2564321023 51241041023 768441023 10234fluorescenceintensityLOG(fluorescence intensity)general formula: lg fl resolution logfldecades Modern detectors record fluorescence data with 16-bit (or similar) resolution(216 65536) no need for log amplifiers.20/51
Display of data I.One dimensional (one parameter) display: histogramthe same data onlogarithmic scalelinear scale13375Count100Count1778944 contracts the scale in thehigh intensity range5025010Advantages of 500200 many biological parametersshow log-normaldistribution which seem tobe a bell-shaped curve on alog scale.Disadvantages: cannot display zero andnegative values so-called binning artifactBinning artifact: it seemsthat the low intensitypopulation is stretched tothe left and a lot of cellsaccumulate in the firstchannel.21/51
Scale typesRel. freq. of cellsLinear0.0200.100.040.0050.02Rel. freq. of cells20010.02040060080010000.00-40Fluorescence intensity-20020406080Binning artifact on logscale.100Solution:Fluorescence intensity0.100.080.015such a scale which is linear atlow intensities and logarithmicat high intensities: hyperlog(HL) scale (Cytometry, 64A, uorescence intensity110100Fluorescence intensity0.100.020Rel. freq. of cells2.0.060.0100LogLow intensity populationis unresolved on linearscale, and it is resolvedon log scale, BUT0.080.0150.000Hyperlog1.d 10, b 0.1r0.0150.080.06LIN 10d 10, b 0.1rLIN 100.0100.040.0050.020.000071945119 340Fluorescence intensity10290.00-40dxHLr-413Fluorescence intensity100dxHL 1, if xHL 0rd b xHL 1, if xHL 0r bd xHLrFind xHL, so that the equations issatisfied.1-2. On the HL scale both populations are resolved, and there is no binning artifact.22/51
Two dimensional (two parameter) display:1. dot plot: two measured parameters aredisplayed on the x and y axes, every dot in theplot corresponds to a single cell. Drawback: ifmany cells are displayed, dots may become4confluent. 10Display of data II.2. density plot: the color of dots correspondsto the number of 1-H3104103. contour plot: dots with identical cell numbersare connected with lines110210FL1-H3410104. 3D (surface) plot: the number of cells isdisplayed on the z axis (rarely 0410100101102FL1-H10310410E0FL4-H23/51
Regions, quadrants and markers:tools to identify L1-H103104Region: a set of points selectedby the user that specifies an areain a 2D graph.Several regions can be defined inthe same 7%CountFL4-H104FL4-H100110102FL1-H310104Quadrant: rectangularselection of 4 areasdiscriminating positive andnegative cells on both axes of a2D graph.010101102FL4-H310104Marker: selection of cells ina histogramRegions can have differentshapes (rectangular (DP),polygon (DP) and oval (SP)).24/51
What can we do with regions,quadrants and 2%000101X GeometricMean102FL1-H103Y GeometricMean1010410% of A Gate110102FL1-HX GeometricMean310Y GeometricMean100410% of A llCells10Marker11023FL4-H% of 6.92 the identified clusters can be analyzed separately statistics can be calculated on the whole population and onthe regions, quadrants or markers25/51
Gating1024321024512Lympho25624CountFL4 distributionof all measuredcells768SSC-HSSC-H76816512lym pho2560FL4-H0104103102101256512FSC -H7688102400256512FSC-H7680102410FL4 distribution ofcells in the red(lymphocyte) gate0101210FL4-H103104A gate can be defined as one or moreregions/quadrants/markers combined usinglogical operators (AND, OR, NOT)16100100110210FL1-H10341012Defines a subset of the data to be displayedor analyzed.4Only the gatedcells 10FL1-H10310110210FL4-H310410 Used to compute statistics andcharacterize the subset of events selected Get rid of unwanted events, e.g. cell debris426/51
StatisticsMeasures of central tendency:nMean:0.050.04nMedian:median 99the central value which divides the distributioninto two equal parts (boundary between the blueand orange areas)Mode:the value with the highest frequency0.02The mean is shifted substantially by thepresence of the contamination, whereas themedian is a more robust estimate of centraltendency.0.01050ii 1mean 104mede 1050.03mean x100150200250The distribution was contaminated by a high intensity subpopulation:0.05Measures of dispersion:SD: the dispersion of values around the mean x x nSD mean 1420.04median 1040.032ii 1n 1Coefficient of variation (CV):mode 105CV SD100meandescribes the relative width of the distribution0.02Robust SD (rSD): rSD 1.4826 median of0.01 Xi median X Robust CV (rCV):050100150200250rCV 100 rSD median X 27/51
StatisticsThe distribution of many biological parameters is log-normal the logarithm of the parameter, and not the parameter itself, follows a normal distribution distribution of the parameter is skewed toward large valuesParameters of the normal distribution: 20 3Statistics of the normally-distributed, bluehistogram (arithmetic) mean: 19.99 geometric mean: 19.76 Parameters of the log-normal distribution: 20 Parameters of the normal distribution characterizingthe distribution of the logarithm of X. 3Statistics of the log-normally distributed, redhistogram (arithmetic) mean: 36.53 geometric mean: 19.97The geometric mean is often used due to the common occurrence of the log-normaldistribution in biology.28/51
Flow cytometersCoulter Epics EliteBecton Dickinson FacsVantage DiVaBecton Dickinson FACScanBecton Dickinson FacsArray29/51
543 nm excitation488 nm excitationA488, exc.A488, em.A546, exc.A546, em8040500-560BPA488channel I A 488 I A546 S A546 A 488A488channel – measured fl. intensity in the A488channel200400If two fluorescent dyes (Alexa488,Alexa546) are examined, every measuredparameter is a mixture of the contributionof both dyes.450500550600650700wavelength (nm)A similar equation holds for the A546 channel:IA488, IA546 – „pure” fluorescence intensities ofdyes A488 and A546S A546 A488 – spectroscopic constantcharacterizing the overspill of A546 emission tothe A488 channelA546channel I A546 I A 488 S A 488 A54630002500S factors are determined with samples labeled only with one dye(e.g. with A488), which should appear in horizontal or verticalposition after compensation.A546 channelFluorescence intensity10060Compensation 00060008000 10000A488 channel30/51
Compensation II.In compensation pure intensities devoid of spectral overspill are calculated.Simple case: one-way spillover, e.g. SA546 A488 0, SA488 A546 0A488channel I A 488 I A546 S A546 A 488A546channel I A546I A 488 A488channel A546channel S A546 A 488More complex case: two-way spillover, i.e. SA546 A488 0,SA488 A546 0A488channel I A 488 I A546 S A546 A 488A system of equations with two unknowns has to be solved.A546channel I A546 I A 488 S A 488 A546I A 488 A488channel A546channel S A 546 A 4881 S A 546 A 488 S A 488 A 546I A546 A546channel A488channel S A 488 A5461 S A546 A 488 S A 488 A546Logarithmic scale often shows amisleading picture after compensation:it seems to be undercompensated.31/51
Compensation vs. spectral unmixingI1I2I3Conventional1stF1 – concentration offluorophoreS1,2 – spectral overspill of 1st fluorophore to the 2nd detectorI4I1 F1 F2 S2,1 F3 S3,1 F4 S4 ,1I2 F1 S1,2 F2 F3 S3,2 F4 S4 ,2 I3 F1 S1,3 F2 S2,3 F3 F4 S4 ,3 I4 F1 S1,4 F2 S2,4 F3 S3,4 F44 unknowns (F1-F4),4 equationsF1-F4 can be calculated I1 F1 F2 S2 ,1 .I1 - I32 I2 F1 S1,2 F2 .4 unknowns (F1-F4), 32 equationssystem of equations is overdeterminedbut it can be „solved” by optimization.I32 F1 S1,32 F2 S2,32 . measured spectrum of samplereference spectra offluorophores Spectral32/51
Compensation vs. spectral unmixingI1I2I3Conventional1stF1 – concentration offluorophoreS1,2 – spectral overspill of 1st fluorophore to the 2nd detectorI4I1 F1 F2 S2,1 F3 S3,1 F4 S4 ,1I2 F1 S1,2 F2 F3 S3,2 F4 S4 ,2 I3 F1 S1,3 F2 S2,3 F3 F4 S4 ,3 I4 F1 S1,4 F2 S2,4 F3 S3,4 F44 unknowns (F1-F4),4 equationsF1-F4 can be calculated I1 F1 F2 S2 ,1 .I1 - I32 I2 F1 S1,2 F2 .I32 F1 S1,32 F2 S2,32 . 4 unknowns (F1-F4), 32 equationssystem of equations is overdeterminedbut it can be „solved” by optimizationApproximation of the measured spectrumwith a combination of the reference spectraMore photons detected more accurate measured spectrum of samplereference spectra offluorophores Spectral33/51
Mass cytometry The number offluorophores selectivelydetectable at the sametime is limited due to theproblem of spectraloverlap. Antibodies can be labeledwith stable metal isotopes,typically lanthanides. Cells are ionized in an ICP(inductively coupledplasma) followed by TOFMS (time-of-flight massspectrometry) The amount of eachisotope is quantified in acell-by-cell basis. Data is presented andanalyzed similar to flowcytometry. Bendall, S. C., G. P. Nolan, M. Roederer, and P. K. Chattopadhyay. 2012. A deep profiler's guide to cytometry. TrendsImmunol 33:323-332. Bandura, D. R., V. I. Baranov, O. I. Ornatsky, A. Antonov, R. Kinach, X. Lou, S. Pavlov, S. Vorobiev, J. E. Dick, and S. D.Tanner. 2009. Mass cytometry: technique for real time single cell multitarget immunoassay based on inductively coupledplasma time-of-flight mass spectrometry. Anal Chem 81:6813-6822. www.dvssciences.com/34/51
Optical properties of quantum dots (qdot, QD)Compensation is not necessary, if such fluorescent dyes are used which have narrow emissionspectrum, so only one fluorescence detector detects them. Quantum dots meet these ndelectronBohr radius5.6 nm(CdSe) wide excitationspectrum Narrow emissionpeak Great photostability(no photobleaching)Due to the wide excitation spectrum a single laser (e.g. 488 nm) canexcite several different quantum dots whose fluorescence can bedetected without spectral overspill by different detectors as a result ofthe narrow emission spectrum.2 nm3 nm5.5 mm35/51
Immunophenotyping with flow cytometry suitable for the investigation of suspended or easily suspendable cells cell surface antigens (or intracellular antigens of fixed and permeabilized cells) are labeledwith monoclonal antibodies. In clinical practice primarily labeled antibodies are usually used.BBACgreen intensityCCred intensitynumber of cellsAB – double negativeA – single positiveC – double positiveBAUsage:green intensity diagnosis of leukemias AIDS diagnostics (CD4 lymphocyte count)36/51
Problem:Counting CD4 lymphocytes in AIDS patients in Africa(www.cytometryforlife.org) 65% of new HIV infections occur in 3rd world, resource-poor countries (e.g. sub-Saharan Africa) progression of AIDS can be monitored by counting the number of CD4 lymphocytes (CD4 count) CD4 counts are usually determined by flow cytometry in developed countries flow cytometers are too expensive for 3rd world countriesSolution: development of such a specialized, dedicated platform, which is simple, cheap and does not needservice such instruments can practically only determine the CD4 count, but cheaplyE.g. Guava EasyCD4 (www.guavatechnologies.com) microcapillary-based flow cytometer it does not need day-to-day adjustment, it can be used in harshenvironments37/51
Cell cycle and DNA content analysisnucleus1. cells are fixed and permeabilized so that the DNAspecific dye can gain access to DNA2. the DNA-specific dye (e.g. propidium iodide) gets to thenucleus and binds to DNA stoichiometrically3. measured fluorescence intensity is proportional to the DNAcontent of the cellsApplication areas: cancer cells have higher than normal DNA content higher S and G2/M fraction apoptotic cells are characterized by sub-G1 DNA peakG1% 79%S% 16%G2/M% 3%G1 intensity 216human diploid cellG1% 40%S% 39%G2/M% 20%G1 intensity 309JIMT-1 (human breast tumor cell) 38/51
FRET (Förster-type resonance energy transfer or fluorescenceresonance energy transfer)donoracceptorexcitedstateground state After excitation the molecule gets back to the lowest (vibrational) level of the first excitedstate. Every subsequent process starts from this level. The acceptor molecule is in the close vicinity of the donor in FRET. The acceptor moleculereceives the energy of the donor in a radiationless transition. FRET is manifested in emission of a photon by the acceptor after exciting the donorThe rate constant of FRET isdescribed by the following equation:k FRET const Jn k f R 4 62FRET efficiency (E) depends steeply onthe donor-acceptor distance (R):R06E 6R0 R 6R0 – the distance at which E 50%E – the fraction of exciteddonors relaxing by FRET39/51
Measurement of FRET by flow cytometry I.Sensitized emission: excitation of theacceptor through the donor (the acceptorfluoresces after donor excitation, FAD –acceptor fluorescence intensity in thepresence of donor; FA – acceptor fluorescenceintensity in the absence of donor) FAD Ac AE 1 FA D cDdonoremissionProblems: it is impossible to excite the donor specifically it is impossible to detect the acceptorspecificallySpillover between the fluorescencechannels has to be rexcitationacceptor emissionfilterwavelengthdonor excitationdonor emission in thewavelengthacceptor channeldirect acceptorexcitation40/51
Measurement of FRET by flow cytometry II.I1 ex , D , em , D I D (1 E ) I A S 4 I D E S 4S2donor channelI 2 ex , D , em , A I D (1 E ) S1 I A S 2 I D E FRET channelI 3 ex , A , em , A I D (1 E ) S3 I A I D E S3S1acceptor channeldonorsignalS1 I 2, DI1, DS3 I 3, DI1, DacceptorsignalS2 I 2, AI 3, AFRETsignalS4 I1, AI 3, A I 2 D LDI1 A L A1 I1 ( S1 S 2 S 3 ) I 2 ( S 3 S 4 1) I 3 ( S 2 S1S 4 ) E A 1 E I1 ( S 2 S 3 / S1 1) I 2 ( S 4 / S 2 S 3 S 4 / S1 ) 41/51
Measurement of FRET by flow cytometry III.Fluorescent labeling of cellsacceptorFRETdonorexcitationDonor (e.g. CFP)labeling by antibody or FabFRETemissionAcceptor (e.g. YFP)fusion protein labeled byGFP or one of its spectralvariants42/51
The application of FRET for the measurement of intracellularenzyme activity and ion concentrationProtease sensor:Calcium sensor:FRETYFPCFPCFPYFP- Ca2 e.g. caspasesensitivelinker 4 Ca2 FRETCFPCFPno FRETYFPNature, 388, 882.43/51
FRET-based sortingCytometry, 67A, 86.Unsorted1000A800800600600FRETNon-sorted yeast cells, in which cellsshowing and do not showing FRET aremixed.1000CFP-Kip1Yeast cells were transfected with YFPCDK2-vel and CFP-Kip1.40020020000200 400 600 800 10000200 400 600 800 TCFP-Kip1 both donor and acceptor fluorescence high intensity in the FRET channel400200SortedD400200000200 400 600 800 10000200 400 600 800 1000Relative frequency of cellsYFP-Cdk2In the sorted population only cells showingFRET were present.B4000Cells were sorted according to gatesdisplayed in A and B, and the sorting waschecked. Those cell were sorted 0.040.020.000204060FRET (%)44/51
Measurement of ion concentrations, membrane potential and intracellularenzyme activity1. The hydrophobic, acetoxy methyl ester(AM) form of the indicator gets acrossthe membrane.MDR1 pump2. It is hydrolyzed in the intracellular spaceby non-specific esterases.indicatornonspecificesterase3. The released hydrophilic indicator is notable to get across the membrane of livingcells, so it is trapped intracellularly.indicator-AM4. The fluorescence of some indicatorsdepends on the ion concentration of thesurrounding ement of multidrug resistance: MDRproteins pump the indicator and/or its AMform from the intracellular space. Calcein issuch in indicator, which does not indicateanything, i.e. its accumulation, or the lackthereof, is measured in cells showing MDR.Negatively charged oxonol is distributed inthe intra- and extracellular spaces accordingto the membrane potential (Nernst equation).After depolarization the amount of oxonol inthe intracellular space, hence thefluorescence intensity of the cell, increases.Name of indicatorMeasured parameterBCECFpHFURA-2, INDO-1, Fluo-3Ca2 SBFINa PBFIK fluorescein-diacetate(FDA)viability, since the dye is not(very much) sensitive toanything, only its accumulationis measured in the intracellularspacecalceinmultidrug resistanceoxonolmembrane potential45/51
Multiplex bead analysisbead 1cytokine Abead 1cytokine Aintensity 231intensity 1bead 2cytokine Bbead 2cytokine Bbead 2cytokine B42bead 3cytokine Cbead 3cytokine Cbead 3cytokine CEach beadpopulation isanalyzedseparately.number of cellsbead 1cytokine ABeads with different colors.Different, cytokine-specificantibodies are bound to each ofthembead 4cytokine DA cell lysate or serum is added to themixture of these beads. An amount ofcytokine proportional to theconcentration of the cytokine in thelysate or serum binds to the bead.bead 4cytokine Dbead 4cytokine D3 and 21A cytokine specific, detectingantibodies labeled with a fluorescentdye with a color different from thatof the bead is added to the beads.The antibody binds to and labelscytokines already bound to the beads.4antibody fluroescence intensityThe beads can be runsimultaneously on a flowcytometer.Advantage: the concentrationof many citokines (or otherproteins) can be measured atthe same time.46/51
FCB: fluorescent cell barcodingNat. Methods, 3, 361little blue, little green(A)controlmuch blue, littlegreen (B)stimulus 1little blue, much green(C)stimulus 2much blue, muchgreen(D)stimulus 3Cells are mixed and labeledwith an antibody with adifferent color.Cells are fixed, permeabilized andlabeled with fluorescent dyes withdifferent color and concentration.Ablue intensityDBEachpopulation isanalyzedseparately.Advantage:cell numbergreen intensityCBDACantibody fluorescence intensity low antibodyconsumption many samples can beanalyzed at the sametime47/51
In vivo flow cytometryCancer cells can be tracked inlymph vessels in vivo.Cancer Res 67:8223 (2007)In vivo imagingOlympus OV100Fluorescently labeled cells can be investigated in living animals and analyzed ina similar way to conventional flow cytometric analysis. Cancer Res 64:5044(2004), Nat. Rev. Canc. 3: 921 (2003)48/51
Transition between flow cytometry and microscopyFlow cytometry analysis of many suspended cells automatically without subcellular resolutionImaging flow cytometry: imaging of cells moving in the fluid stream the fluorescence intensity of cells is measuredsimilarly to a flow cytometer, histograms and dotplots can be created similarly to a flowcytometer cells selected in one- and two-dimensionalhistograms can be traced back colocalization and morphological analysis can becarried out on the cellsMicroscopy: analysis of few attached cells with a huge workload subcellular resolutionLaser scanning cytometry (LSC): investigates cells attached to a slide the whole slide (i.e. not only a microscopic field) isscanned with a low NA objective cells are identified automatically morphological and colocalization measurements canbe done with the cells the fluorescence intensity of cells can bedisplayed in one- and two-dimensional histogramssimilarly to flow cytometrymeasurement of many cells automatically with subcellular resolution49/51
Imaging flow cytometry1. Cells flow in a flow cell similarly to flowcytometry.3. Images are saved by the device .2. Not only the total (or maximal)fluorescence intensity of cells ismeasured, but images are also taken.4. . and the fluorescence intensity data of cells can beanalyzed in a similar way to flow cytometry.50/51
Laser scanning cytometry (LSC)1. The microscope slide is scanned by a laserbeam.2. The software identifies cells based on nuclearstaining, and the nucleus and the cytoplasmsurrounding it is circumscribed (segmentation).3. The fluorescence intensity of cells iscalculated and displayed by the device,and it can be analyzed similarly to flowcytometry.51/51
The working principle of flow cytometry deflector condenser plates sample sheath fluid piezoelectric crystal oscillator fluorescence detectors light scatter detector laser beam sheath fluid core. 4/51 Fluidics sheath fluid sample fluid The sheath fluid surrounds the sample in concentric