Transcription
Mobile Network QoS ManagementFrom Network Centric Operations toExperience & Service CentricOperationsExpresso SenegalMarch-2018
Introduction: Quality of Services Challenges for Operators Maximize the utilization of offered services. Increase the revenues. Stay better than competitors. Develop and experience new scalable services. Optimize the network performance. Ensure and improve the Return On Investment (ROI).
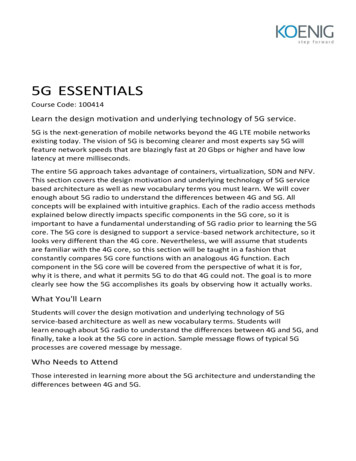
Traditional QoS Management: Network centric OperationsPerformanceMonitoring(OSS KPI)2G3G4GRadio KPIs analysis and ControlCoverage and Interference AnalysisDrive Testingand PostProcessingU2000Mobility and Intersystem Interoperability AnalysisProbe/TEMSNetwork Integrity and Capacity AuditingAnalysis andNetwork dataUpdatingPilot Pollution ControlCSFB PerformanceLayer 3 analysis for failed events (set-up, Drop ) network or UE basedCustomersComplaintsFollow-upCluster optimization and replanningLow Throughputs causes analysisFunctions Upgrade & follow-up
Performance Monitoring and root cause follow-up: KPI basedCalls – 7500Drop Call Rate – 1.5%Data Drop – 1.3%Calls – 11200Drop Call Rate – 1.6%Data Drop – 0.3%Focus ofNetworkEngineerCalls – 8500Drop Call Rate – 1.7%Data Drop – 1.4%Calls – 8750Drop Call Rate – 0.8%Data Drop – 1.8%Calls – 6150Drop Call Rate – 0.75%Data Drop – 1.2%Calls – 8500Drop Call Rate – 0.5%Data Drop – 1.1%Calls – 5400Drop Call Rate – 3.5%Data Drop – 4.1%Calls – 10800Drop Call Rate – 1.2%Data Drop – 1.33% 2%Calls – 9720Drop Call Rate – 2.3%Data Drop – 3.6%Drop ThresholdSet by SLACalls – 7350Drop Call Rate – 1.3%Data Drop – 1.5%Calls – 10300Drop Call Rate – 1.2%Data Drop – 0.8%Calls – 6700Drop Call Rate – 3.3%Data Drop – 2.8%Calls – 9500Drop Call Rate – 1.2%Data Drop – 1.6%
PM and root cause follow-up: Enhanced KPI based, TopNCalls – 7500Drop Call Rate – 1.5%Data Drop – 1.3%Calls – 11200Drop Call Rate – 1.6%Data Drop – 0.3%Focus ofNetworkEngineerCalls – 8500Drop Call Rate – 1.7%Data Drop – 1.4%Calls – 8750Drop Call Rate – 0.8%Data Drop – 1.8%Calls – 6150Drop Call Rate – 0.75%Data Drop – 1.2%Calls – 8500Drop Call Rate – 0.5%Data Drop – 1.1%Calls – 5400Drop Call Rate – 3.5%Data Drop – 4.1%Calls – 10800Drop Call Rate – 1.2%Data Drop – 1.33%TopNCalls – 9720Drop Call Rate – 2.3%Data Drop – 3.6%TopN Cells/siteswith Highest CDRCalls – 7350Drop Call Rate – 1.3%Data Drop – 1.5%Calls – 10300Drop Call Rate – 1.2%Data Drop – 0.8%Calls – 6700Drop Call Rate – 3.3%Data Drop – 2.8%Calls – 9500Drop Call Rate – 1.2%Data Drop – 1.6%
Performance Monitoring and root cause follow-up: Alarm basedStartFault happensFront OfficeTT assigned toFOEscalationAnalysis by FrontOfficeFault Detection& Confirmation:NSM or FMSolvedNoYesConfirmationfrom FONoYesEndBack OfficeTT assigned toBOSolvedYesNoEscalade tothird LevelClose TroubleTicketFO / BO / FMFieldmaintenanceNoTT assigned toFMSolvedYes
Drive Testing and Post Processing: Coverage Issue in 3GCoverageProblem AreaDive TestMeasurementBest Server’sNoCPICH -90 dBmCoverage AreaOptimizationYes Antenna Tilting/ High changeNo Pilot Power increaseBest Server’s Hardware ChangeEc/Io - 12 dB Missing Neighbors analysis Pilot power of NeighborsYesDominance AreaOptimizationDominance Problem area(Low best server Ec/No)4th Best Server’sEc/Io 6 dBYesCompleteMeasurementAnalysisNoDominance AreaOptimizationanalysisDominance Problem area(High best server Ec/No)
Analysis and Change Implementations Cell cluster Complain Voice call ThroughputCollection ofUsers MutualOptimization PlanYesRF ParametersAuditTraffic AnalysisCoreEnd to EndAudit ReportTransportRANCluster NetworkOptimizationNoPost OptimizationDrive TestPhysical SitesParameters AuditCompetitiveBenchmark AuditIs the ClusterOptimized
Enhanced QoS Management: Experience & ServiceCentric OperationsWith the development of mobile networks, customer needs and behaviors havechanged. Mobile communications means so much more than simple voicecommunication; there is now mobile Internet with web surfing, video phone,streaming media, and microblogging. Focusing on traditional KPIs only are nolonger adequate for measuring the quality of mobile services. The objective ofnetwork optimization has gradually shifted from enhancing network performanceto improving quality of experience (QoE). Therefore, assessing and optimizing QoEis the trend for optimizing today mobile networks.
Traditional Evaluation Method KPI End-users’ Experience Individual user experience is flooded in average KPI Element KPI E2E service success rateEvery domain is excellentDrop Call Rate0.0846% (excellent)99%99%Cell 12940%99%99%The real situation (cell 129) 4 people dropped call 2 timesin 3 hours 2 people dropped all the calls 40%: End-user servicesuccessful rateLack of subjective service quality monitoringe.g. MOS(DT test) can evaluate end user’s accurateexperience directly, but just sample measurement. Many user’smay have bad experience, such as noise, echo still out ple Times(GSM/a month)Vague audio2883.6(Excellent)ExampleOne-way audio/noise/echo/ How can we define and manage the end-users’ experience?412
Experience & Service Operations ViewOperationalUse CasesIpadHow many individualsubscribers made the callsHow many areCorporate/Mass, what istheir CEICalls – 7500Drop Call Rate – 1.5%Data Drop – 1.8%ProductPlanning &CampaignDevicePerformanceCustomerCentric View &Proactive ActionIphoneService Mix &OTT ServiceManagementSamsunggalaxy S3Which are devices that arebeing usedData & voiceWho are impacted by: Call Drop/Call Failure/ Data Access Failure/Data Drop /Low ThroughputHot Spots &HVC FocusOperationsIs anyoneexperiencing failureNetworkInvestment &OptimizationvoiceVideo CallWhich are servicesthat are failing
Assessment of a set of QoE KPIs(Technical)Excellent/Good/Fair/Poor/badQoESub QoECoverage/ Accessibility/ Retainability/ IntegrityStreaming Service Setup Success RateStreaming Service Setup DelayStreaming Service Download Completion RateKQIRRC Connection Setup Success RateTBF Setup Success Rate Attach Success RatePDP context Activation Success RateStreaming Server Connection Success Rate KQIGSMData07/07/2017WCDMADataCDMA/ Wi-Fi4GThink, work and act as one team to meet our customers’ dreamsRAN/CN/VS Performance dataDT/CQT DataCDR/MRSignaling Collection Data12
What is the correlation between QoS and QoE ? Technical Correlation Possible through convergent indicators Perception Correlation Difficult but possible Methodology Identify QoS indicators/parameters, technically measurable and influencing the QoE Use intrusive measures (with a reference) Evaluate both indicators and quality perceived by the user (QoE) Establish formulas for calculating QoE through QoS indicators Apply methods to non-intrusive measures Advantages Estimate the QoE based on network indicators without the need for intrusive measures Limits Requires adaptation to the effects external to the user (regulator)07/07/2017Think, work and act as one team to meet our customers’ dreams13
Factors (aspects) Affecting the QoE Technical The specific expectation of the user in terms of quality indicators Technologies’ trend Users’ equipment Users perception The present particular context of the user (need, mood, physical state .) Living standard (price) The social environment (culture, intellectual level, customs, .) User experience in the network or other networks Fashion and trends Advertising offers/products (including those of competitors)07/07/2017Think, work and act as one team to meet our customers’ dreams14
Exemple of ParametersVoice qualityParametersCausesImpact on QoECall Establishment FailureVarious causes ( Radio or core network)customer dissatisfactionEchoTransmission issuePoor listeningDistortionInterferencesHearing difficultiesBackground noiseWrong network configurationHearing difficultiesEquipment out of date (EOM, EOS)Bad interconnection of network elementsCall drops07/07/2017Various causes ( Radio or core network)Think, work and act as one team to meet our customers’ dreamscustomer dissatisfaction15
Exemple of ParametersData qualityParameterCauseEffectImpact on QoEPackets lossTransmission errorPackets retransmissionNavigation delayLow download speedLatency ( end-QueuingDelay on real timeImpossibility for online gamingto-end delay)CongestionapplicationLag of image for videosurveillanceJig07/07/2017Different rootPackets arrive on wrong Navigation delayAlgorithm different fromordernetwork nodesWaiting reorderingThink, work and act as one team to meet our customers’ dreamsLow download speed16
Exemple of ParametersVideo qualityParameterCauseEffectImpact on QoETime of first slow imageappearanceBad Buffer SizingWide waiting before theimage startingWide waiting before theimage startingAvailability of the videoServer congestionSlow transmission linkFlow of video noncontinuousVideo stopVideo shiftResolution and Framerate (Image per second)Bad dimensioning of theresolution vs user bit rateinadequate transmission Delays, stopping videochannel to route videoCodec usedBad compression, so moredatainadequate transmission Delays, stopping videochannel to route videoPoor delivery of videoWrong sizing/configurationof application readerPoor flowsynchronization07/07/2017Think, work and act as one team to meet our customers’ dreamsCut-off/ stopping thevideo17
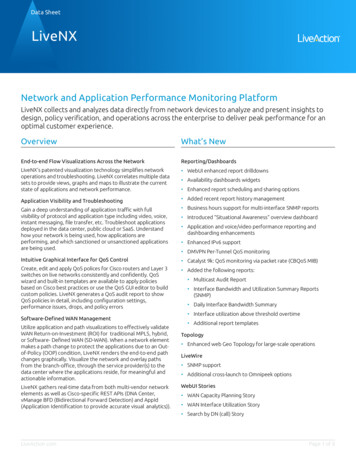
Converting from KPI to QOEExperienceon MarketingExperienceon ManagementUser QoEUserPerceptionQoEn g( KQI1,KQI2. KQIn) gf( KPI1,KPI2. KPIn)QoEFoundationFoundationDefined by Service type:Experience Voice quality: accessibility, call drop,on KQIspeech quality WEB quality: accessibility, web delay,download speedNetwork SMS quality: accessibility, accessKPIdelay Data services KQIsServiceAdditional DataQualityKQIn f( KPI1,KPI2. KPIn)NetworkPerformanceAdditional DataBearer network KPIsRadio KPIsDefined by Network domain: Wireless network performance Core network performance IP network performanceVoice services KQIs Transmission network performance Service system performance Core network / VAS KPIsIPNetworkNode BRNCMSC/MGWMSC/MGW Establish QoE Evaluation System Focus more on KQI than KPI Set up QOE, KQI, KPI mapping relationships Transformate from Objective KPIs to Subjective QoERNCNode B
CategoryKQI namefirst page loadingsuccess ratioAccessibilityaverage first pageloading speedRetainabilityweb browsing datatransfer cut-off ratioweb page refreshingsuccess ratioIntegrityaverage page refreshingspeedMappingKQI valueQoE score 99%595% 99%480% 95%370% 80%2 70%1 512kbps5256 512kbps4128 256kbps364 128kbps2 64kbps1 0.1%50.1% 0.5%40.5% 1%31% 2%2 2%1 99%595% 99%480% 95%370% 80%2 70%1 512kbps5256 512kbps4128 256kbps64 128kbps 64kbps321Weight40%10%QOE scoreQoE gradeUser perception 4.5ExcellentVery satisfied4 4.5Very goodSatisfied3.5 4GoodLittle unsatisfied3 3.5FairMuch unsatisfied 3PoorMost unsatisfiedQoE 4 * 40% 3*10% 4*10% 3*25% 10%4*15% 3.65 ,Good Initialized with default weight value & benchmark for KQIs ,25%yet need to get agreement with operator Automatically generate optimization report and send outalarm information immediately for poor QoE status15%
Estimate the global QoEExample of weighting by Indicator Identify consumer preferences eech quality20%90.87%18.17%SMSQoSQoEOriginating Successful40%97%38.80%Terminating Successful40%95%38.00%Reception S (DT)QoETime of video starting40%85%34.00%Intermittent Stop of Video30%90%27.00%Video image quality20%96%19.20%Voice quality of the video10%98%9.80%Data (DT)QoSQoEData Connection establishment30%95%28.50%email reception successful20%98%19.60%email sending successfulcontinuous http navigationdownload 70% Establish a weighting grid by service to obtain an assessment of the client's feel (QoE)07/07/2017Think, work and act as one team to meet our customers’ dreams20
Field Measurements TemplateKQI 1KQI 2KQI les approachAgenciessalesothersProducts and offersProductOffersPromotionAfter SalesAccessibilitySupportWaiting TimeFollow-upNetworkCoverageVoice CallSMSInternetMobileKQI: Key Quality IndicatorKQI 4Each level have around 3 KQI, andeach of the KQI will be evaluatedsubjectively with attached /07/2017KQI 1KQI 2KQI 3KQI 4 Think, work and act as one team to meet our customers’ dreams21
QoE Monitoring Tools Application layer tools E.g. Ping, FTP, HTTP browsing, MMS, SIP, WAP, etc Field measurement tools Radio measurements application layer performance Protocols analyzers Protocol stack performance analysis at any interface Mobile QoS Agents L1-L7 measurements, position and location Active and passive measurements07/07/2017Think, work and act as one team to meet our customers’ dreams22
Mobile Quality Agent (MQA) Measuring mobile multimedia service quality, radio parameters, andproducing and reporting performance statistics to central managementservers Active probing and/or passive monitoring, which turns thousands ofcommercial mobile phones into (secure and non intrusive) service qualityprobing stations A central management server derives KPIs out of the reports from QoSagents, and manages QoS agents, i.e. dynamically dispatches, installs,and activates or deactivates them07/07/2017Think, work and act as one team to meet our customers’ dreams23
Mobile Quality Agent: Nemo CEM
Mobile Quality Agent: Nemo CEM
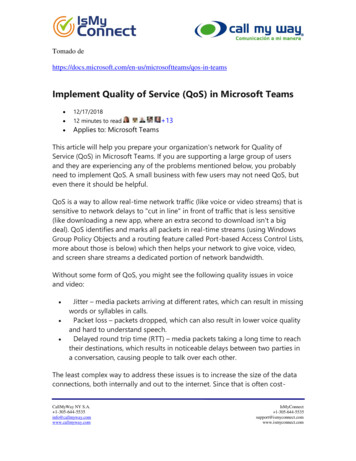
Device Performance AnalysisThis documents presents results of the Nemo CustomerExperience Monitor trial perform by Expresso Senegal betweenJanuary 1st 2018 and February 20th 2018.During that period, following number of samples have beencollected:
Device Performance Analysis
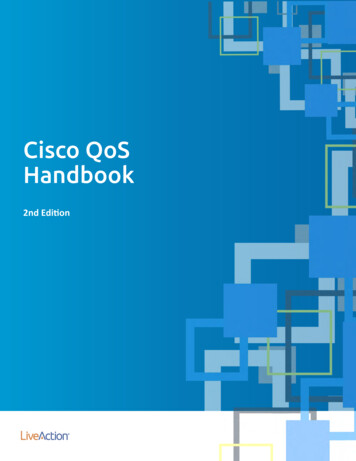
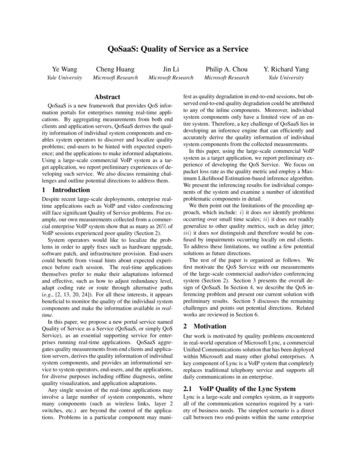
Device Performance AnalysisBest Technology availableFailureVoice Call Success
Think, work and act as one team to meet our customers’ dreams07/07/201729
Data Drop -1.5% Calls -9500 -1.2% Data Drop -1.6% . PM and root cause follow-up: Enhanced KPI based, TopN Focus of Network Engineer Calls -7500 . Defined by Network domain: Wireless network performance Core network performance IP network performance Foundation Foundation Additional Data