Transcription
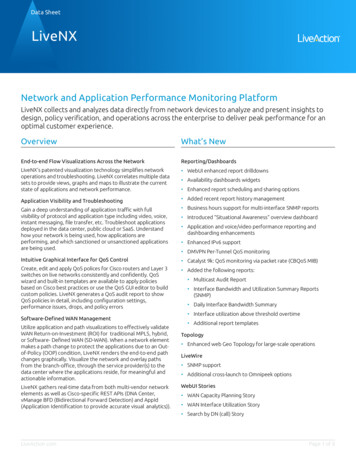
Data SheetLiveNXNetwork and Application Performance Monitoring PlatformLiveNX collects and analyzes data directly from network devices to analyze and present insights todesign, policy verification, and operations across the enterprise to deliver peak performance for anoptimal customer experience.OverviewWhat’s NewEnd-to-end Flow Visualizations Across the NetworkReporting/DashboardsLiveNX’s patented visualization technology simplifies networkoperations and troubleshooting. LiveNX correlates multiple datasets to provide views, graphs and maps to illustrate the currentstate of applications and network performance. WebUI enhanced report drilldownsApplication Visibility and Troubleshooting Added recent report history managementGain a deep understanding of application traffic with fullvisibility of protocol and application type including video, voice,instant messaging, file transfer, etc. Troubleshoot applicationsdeployed in the data center, public cloud or SaaS. Understandhow your network is being used, how applications areperforming, and which sanctioned or unsanctioned applicationsare being used. Business hours support for multi-interface SNMP reportsIntuitive Graphical Interface for QoS Control Catalyst 9k: QoS monitoring via packet rate (CBQoS MIB)Create, edit and apply QoS polices for Cisco routers and Layer 3switches on live networks consistently and confidently. QoSwizard and built-in templates are available to apply policiesbased on Cisco best practices or use the QoS GUI editor to buildcustom policies. LiveNX generates a QoS audit report to showQoS policies in detail, including configuration settings,performance issues, drops, and policy errors Added the following reports:Software-Defined WAN ManagementUtilize application and path visualizations to effectively validateWAN Return-on-Investment (ROI) for traditional MPLS, hybrid,or Software- Defined WAN (SD-WAN). When a network elementmakes a path change to protect the applications due to an Outof-Policy (OOP) condition, LiveNX renders the end-to-end pathchanges graphically. Visualize the network and overlay pathsfrom the branch-office, through the service provider(s) to thedata center where the applications reside, for meaningful andactionable information.LiveNX gathers real-time data from both multi-vendor networkelements as well as Cisco-specific REST APIs (DNA Center,vManage BFD (Bidirectional Forward Detection) and AppId(Application Identification to provide accurate visual analytics)). Availability dashboards widgets Enhanced report scheduling and sharing options Introduced “Situational Awareness” overview dashboard Application and voice/video performance reporting anddashboarding enhancements Enhanced IPv6 support DMVPN Per-Tunnel QoS monitoring Multicast Audit Report Interface Bandwidth and Utilization Summary Reports(SNMP) Daily Interface Bandwidth Summary Interface utilization above threshold overtime Additional report templatesTopology Enhanced web Geo Topology for large-scale operationsLiveWire SNMP support Additional cross-launch to Omnipeek optionsWebUI Stories WAN Capacity Planning Story WAN Interface Utilization Story Search by DN (call) StoryLiveAction.comPage 1 of 8
LiveNXDevice/System Management WebUI Geo-location grouping Custom application management (w/NBAR)topology, site or device views. LiveNX presents the time stampfrom the Alert and problem isolation from the Flow data, shouldadditional analysis be necessary the NetOps team can quicklycross launch Omnipeek for deep packet analysis for root cause. Enhanced dashboard filtering Improved system backup and restore for non-snmpmanaged devices Updated Cisco WLC Netflow template support (HigherVisibility) Geo-Topology: current alerts status box Configurable device auto-refresh time Improved Cisco SD-WAN onboarding Single Sign-On (SSO) vis SAML (ADFS)Alerting Web: Drilldown from Alert to relevant report QoS Class Drop catch-all threshold Multi-threshold alerting for: Interface, Device, Site Reachability Alerts Device CPU/Memory Alerts WAN Utilization Alert Service Now: Incidents (urgency/sub-category fields) SD-WAN Enhancements: vManage alert and event visibilityRapid Incident Response for Faster Incident ResolutionLiveWire Integration for Monitoring WAN Edge Segments Maintenance ModeLiveAction Network Analytics (LiveNA) (Preview) On-premise GPU based appliance(s) Anomaly detection of app behavior Advanced baselining and analyticsCloud Monitoring for AWS/Azure (Preview) End to End Visibility – both cloud and on-premise Visibility across VPC and VNet traffic Native flow log visibilityPlease contact support@liveaction.com if you are interested inseeing a demo of the Preview products—LiveNA and CloudMonitoring.Key FeaturesLiveWire — WAN Edge Continual MonitoringThe LiveWire Network Monitoring Appliance is optimized forWAN edge applications to provide packet capture and integratedIPFIX Export solution with LiveNX. LiveWire captures andconverts real-time packet data which feeds directly into thevisualization engine of LiveNX.Together, LiveWire and LiveNX bring new visual insights andanalytics to traditionally “dark” environments such as applicationclassification and performance management for SD-WANdeployments or traditioal legacy multi-vendor edge switchenvironments. LiveWire is extremely powerful for numerous usecases including branch wireless monitoring, point-of-saletransaction troubleshooting and VoIP troubleshooting.Rapid Incident Response with Flow to Packet AnalysisWorkflow OptimizationResolving complex incidents can be challenging when differentsystems, vendors, devices and software are involved. LiveNXoptimizes a rapid incident response workflow with Alertnotification or predictive insight where the event is identifiedfor remediation. Within LiveNX’s Engineering Console, NetOpscan easily isolate the issue with the visual analytics presented asLiveAction.comPage 2 of 8
LiveNXApplication Visibility and Control (AVC) ReportsCisco IntegrationsLiveNX presents advanced network performance data with CiscoApplication Control and Visibility (AVC) data. With this networkdata, LiveNX reports on Top Applications Performance and AVCApplications with latency, jitter, packet loss and advancedperformance indicators for: sites, devices, users and serviceprovider environments.Alerting Enhancements – Site AvailabilityLiveNX Cisco DNA Center IntegrationLiveNX Operations Dashboard — Current Alerts by SiteLiveNX offers the broadest suite of integration for Ciscoenvironments. In LiveNX 8, Cisco DNA Center API integration isnow available for General Availability, in addition to CiscoIdentity Service Engine (ISE), vManage (SD-WAN), SD-Access andPxGrid connectors. These integrations provide rich datasets forLiveNX advanced visual analytics. Real-time Topology Flow Viewsand forensic playback and analysis are key NetOps elements.LiveNX — Site Availability ReportKey CapabilitiesThe LiveNX Operations Dashboard now supports site availabilityreports and custom widgets to illustrate an aggregated alertingview. NetOps teams can now visualize the Dashboard Alerts inone location by Site, Device, or Interface for easier access withsummarized views.Flow and Packet Optimized Workflow for NetworkTroubleshootingSite availability is a helpful trend to observe. This is one wherefluctuations should be very small, and KPIs controlled tightly. Asa leading indicator of possible SLA violations, hazardous areas orpoor deployment scenarios, Site Availability Reports are bestintegrated in a Service Level View and tie it together withApplication performance and Network QoS Class reporting.With both flow and packet level analysis NetOps can now isolateproblem areas quickly and have a rapid response ready for anyhigh severity incidents.With Flow Topology Views and integrated Expert PacketAnalysis, LiveNX optimizes the problem isolation to root causeincident management cycle. With integrated ServiceNow ITOMworkflows, LiveNX is a key platform for NetOps to resolveincidents faster, and report on status and impact to the business.Visual AnalyticsVisualization allows you to better understand network traffic sothat you can identify trouble spots. Application and flow path analysis Multi-vendor support – NetFlow v5/v9, IPFIX, sFlow and JFlow Jitter, delay, packet loss metrics for voice and video Application response times, round-trip time, server delayand client delay metrics NetFlow Secure Event Logging (NSEL)LiveAction.comPage 3 of 8
LiveNX Wireless information including user identity Site IP mappings Firewall high-speed logging Determine if a device is in the data center End-system (device type, OS) and end-user information Viptela VPN ID mapping to a VPN name Integration with Network Packet Brokers vManage API: BFD (Bidirectional Forward Detection),AppId and Alarms. Flow DVR for playback of historical data Built-in Domain Name System (DNS) name resolutionCisco IWAN Support Topology export to Visio PfR configuration of multiple Master ControllersSoftware-Defined WAN Monitoring Automatically learn semantic settings for PfRv3 monitoringto simplify setupGUI-based management for SD-WAN monitoring for path controland application performance optimization. PfRv3 multiple data center support Path control visualizationQoS Monitoring SD-WAN dashboard and trendingTrack QoS performance on a per-class basis. Monitoring andalerting of priority queue drops provides proactive notificationof potential voice quality issues. PfRv3 multiple data center support Shows what Out-of-Policy reason triggers path change(s) Reports on traffic class/application associated NBAR2 application visualization Custom NBAR definitionsCisco SD-WAN Support (Viptela) Pre- and post-QoS graphsLiveNX consolidates a unified reporting, inventory, and alertnotification. For Cisco SD-WAN, LiveNX supports: Detailed graphical display of interface and CBQoS statistics Cisco vEdge, cEdge and ENCS platform support Cisco IWAN support Cisco SD-WAN Site to Site Topology View Overlay visibility – VPN, tunnel Service Provider transport Performance Status Filtering by application, DSCP, VPN or Service Provider Cisco SD-WAN Site to Site Analysis Policy verification Application – VPN – DSCP – Service Provider servicestatus Viptela device inventory, including vEdge routers andmanagement devices like vManage, vBond and vSmart Add relevant interfaces for monitoring from each vEdgerouter. Device monitoring credentials, like SNMP settings Gather network semantic information per device andinterface: 95th/99th percentile, quarterly, yearly and collated reportsAlertingLiveNX associates Events from devices (routers, switches,firewalls, etc.) to Alerts, which are generated upon meetingspecific criteria, such as a threshold, and are displayed in theOperations Dashboard.With the Event-to-Alert mapping concept, LiveNX is able toeliminate the common complaint that the number of alertsbeing created is too high, thereby displaying only the alerts thatrequire immediate attention.Alerts are categorized into three severity levels:Critical:The highest severity, e.g. for alerts that would cause the biggestproblem to the networkWarning:A high severity, e.g. for alerts that may indicate issues that areproblematic or will become problematicInfo:A low severity, e.g. an issue that is worth knowing about but maynot be that detrimental to the network Site geo locationAlerts can be configured to integrate into workflows withinindustry incident management systems such as ServiceNow andPagerDuty. WAN interfaces per deviceQoS Configuration Service Provider associated with each WAN interface.Note: Viptela refers to the service provider informationas ‘colors.’ Capacity of WAN links (inbound andoutbound)Create, edit, and apply QoS policies for Cisco routers and Layer 3switches on live networks. Use the QoS wizard and built-intemplates to apply policies across multiple devices based onCisco best practices or use the QoS GUI editor to build policies. Site association per deviceLiveAction.comPage 4 of 8
LiveNX Full Modular QoS configuration support including WRED,CBWFQ, and Priority Queue Hierarchical policy creation for advanced configurations Custom NBAR2-based matches including high-levelattributes, HTTP URL, MIME, HOST and RTP protocols Built-in ACL editor Built-in rules for QoS settings that highlight violations Configuration audit trail System-wide QoS audit LAN Service PolicyLANVisualize Spanning Tree Protocol. Provide real-time Layer 2visualizations for networks, including trunk interface, portchannels, VLAN associations and bandwidth percentages. RunLayer 2 QoS reports.RoutingReal-time routing visualizations for Cisco networks that canidentify reachability problems, routing loops, and asymmetricpaths affecting traffic quality. In addition, the policy-basedrouting viewer/editor provides a high degree of control overtraffic policy to route traffic easily and predictably over userspecified paths.IP SLACisco IOS IP SLA is easily accessible to generate and monitorsynthetic network traffic to baseline network performance, testpolicy changes, or proactively monitor key network paths.Synthetic traffic types include data (HTTP, FTP, DNS, DHCP) andvoice that can be used to measure latency, loss, jitter, and MeanOpinion Score (MOS) for VoIP. The highly interactive graphicalinterface delivers the functionality and flexibility of IP SLAfeatures without the need to learn and use Cisco devicecommand lines.Test Types:DHCP, DNS, ICMP Echo, FTP, HTTP, Jitter, UDP Echo, VideoOperationsLatency:MOS performance measurements, loss, jitterLarge-Scale:Wizard-based IP SLA provisioning in full-mesh and hub/spokeconfigurationLiveAction.comPage 5 of 8
LiveNXIntegrations and Component ArchitectureLiveNXLiveNX is a network and application performance monitoringplatform with patented end-to-end visualization for a globalview of the network and the ability to drill-down to individualdevices. Using LiveNX, enterprises gain real- time and continuousinsight into network traffic based on application and user levelactivity. LiveNX offers the ability to gather and analyze volumesof network data at scale from every device, application and userto reduce mean time to repair, and it performs exploratory andexplanatory analysis.Omnipeek From the site, drill down to examine network conditionsincluding bandwidth utilization, link errors, QoS metricsand applications that are competing for the bandwidthLiveNX Monitor of MonitorsLiveNX Monitor of Monitors provides a single-pane-of-glass forserver settings, system health, sites and configuration,aggregating multiple geographical or organizationallysegmented LiveNX domains. Through an aggregation layer, eachLiveNX server domain instance injects relevant data for summarydashboard views and management by way of a north-boundREST API. Deep packet analysis Vast library of decoders Expert system – suggested causesLiveUXLiveUX monitors end-user experience of web applications. Bycombining the end-user experience metrics with the networkperformance monitoring information, you can quickly triageperformance issues. Integrated LiveNX and LiveUX dashboard for instantvisibility of site health, network devices, application usage,and application performance (incl. UnifiedCommunications). Quickly identify the sites that are experiencingperformance degradation and the applications impactedLiveAction.comPage 6 of 8
LiveNXSystem RequirementsDeployment OptionsComponentVirtual Appliance(OVA)Virtual Appliance(Hyper-V)Amazon WebServices (AMI)Microsoft AzureLiveNX ServerApplianceLiveUX Application MonitoringXXXXXLiveNX ServerXXXXXLiveNX NodeXXXXXLiveNX DeploymentDeployment OptionsVirtual Deployment SpecificationsLiveNX components can be deployed via the following methods:Virtual, Physical, and Cloud. The Virtual DeploymentSpecifications, as well as the Cisco and Multi-Vendor DeviceSupport lists are provided below.The LiveNX Server is primarily deployed as a VMware .OVAappliance and is fully operational right out of the box. The serveroperating system runs on a Linux (TinyCore or Ubuntu) platform.If you are interested in deploying LiveNX in a Physical, Cloud(Azure, AWS, & Google Cloud), Hyper-V, or KVM environment,please contact LiveAction sales (sales@liveaction.com) for thespecifications appropriate for those environments and yourneeds.Server Platform Specifications VMware ESXi v5.0 or higher - VMware Hardware Version 8(vmx-8) Network Hardware - At least two Physical NICS on ESXi Support up to 10 Gbps Virtual NICs on OVA are utilizing E1000Proof of Concept (POC)Small DeploymentMedium DeploymentLarge DeploymentPhysical Deployment 25 devices or 25 k flows/sec. 100 devices or 50 k flows/sec.100 to 500 devices or 100 k flows/sec.500 to 1000 devices or 150 k flows/sec.1000 or more devices,or 350 k flows/sec.Min. Requirements: 8 vCPU Xeon or i7 16 GB RAM LiveNX Server Max Heap Size8 GB 500 GB Data DiskMin. Requirements: 16 vCPU Xeon or i7 32 GB RAM LiveNX Server Max HeapSize 16 GB 2 TB Data DisksMin. Requirements: 16 vCPU Xeon or i7 64 GB RAM LiveNX Server Max HeapSize 31 GB 4 TB Data DisksMin. Requirements: 32 vCPU Xeon or i7 64 GB RAM LiveNX Server Max HeapSize 31 GB 8 TB Data DisksMin. Requirements: 48 vCPU Intel Xeon Gold5118, Hyperthreading enabled 96 GB RAM LiveNX Server Max HeapSize 64 GB 32 TB Data DisksEach LiveNX server/node supports up to 76 TB disk space. It is recommended to add each disk in 10 TB increments.Server IOPS Recommendation LiveNX 8.0 - 1000 IOPS Read and 4500 IOPS Write.LiveAction.comPage 7 of 8
LiveNXClient Platform SpecificationsLiveNX Routing Windows or macOSCisco Series Routers: 800, 1700, 1800, 1900, 2600, 2600XM,2800, 2900, 3600, 3700, 3800, 3900, 4300, 4400, 7200, 7600,ASR1000, CSR 1000V, ENCS are supported. 4 Cores 8 GB RAM Web browser: IE11 and higher, Firefox, Chrome, and SafariNetwork Device SupportLiveNX FlowLiveNX Flow provides advanced end-to-end system-level flowvisualizations for multi-vendor networks. The following deviceshave gone through flow-analysis testing with LiveNX.Adtran NetVanta Series RoutersF5 BIG-IP Application Delivery ControllerPlatformsAlcatel-Lucent RoutersGigamon GigaSMARTBrocade Series RoutersHewlett-Packard Enterprise ProcurveSeries SwitchesCisco Series Routers (ISR Series, CRS1, ASR 1000 & ASR 9000 SeriesRouters, ENCS5000)Ixia’s Network Visibility SolutionCisco Catalyst SwitchesJuniper MX Series RoutersCisco Nexus Switches (Nexus 3000,7000 & 9000 Series)nTop nProbeCisco ASA 5500 Series FirewallsPalo Alto Networks FirewallsCisco AnyConnect Network VisibilityModule on Windows and macOS XPlatformsRiverbed SteelHead WAN OptimizationControllersCisco DNA Center, Cisco APIC-EM CiscoMeraki MXSilver Peak WAN OptimizationControllersCisco NetFlow Generation ApplianceCisco vEdge/cEdge Routers CiscoViptela VManage APIExtreme Network SwitchesEndpoint AgentLiveNX QoS MonitorLiveNX QoS Monitor provides quality of service monitoring andtroubleshooting for Cisco router and switches. Cisco Series Routers: 800, 1000, 1700, 1800, 1900,2600,2600XM, 2800, 2900, 3600, 3700, 3800, 3900, 4300,4400, 7200, 7600, ASR1000, CSR 1000V Cisco ASR 1000 and9000Recommend IOS versions 12.3 or higher or 15.0 or higherfor use with the software (IOS XE 2.6.0 or higher for ASR1000 series). Earlier IOS versions may also work but are notofficially supported. General-release IOS versions arerecommended, although early- and limited- releaseversions will also work with LiveNX. Cisco Catalyst Series Switches: 3650, 3850, 4500-X and9000 Limited LiveNX QoS Monitor support on Layer 3routable interfaces and VLANs depending upon Ciscohardware capabilities. Cisco 5000 Series Enterprise Network Compute System Cisco Nexus Series Switches: 7000LiveNX QoS ConfigureLiveNX QoS Configure provides for configuring andtroubleshooting Quality of Service for Cisco routers andswit
switches on live networks consistently and confidently. QoS wizard and built-in templates are available to apply policies based on Cisco best practices or use the QoS GUI editor to build custom policies. LiveNX generates a QoS audit report to show QoS policies in detail, including configuration settings, performance issues, drops, and policy errors

