Transcription
QoSaaS: Quality of Service as a ServiceYe WangCheng HuangJin LiPhilip A. ChouY. Richard YangYale UniversityMicrosoft ResearchMicrosoft ResearchMicrosoft ResearchYale UniversityAbstractQoSaaS is a new framework that provides QoS information portals for enterprises running real-time applications. By aggregating measurements from both endclients and application servers, QoSaaS derives the quality information of individual system components and enables system operators to discover and localize qualityproblems; end-users to be hinted with expected experience; and the applications to make informed adaptations.Using a large-scale commercial VoIP system as a target application, we report preliminary experiences of developing such service. We also discuss remaining challenges and outline potential directions to address them.1IntroductionDespite recent large-scale deployments, enterprise realtime applications such as VoIP and video conferencingstill face significant Quality of Service problems. For example, our own measurements collected from a commercial enterprise VoIP system show that as many as 26% ofVoIP sessions experienced poor quality (Section 2).System operators would like to localize the problems in order to apply fixes such as hardware upgrade,software patch, and infrastructure provision. End-userscould benefit from visual hints about expected experience before each session. The real-time applicationsthemselves prefer to make their adaptations informedand effective, such as how to adjust redundancy level,adapt coding rate or route through alternative paths(e.g., [2, 13, 20, 24]). For all these interests, it appearsbeneficial to monitor the quality of the individual systemcomponents and make the information available in realtime.In this paper, we propose a new portal service namedQuality of Service as a Service (QoSaaS, or simply QoSService), as an essential supporting service for enterprises running real-time applications. QoSaaS aggregates quality measurements from end clients and application servers, derives the quality information of individualsystem components, and provides an informational service to system operators, end-users, and the applications,for diverse purposes including offline diagnosis, onlinequality visualization, and application adaptations.Any single session of the real-time applications mayinvolve a large number of system components, wheremany components (such as wireless links, layer 2switches, etc.) are beyond the control of the applications. Problems in a particular component may mani-fest as quality degradation in end-to-end sessions, but observed end-to-end quality degradation could be attributedto any of the inline components. Moreover, individualsystem components only have a limited view of an entire system. Therefore, a key challenge of QoSaaS lies indeveloping an inference engine that can efficiently andaccurately derive the quality information of individualsystem components from the collected measurements.In this paper, using the large-scale commercial VoIPsystem as a target application, we report preliminary experience of developing the QoS Service. We focus onpacket loss rate as the quality metric and employ a Maximum Likelihood Estimation-based inference algorithm.We present the inferencing results for individual components of the system and examine a number of identifiedproblematic components in detail.We then point out the limitations of the preceding approach, which include: i) it does not identify problemsoccurring over small time scales; ii) it does not readilygeneralize to other quality metrics, such as delay jitter;iii) it does not distinguish and therefore would be confused by impairments occurring locally on end clients.To address these limitations, we outline a few potentialsolutions as future directions.The rest of the paper is organized as follows. Wefirst motivate the QoS Service with our measurementsof the large-scale commercial audio/video conferencingsystem (Section 2). Section 3 presents the overall design of QoSaaS. In Section 4, we describe the QoS inferencing problem and present our current solution withpreliminary results. Section 5 discusses the remainingchallenges and points out potential directions. Relatedworks are reviewed in Section 6.2MotivationOur work is motivated by quality problems encounteredin real-world operation of Microsoft Lync, a commercialUnified Communications solution that has been deployedwithin Microsoft and many other global enterprises. Akey component of Lync is a VoIP system that completelyreplaces traditional telephony service and supports alldaily communications in an enterprise.2.1VoIP Quality of the Lync SystemLync is a large-scale and complex system, as it supportsall of the communication scenarios required by a variety of business needs. The simplest scenario is a directcall between two end-points within the same enterprise
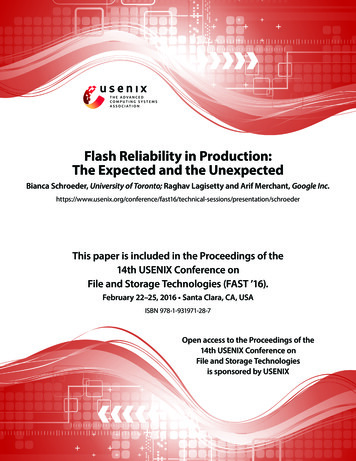
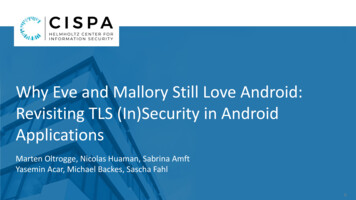
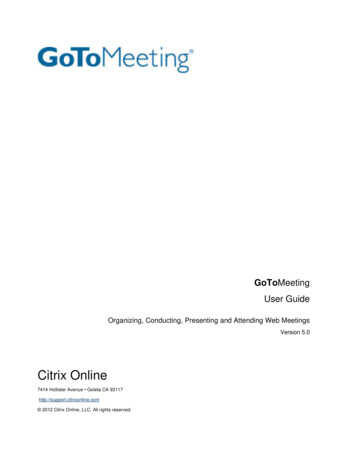
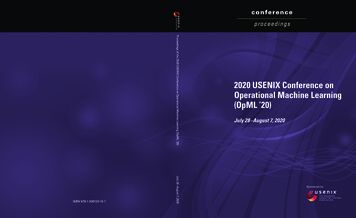
Cumulative Fraction [x Pct]Audio Stream Quality 544.5Audio Stream Mean Opinion ScoreFigure 1: Lync VoIP Quality (over 16 months).network. In this case, a direct peer-to-peer connectionis established for the VoIP session. Other scenarios aremore complex and often involve media servers. Lyncdeploys three types of media servers: 1) a media conferencing server serving as a mixer in multi-party audioand video conferencing; 2) a relay server connecting endpoints from the public Internet to those within the enterprise; and 3) a mediation gateway bridging VoIP sessionswith PSTN.Here is an example involving both a relay server and amediation gateway. Say, an enterprise user in US, whileworking at home, makes a call to a PSTN phone in Europe. In this case, the VoIP session first goes througha tunnel from the user’s home to a relay server in US.Next, the VoIP session is routed to Europe within theglobal network infrastructure of the enterprise. Finally,it is routed to a mediation gateway in Europe so as tobridge with PSTN and eventually reach the PSTN phone.The deployment scale of the Lync system is summarized in Table 1. Ensuring QoS across all scenarios inDeployed CountriesUsers (enterprise plus external)Daily (weekday) Audio SessionsUsed Global Data CentersRunning Media Servers85 7, 000, 000 500, 0003 150Table 1: Deployment Scale of the Lync System.such scale is extremely challenging. Indeed, both userfeedback and collected statistics indicate that the system suffers from significant quality problems. To quantify the quality of experience, we plot the Mean OpinionScore (MOS) [11] reported by all of the VoIP sessionsover 16 months in Figure 1. We observe that 26% of theVoIP sessions experience MOS lower than 2.5 – a typicalthreshold for acceptable quality.2.2Challenges of Ensuring QualityAn individual VoIP session may involve a large numberof system components, and quality degradation could beattributed to any of the inline components. For instance,a single VoIP session might traverse a large set of network components (e.g., load balancers, routers, and network links) and media servers (e.g., mediation gateways,relay servers, and conferencing servers). Any component along the path may cause quality degradation: endpoints might capture poor quality audio due to device is-Figure 2: QoSaaS Overview.sues; VoIP packets might be dropped in wireless linksand congested access gateways or network connections;media servers might delay packets due to overload, misconfiguration, and/or software bugs. On the other hand,individual system components (e.g., end-points, mediaservers, load balancers, and routers) only have a limitedview of the overall system.A consequence is the lacking, in the current enterprisenetwork, of information about how each system component affects VoIP quality end-to-end. Indeed, the aim ofthe proposed QoS Service is to fill such a void.3QoSaaS DesignThe goal of the QoS service is to provide QoS information so as to substantially improve the user experienceof real-time applications in enterprises. In a nutshell,the QoS service aggregates end-to-end quality measurements from end-points and media servers, derives theQoS information of individual system components, andmakes QoS predictions on arbitrary end-to-end paths.3.1Architecture OverviewFigure 2 illustrates the basic components and messageflows of the QoS service. At the center of the service is alogical QoS server. The QoS server is bootstrapped withinformation about network topology and the deploymentof media servers. The end-points and media servers collect QoS measurements about individual VoIP sessionsand report the measurements to the QoS server. TheQoS server employs an inference engine and derives theQoS degradation caused by individual system components. System operators can query the QoS server for thequality estimation of arbitrary system component. Theend-points can query the QoS server for the quality estimation of arbitrary end-to-end path.The QoS service consists of the following three majorcomponents: Measurement Aggregation: The end-points and mediaservers collect QoS measurements of individual VoIPsessions. The measurements are reported to the QoSserver, which aggregates the information in specificways that we will elaborate in later sections. Component QoS Inference: This component is thecore of the QoS service. Given the measurements, the
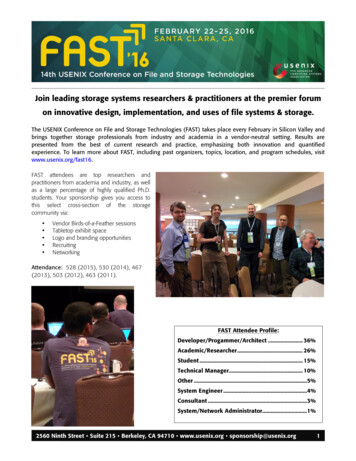
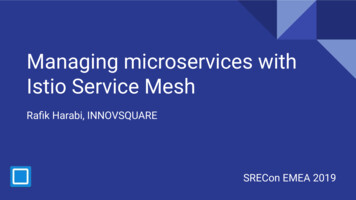
inference engine infers the QoS degradation at eachindividual system component in the VoIP system. QoS Prediction: Given recent and historical inferenceresults, this component predicts the QoS along an arbitrary path consisting of any network components andmedia servers.3.2QoS Service UsageQoSaaS can be used by both the system operators andthe real-time network applications.Because the QoS service infers QoS information of individual system components, the operators can query theservice and discover problematic network segments andmedia servers. For example, if the QoS service reportsconsistently high packet loss rate at a particular subnet,the operators can focus on the network gateway of thesubnet to further diagnose the problem and apply fixes.For real-time applications such as multimedia communication, whenever there is a quality problem due to system components, an end-point can query the QoS servicefor the quality estimation of multiple alternative paths. Itcan then migrate a VoIP session to the path offering thebest performance. For instance, if the default mediationserver is problematic, the VoIP session can be routed to adifferent city so as to bridge with PSTN through anothermediation server. If the direct path between a caller anda callee experiences a problem, a detour path can be established through a conferencing server, or through otherend-points if they are able to serve as relay points.Even when no alternative path is available or even alternative paths do not improve quality, the QoS estimation of the existing path can still be useful. The endpoints can display the QoS information to the end-usersso that they can form proper expectation about the VoIPsession. This is analogous to signal bars displayed oncell phones.4Preliminary ExperiencesThe core of the QoS service is a quality inference engine.The inference engine aggregates end-to-end measurements and derives quality estimation of individual system components, including network segments and media servers. In this section, we describe our preliminaryexperience developing the inference engine employing aMaximum Likelihood Estimation-based approach.4.1Therefore, they are regarded as media transmission entities. The edges are directed as degradation along different directions is typically asymmetric.System ModelWe model the VoIP system as a directed graph G. Thenodes in the graph model end-points, media servers, andphysical locations (such as cities). The edges in thegraph model network segments connecting the nodes.As illustrated in Figure 3, the media server in Dublinis a node, and city Beijing is also a node, while subnetx.x.130.0/23 connecting client a to city Redmondis an edge.Both nodes and edges can cause quality degradation.Figure 3: System Model (with media line Ma b ).The system model abstracts away the physical networktopology. For instance, there might be more than onephysical routers in a city, or more than one physical network links between two cities. The advantage of suchabstraction is that it allows the inference to be refined hierarchically. Once a problem is localized to a node or anedge, detailed diagnosis tools [1, 3, 14] can be employedto identify root causes.A media line defines a directed path in the graph linking multiple entities. As illustrated in Figure 3, a medialine, denoted as Ma b , connects client a to mediationgateway b, with four other entities in between: subnetx.x.130.0/23, city Redmond, edge between Redmond and Dublin, and subnet x.x.132.0/23.A two-party direct call consists of a pair of medialines, one from the caller to the callee and the other inthe reverse direction. A multi-party conference, on theother hand, involves a conferencing server to mix audioand therefore consists of more media lines. In particular,there is one pair of media line between each participatingend-point and the conferencing server. The destinationnode of every media line collects and reports the QoS ofthe media line to the QoS service.4.2Maximum Likelihood Based InferenceFor every VoIP session, the QoSaaS service collects QoSmeasurements from each media line. The inference engine then use these measurements to derive estimationof individual entities. In this section, we focus on anexample QoS metric – packet loss rate – and develop amaximum likelihood based inference algorithm.Assume that media line Ma b consists of k entities(e1 , e2 , . , ek ). Denote the packet loss rate of entityei as pi . Assume that packet loss is independent. Then,the aggregated packet loss rate of the media line is pM Qk1 i 1 (1 pi ).Now, consider all the packets transmitted from a to b.
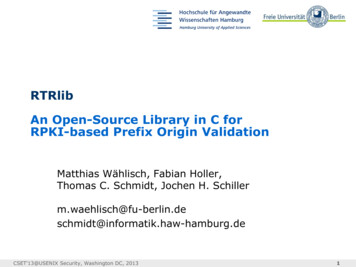
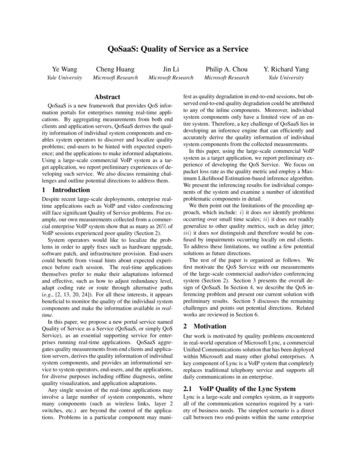
(nLM (nM , mM ) pM M mM )(1 pM )mM .(1)Here, nM and mM are two metrics easy to collect. Alternatively, nM can be estimated readily from the durationof the VoIP session, and mM can be calculated based onthe average end-to-end loss rate.Given the likelihood of the events on individual media lines, the likelihood over the entire system, denotedas L, is the product of the individual likelihoods. Then,maximum likelihood estimation assigns packet loss ratesto individual entities so as to maximize the system-widelikelihood, as follows:Y{pi } arg max {L LM (nM , mM )}.(2){pi }{M }Note that the maximum likelihood estimation naturallytakes into account the duration of VoIP sessions – longersessions have more influence than shorter ones – whilesimple linear models [4, 7, 27] completely ignore the session duration.Inferencing ResultsCumulative Fraction [x Pct]4.30.050.1Infrastructure Entity Packet Loss Rate HeatMap0.15Media Servers50100Site to Site Networks0.1150Wireless SubnetsWired Subnets2000.05250300350500.150.2Audio Stream Packet Loss Rate150200250300350400450Figure 5: Heat Map of Inferred Packet Loss Rate.4.3.2Case StudiesIssue 1: Wireless AP Gateway Poor Performance Inthe heat map, we observe one particular wireless subnetx.x.158.64/27 (entity 149) constantly experienceshigh packet loss rate. The subnet maps to a wireless APgateway installed in an office building in Charlotte, NC.The inferred packet loss rate of the subnet is plotted inFigure 6. The results indicate that, on average, 4.6% ofVoIP packets can be dropped, and the packet loss rate canbe as high as 20% during busy hours.0.3Using measurements collected from a typical workweek (from July 20 to July 24), we now present preliminary inferencing results.All the measurements are grouped by 15-minute slots.Within each 15-minute slot, the packet loss rate of anentity is assumed to be independent and constant. Typically, we observe around 150 entities (out of about 4000)relaying about 5, 000 VoIP audio streams. The concentrated work load on a small fraction of entities is mainlydue to time zone difference. For instance, when the network and the media servers in North America are heavilyutilized, those in Asia are mostly idle.Figure 4 plots the packet loss rate of all the audiostreams. Clearly, a small fraction of the VoIP sessionssuffer from significant QoS degradation.0.25OverviewThe inferencing results are summarized in the heat mapshown in Figure 5. The heat map encodes the packetPacket Loss RateFigure 4: Packet Loss Rate of VoIP Audio Streams.4.3.1100Time Slot Index (every 15 minutes)Next, we illustrate a few concrete case oss rates of 350 entities into colored dots, one per 15minute slot. The higher the packet loss rate, the brighterthe color is. Note that the heat map only includes entities with non-zero packet loss rate in at least one slot,excluding around 3600 entities that never drop packets.From the heat map, we can clearly observe: i) wireless subnets incur more packet losses than wired ones;ii) a few wired subnets are plagued by frequent losses;iii) certain site-to-site network segments also experiencelosses once in a while; iv) media servers are healthy mostof the time.Entity IndexLet nM denote the number of transmitted packets andmM the number of received. Then, the number of lostpackets is (nM mM ). Therefore, the likelihood of suchevents (nM transmitted and mM received) is0.20.150.10.050050 100 150 200 250 300 350 400 450 500Time Slot Index (every 15 minutes)Figure 6: Packet Loss Rate (Wireless Subnet).Issue 2: Long Distance Network Degradation Figure 7plots the inferred packet loss rate on long distance network connections between Hyderabad, India and Redmond, US. The connection from Hyderabad to Redmondcorresponds to entity 98, while that from Redmond toHyderabad maps to entity 114 in the heat map.Issue 3: Media Relay Server Bug Users in Redmondcomplained about poor VoIP quality when calling exter-0
0.3From Hydrabad to RedmondFrom Redmond to HydrabadPacket Loss Rate0.250.20.150.10.050050 100 150 200 250 300 350 400 450 500Time Slot Index (every 15 minutes)Figure 7: Packet Loss Rate (Hyderabad – Redmond).nal users. System administrators added one media relay server x.x.141.95 to alleviate the load on existing ones. Unfortunately, the problem was not solved andaudio quality remained poor.We plot the inferred packet loss rate of related media relay servers in Figure 8. The newly added media relay server appears to incur significantly higherpacket loss rate, as shown by the fine-dashed curve starting from time slot 118, than a normal media serverx.x.141.81. On the other hand, one of the existingmedia relay servers x.x.141.92 also experience highpacket loss.The problem was eventually attributed to a software bug in the media server stack, and both serverx.x.141.92 and x.x.141.95 happened to operatethe same version of stack.Audio Packet Loss RateComparison between Redmond Media Relay 040.0202040 60 80 100 120 140 160 180Time Slot Index (every 15 minutes)Figure 8: Packet Loss Rate (Relay Servers in Redmond).5Challenges and DirectionsSection 4 has shown that statistics collected over VoIPsessions (e.g., average packet loss rate) is helpful in inferring the QoS of individual components of the system. However, coarse-grained statistics can discoveronly simple problems that persistently manifest over longtime scale. The examples shown in Section 4 all bear thisnature. Many problems in real systems are much morestealthy, where coarse-grained statistics often becomesinsufficient.In this section, through analyzing real problems discovered in production systems, we elaborate on a fewkey challenges and point out potential directions so thatthe QoSaaS framework can be generalized to easily dealwith new problems in future.5.1Time ResolutionLet’s examine a problem related to time scale. A mediaserver runs a dedicated process to collect a large numberof performance counters. On Windows Server 2003, thisprocess wakes up every 15 minutes and blocks one ofthe CPU cores completely for 200 ms. As a result, VoIPsessions using the blocked core are affected and experience a 200 ms jitter. This problem is difficult to discover.The 200 ms jitter occurs only once every 15 minutes. Itcan not be observed in average jitter over an entire VoIPsession. In addition, this problem only affects the VoIPsessions using the blocked core, but not other sessionsusing unblocked cores on the same server.Packet-level traces can help the discovery of suchproblem occurring at small time-scale. A packet-leveltrace can be compactly represented, e.g., the trace ofa 5-minute VoIP session with audio rate at 50 packetsper second is about 60 KB [19]. Even so, collecting allthe packet-level traces from every end-point is infeasibleand unnecessary, due to redundant information carriedby the traces. Therefore, it is desirable to collect onlysufficient traces for inference and no more. To this end,one approach is to instrument every end-point to recorda packet-level trace for each VoIP session and store thetrace locally. An end-point only uploads its traces uponthe request from the QoS server.5.2Jitter InferenceGiven packet-level traces, packet losses at small timescale can be inferred. Jitter, however, needs to be derivedin a different way. Averaging even over small time-scalebears the risk of diluting useful information. In the aboveexample, the single jitter of 200 ms equates to an average jitter of only 4 ms per second, if the audio rate is50 packets per second. Therefore, it is more effectiveto first derive per packet jitter value at individual systemcomponents and then aggregate statistics.Given end-to-end jitter measurements, jitter inferencetries to find the most probable assignment of jitter values to individual network components over various timeinstances. Similar to the loss rate estimation, the mostprobable solution tends to concentrate assignments toonly a few components. Yet, how to derive such assignments appears quite different. One potential approach isto explore time dependency between jitter values on eachcomponent. Intuitively, if a component incurs a non-zerojitter at time t, then it is more likely to incur another nonzero jitter at time t 1 than another component that appears perfect recently.5.3Local ImpairmentAll problems are not caused by the network components.Often times they are due to local impairments occurringon the end-points. Consider another real problem. Thisproblem is observed on a slow machine with a single 1.8GHz AMD core CPU, a typical netbook configuration.
Severe audio jitters are observed, which are caused by atime critical system thread hogging CPU for 80 ms fromtime to time. The threads of the VoIP application run atthe same priority as the critical thread and thus experience glitches of 80 ms in audio processing.Obviously, packet-level traces collected on this machine will contain many jitters. The inference based onthe traces would have falsely assign jitters to componentsin network. To reduce the false alarm, it is crucial todistinguish local impairments from those caused by theinfrastructure.One solution to make such distinction is to explore thebi-direction nature of VoIP sessions. There are simultaneous outgoing and incoming packets from the participating end-points. Outgoing packets are only affected bythe local end-point and have nothing to do with the network, while incoming packets are affected by the localend-point, the network and/or the remote end-point. Bycomparing the traces between the outgoing and incomingpackets, it is possible to distinguish local impairmentsfrom network QoS degradation. Note that modern VoIPsystems employ voice activity detection, so that audio issuppressed and no outgoing packets are sent during silence periods. We may add virtual outgoing packets tohandle such artificially irregular traces.6Related WorkQuality of Service has long been recognized as an important topic in network services. There are many previousstudies on QoS related infrastructure support, resourcereservation and allocation, as well as system parametertuning (e.g., [6, 12, 25]).Recently, large-scale multimedia communication systems have been deployed in enterprices and the publicInternet. Consequently, many QoS problems are observed [18] and analyzed [8]. Also, QoS assessmenttechniques are developed to better evaluate real systems [11, 23].Many network diagnostic tools can be used to identify system performance problems [3, 14]. Specific toolsfor troubleshooting multimedia systems are also introduced, for example, the Giza tool set for IPTV systemdiagnosis [17]. Different from these systems, the scopeof QoSaaS is much broader and beyond localizing failurepoints in the systems.There are other proposed services that end-users canquery for coarse-grained network delay, loss rate, cost,and other path properties (e.g., P4P and ALTO service [22, 26], iPlane [15, 16], and Sequoia [21]). QoSaaSdiffers from these services as it aims at improving thequality of real-time multimedia communication systems.In such systems, many problems occur only in small timeresolution. Therefore, the QoS service is required to provide quality estimation at much finer granularity. In addition, problems could be due to local impairments. So,the QoS service also needs to distinguish the local im-pairments from infrastructure problems.One of the core components of QoSaaS is the inference engine. There are a lot of related studies in the network tomography area [4, 5, 7, 9, 10, 27]. Different fromthe linear topology model and sampled measurements inthese studies, we employ a Maximum Likelihood basedinference algorithm that derives quality estimates usingaggregated measurements from a large number of VoIPsessions.References[1] M. K. Aguilera, J. C. Mogul, J. L. Wiener, P. Reynolds, and A. Muthitacharoen. Performance debugging for distributed systems of black boxes.In ACM SOSP, 2003.[2] Y. Amir, C. Danilov, S. Goose, D. Hedqvist, and A. Terzis. 1-800OVERLAYS: using overlay networks to improve VoIP quality. In NOSSDAV, 2005.[3] P. Bahl, R. Chandra, A. Greenberg, S. Kandula, D. A. Maltz, and M. Zhang.Towards highly reliable enterprise network services via inference of multilevel dependencies. ACM CCR, 37(4), 2007.[4] A. Bestavros, J. W. Byers, and K. A. Harfoush. Inference and labeling ofmetric-induced network topologies. IEEE Trans. Para. Dist. Syst., 16(11),2005.[5] T. Bu, N. Duffield, F. L. Presti, and D. Towsley. Network tomography ongeneral topologies. ACM SIGMETRICS Perf. Eval. Review, 30(1), 2002.[6] A. Campbell, G. Coulson, and D. Hutchison. A quality of service architecture. ACM CCR, 24(2), 1994.[7] R. Castro, M. Coates, G. Liang, R. Nowak, and B. Yu. Network tomography: Recent developments. Statistical Science, 19(3), 2004.[8] A. Clark. VoIP performance management. In Internet Telephony Conference, 2005.[9] M. Coates, R. Castro, R. Nowak, M. Gadhiok, R. King, and Y. Tsang. Maximum likelihood network topology identification from edge-based unicastmeasurements. In ACM SIGMETRICS, 2002.[10] M. J. Coates and R. D. Nowak. iplane nano: path prediction for peer-to-peerapplications. In ITC Conference on IP Traffic, Modeling and Management,2001.[11] R. G. Cole and J. H. Rosenbluth. Voice over IP performance monitoring.ACM CCR, 31(2), 2001.[12] J. Gozdecki, A. Jajszczyk, and R. Stankiewicz. Quality of Service terminology in IP networks. IEEE Communications Magazine, 2003.[13] M. Jain and C. Dovrolis. Path selection using available bandwidth estimation in overlay-based video streaming. Computer Networks, 52(12), 2008.[14] S. Kandula, R. Mahajan, P. Verkaik, S. Agarwal, J. Padhye, and P. Bahl.Detailed diagnosis in enterprise networks. In ACM SIGCOMM, 2009.[15] H. V. Madhyastha, T. Isdal, M. Piatek, C. Dixon, T. Anderson, A. Krishnamurthy, and A. Venkataramani. iPlane: an information plane for distributedservices. In USENIX OSDI, 2006.[16] H. V. Madhyastha, E. Katz-Bassett, T. Anderson, A. Krishnamurthy, andA. Venkataramani. iPlane Nano: path prediction for peer-to-peer applications. In USENIX NSDI, 2009.[17] A. A. Mahimkar, Z. Ge, A. Shaikh, J. Wang, J. Yates, Y. Zhang, andQ. Zhao. Towards automated performance diagnosis in a large IPTV network. In ACM SIGCOMM, 2009.[18] A. P. Markopoulou, F. A. Tobagi, and M. J. Karam. Assessing the quality of voice communications over Internet backbones. IEEE/ACM Trans.Networks, 11(5), 2003.[19] A. Mondal, R. Cutler, C. Huang, J. Li, and A. Kuzmanovic. SureCall:Towards glitch-free real-time audio/video conferencing. In IWQoS, 2010.[20] H. Radha, M. van der Schaar, and Y. Chen. The MPEG-4 fine-grainedscalable video coding method for multimedia streaming over IP. IEEETrans. Multimedia, 3:53–68, 2001.[21] V. Ramasubramanian, D. Malkhi, F. Kuhn, M. Balakrishnan, A. Gupta, andA. Akella. On the treeness of Internet latency and bandwidth. In ACMSIGMETRICS, 2009.[22] J. Seedorf and E. Burger. Application-Layer Traffic Optimization (ALTO)Problem Statement, RFC 5693, October 2009.[23] L. Sun. Voice quality prediction models and their application in VoIP networks. IEEE Trans. Multimedia, 2006.[24] S. Tao, K. Xu, A. Estepa, T. Fei, L. Gao, R. Guerin, J. Kurose, D. Towsley,and Z.-L. Zhang. Improving VoIP quality through path switching. In IEEEINFOCOM, volume 4, 2005.[25] A. Vogel, B. Kerhervé, G. v. Bochmann, and J. Gecsei. Distributed multimedia applications and quality of service: a survey. In CASCON, 1994.[26] H. Xie, Y. R. Yang, A. Krishnamurthy, Y. G. Liu, and A. Silberschatz. P4P:provider portal for applications. In ACM SIGCOMM, 2008.[27] Y. Zhao, Y. Chen, and D. Bindel. Towards unbiased end-to-end networkdiagnosis. IEEE/ACM Trans. Networks, 17(6), 2009.
nent affects VoIP quality end-to-end. Indeed, the aim of the proposed QoS Service is to fill such a void. 3 QoSaaSDesign The goal of the QoS service is to provide QoS informa-tion so as to substantially improve the user experience of real-time applications in enterprises. In a nutshell, the QoS service aggregates end-to-end quality measure-