Transcription
ITU Asia-Pacific CoE TrainingBroadband Quality of Service - EndUser ExperienceSession 6: Key PerformanceIndicators: Role and Decision Making27-30 October, 2015Bangkok, ThailandITU Regional Office for Asia and the Pacific
Objective: The session will detail the variouskey performance indicators used by operatorsand regulators in arriving at service levelagreements and end user QoS monitoring
Mobile KPIs– centric to equipment / infrastructure– aggregation of proprietary network counters– not standardized ITU-T Documents on Mobile QoS– Recommendation E.803 Quality of service parameters for supporting service aspects– Recommendation E.804 QoS Aspects for Popular Services in Mobile Networks– Supplement 9 to E.800 series of Recommendations Guidelines on Regulatory Aspects of QoS Other ITU-T Recommendations on QoS cover– Aspects of Terminal requirements– Aspects of end-to-end quality– Aspects of user perceptions3
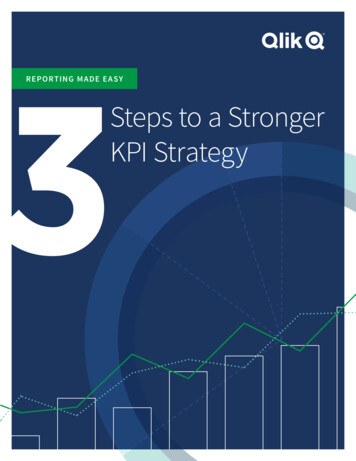
QoS model for mobile has four layers. First layer is the Network Availability– defines QoS rather from the viewpoint of the service provider thanthe service user Second layer is the Network Access– from user's point of view basic requirement for all the other QoSaspects and parameters Third layer contains other QoS aspects– Service Access, Service Integrity & Service Retainability Different services are located in the fourth layer– Their outcome are the QoS parameters as perceived by the user4
NetworkAvailabilityLayer 1NetworkAccessibilityLayer VideoTelephonyWebBrowsing5Layer 3Layer 4
If we follow the layered approach– focussing on events that can be perceived bythe user– focussing on most relevant services in themarket Telephony SMS MMS Video Telephony Video Streaming Web Browsing6
Layer 1Radio Network Unavailability [%]Layer 2Network Selection and Registration FailureRatio [%]7
Telephony Layer 3– Telephony Service Non-Accessibility [%] Telephony Layer 4– Telephony Setup Time [s]– Telephony Cut-off Call Ratio [%]8
SMS Layer 3– SMS Service Non-Accessibility [%] SMS Layer 4– SMS End-to-End Delivery Time [s]– SMS Completion Failure Ratio [%]9
MMS Layer 3– MMS Send Failure Ratio [%] MMS Layer 4– End-to-End Delivery Time [s]– MMS End-to-End Failure Ratio [%]10
Video Telephony Layer 3– VT Service Non-Accessibility [%] Video Telephony Layer 4– VT Audio/Video Setup Time [s]– VT Cut-off Call Ratio [%]11
Streaming Video Layer 3– Streaming Service Non-Accessibility [%] Layer 4:– Streaming Service Access Time [s]– Streaming Reproduction Cut-off Ratio [%]12
Web Browsing (HTTP) Layer 3– HTTP Service Non-Accessibility [%] Web Browsing (HTTP) Layer 4– HTTP Setup Time [s]– HTTP Session Failure Ratio [%]– HTTP Data Transfer Cut-off Ratio [%]13
This approach would make us end up with 20 QoS parameter– All relate to user perceptional events– But this is just end-to-end parameters– Many more parameters defined for events relatedto network segments, hand-over etc.14
Test Scenarios Test scenarios need to distinguish the followingprincipal user cases– User-to-user services (typically telephony)– Store-and-forward services (e.g. SMS)– Information services (e.g. accessing the internet orFTP download)– Push services (sender initiated transfer)15
Considerations on trigger points It can be assumed that– any feasible test equipment will contain some kind of communicationterminal (UE) which may be a special type (e.g. a Trace Phone)– or a standard UE Also, it can be assumed that each such device will provideinformation from different communication layers– from Application Layer (close to the user interface)– down to lower layers, e.g. operating-system events, TCP/IP layer, or Layer3 signalling information, which is used as trigger points for QOSPARAMETERS processing– Typically AT commands can be used in majority of cases Action is typically triggered– by some emulated user action– causing some action on the air interface16
Process of event propagation is deterministic– allowing for kind of mapping between layers– associated with communication and processing delay in each stage. Choice of the layer for trigger point information retrieval–––– determines the view expressed in a QOS PARAMETERchoosing lower-level events ( Layer 3) gives more network-centric viewevents on higher levels to produce views more user-relatedfor same QoS PARAMETER source layer for events used as trigger points should be the sameIn benchmarking, for all all networks under test– use same type of UE, and QOS PARAMETERS– use trigger points from the same layer. Changing the source layer for a given trigger point– changes in QOS PARAMETERS should be expected– calibration measurements required to assess influence on QOS PARAMETERS both quantitatively and qualitatively.17
Telephony Measurements in the Network Transaction definition and transaction types– The basic transaction for telephony testing is equivalent toa single call to a counterpart extension. It is assumed thatthe call partner is typically a fixed-network type extensionto avoid uncertainties related to a second mobileconnection.– Type is either Mobile Originated (MO) or MobileTerminated (MT).– It is assumed that once a connection has been established,for further measurements it does not matter which sidehas triggered it. Therefore, the audio data flow parameterwill not be logically linked to the call type.18
Content quality– Content quality assessment data generated atreceiving end– For downlink content data storage isstraightforward– For uplink content, at some point in time resultshave to be integrated– For assessing content quality of completetransmitted speech samples, at least the followingmethods are possible:19
Content quality (ctd.)– Real-time assessment streaming mode speech quality assessment algorithm determines MOSLQO real time– Offline assessment content first recorded being processed later– Data processing must ensure that only validcontent quality data is processed inside the "connection active" time window20
Verification of usable two-way connection Only calls with a valid two-way end-to-endinformation connection shall be consideredfor content quality assessment (valid calls). Non-valid calls treated like dropped calls– with indicator for this particular cause21
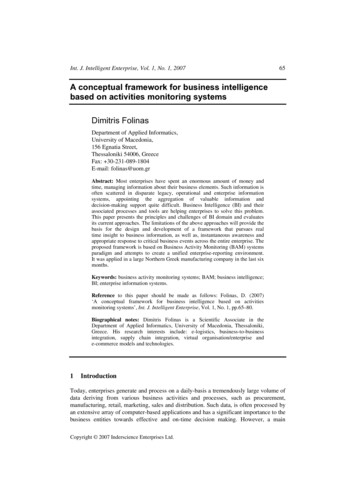
Statistics – Presentation of Results Effect of different sample sizes in a measurement campaign– based on the Pearson-Clopper formulas for calculation of confidenceintervals– valid in a generic way and even for small sample sizes– for higher sample numbers, the calculation of confidence intervals basedon the approximation of a normal distribution can be applied– Three different graphs are depicted: Sample sizes in the range: between 100 and 1 100 samples; between 1 100 and 2 100 samples; and between 1 000 and 11 000 samples.22
302520x xxx xxx xxxxxx x8076x ox0406080Estimated rate in percent1000 Samples3000 Samples5000 Samples7000 Samples9000 Samples11000 Samples410023xx xxx xxx xxx xxx xxx xxx xxxxxxx xxx x000000 0000000x 0 0 00 0 0 x x x x x x x x x x x x x 0 0 00 0 0 xx 0 0 0 x x x x x x x x x x x x 0 0 0 x x x x 0 0 x x 0 0 0xx x x 0 0 x x x x 0 0 x0 0 xx x xx xxxx00 0 xx x 0 0 xx x00x 2x ox20ox ox xx02345xxx xxx xxx xxxxxxxx x x xx x xx x xo o oo ooo oo o o o o xx o ooxox oo x x x x x x x x x x x x x oo xx o o x x x x x x x x o o xoo x xx o x x o x x x o xx o x x o x o xxx ox x ooxx x o xx x o o x x x o xo x o 1100 Samplesx o x x ox x x 1300 Samples ooxx1500Samplesx x oo 1700 Samplesoxx x 1900 Samplesx x 2100 Samples xoxo 1001060840Width of confidence interval in percent20650x xxx xxEstimated rate in percent1Width of confidence interval in percen0xxxxx xxxx xxx xx xxx o oo o ooo ooo ooo oo o o x oooo o o o x xxxxxxxxxxxxx o o o o oxxxxx x x x x x x o o o xxx o o o x x x x x x x o o x xoo xxx x o o xxx xx x o ox o o xx xxx xo o xx xoox xx ooxx xx0100 Samples300 Samples500 Samples700 Samples900 Samples1100 Samples1510Width of confidence interval in percentox ox xxxxx xxx0 0xx0 20406080Estimated rate in percent100
Which pieces of information should be given tothe reader when generating a test report ?– When quantile values are used, it should be kept inmind that the computation of quantiles separates alow percentage of outlier data from the remainingdata. This means: If lower values represent a better outcome from thecustomer's perspective, a small percentage containing thehighest values could be separated by calculating a 95 %quantile or a 90 %-quantile. This is the case for example forduration values.24
If higher values represent a better outcome from thecustomer's perspective, a small percentage containing thelowest values could be separated by calculating a 5 %quantile or a 10 %-quantile. This is the case for example forthroughput values. Related to content quality, the appropriate quantilecomputation orientates itself on the scale of thedetermined test results. In practice, some algorithmsdefine a value of 0 on a scale from 0 to 5 as the bestquality whereas others define the value of 5 as the highestpossible quality25
KPIs based on Network Counters Vendor specific network internal KPIs– different strategies how to count network events which events are included in which counter(s) Requires knowledge of specific system– specialists with detailed system knowledge– testing the counters documentation may be faulty approach to counter change with system update Mobile operators have challenges with this– most operator live in a multi vendor environment– counters from different vendors cannot be directlycompared– requires continous attention and a strategy26
KPIs from Users' Perspective KQIs Key Quality Indicators (KQIs) externalindicators– can be assessed in the Field For Monitoring, Regulation etc.– a subset can be selected applicable across all vendors & operators not limited to mobile, but also good for broadband27
KPIs versus KQIs Sometimes confused– KPIs internal indicators part of network performancebased on network countersessential for operation, maintenance, business modelcould be reported, audited etc.however, meaningless when out of context– KQIs external indicators basis for QoS assessment as perceived by the uservendor independantoperator independantideal to compare different operators on a statistical basiscannot be reported from the system itselfrequires some kind of field testing, drive, walk etc.28
.towards a new Recommendation From best practice of Project SelfMeasurement (PSM). . to a standardized benchmarking platform– employing the operational equipment of theservice provider– thus assessing quality from a true user perspective29
Offer of new services requires– new KPIs– QoS measurements– benchmarking methods In order to ensure the quality of new services– comparability of test results– reference benchmarking methods– background traffic load profiles are needed for– the spectrum of potential applications– including all access technologies– operational equipment used by the operator under test30
Potential Applicationsanalogue (a/b)ISDNVoIP (including SIP trunking)High-speed internetWebsite benchmarkingIPTVUMTSVoLTEViLTE.31
Relevant for a real-world environment– Encompassing a mix of technologies This approach ensures that service quality isevaluated from a customers' point of view– All system components involved in a real end-to-endconnection are incorporated into the test– .32
Multiplay and Benchmarking Platform Can be distributed– across a larger region or– across an entire country Could include several server systems including:business intelligence platformdata warehousemanagement systemsystem for evaluating of media (e.g. video, audio andvoice) quality– .––––33
34
Simultaneous transmission of Voice and Data Realistic user related scenarios– uploads, downloads or use of IPTV in parallel to voice connections adaptive video streaming– sophisticated measurement of the media quality35
single voice channel test consists of thefollowing parts:– through connection quality test– listening speech quality test– DTMF test36
Through Connection Quality test The through connection quality test starts with a listeningspeech quality test from B to A after the connection isestablished. For the analysis of the initial listening speech quality afterthrough connection has been established the methodaccording to Recommendation ITU-T P.863 in SWB modebased on only two sentences (one female voice and one malevoice) is used. For this purpose a male voice ("Four hours ofsteady work faced us") and a female voice ("The hogs werefed chopped corn and garbage") were selected from the testsentences provided in Recommendation ITU-T P.501, Annex C37
Listening Speech Quality testThe transmission listening speech quality test is using the Recommendation ITU-T P.863analysis method in SWB Mode based on eight sentences (two male and two female voices,two sentences each).––––– For example the following English samples were selected from the test sentences provided inRecommendation ITU-T P.501, Annex C:Female 1: These days a chicken leg is a rare dish.The hogs were fed with chopped corn and garbage. Rice is often served in round bowls.A large size in stockings is hard to sell. The juice of lemons makes fine punch.Four hours of steady work faced us. The birch canoe slid on smooth planks.Glue the sheet to the dark blue background.Female 2:Male 1:Male 2:If the global performance data are of interest, optionally the male and female test sentencesof other languages provided in Recommendation ITU-T P.501, Annex C can be used38
Example of multiple voice channel access testCALL A 4 - B 4CALL A 3 - B 3CALL A 2 - B 2CALL A 1 - B 1CALL A 4 - B 4CALL A 3 - B 3CALL A 2 - B 2CALL A 1 - B 1CALL A 4 - B 4CALL A 3 - B 3CALL A 2 - B 2CALL A 1 - B 1CALL A 4 - B 4CALL A 3 - B 3CALL A 2 - B 2CALL A 1 - B 1CALL A- B10020039300400Time
Relative TimeT0 - 2T0Multiple voice channel testTest equipment ASETUP / INVITEALERTING /180 RingingCONNECT / 200 OKCONNECT ACK/ACKNETWORK Test equipment BSETUP / INVITEALERTING /180 RingingCONNECT / 200 OKCONNECT ACK/ ACKStart through connection quality testT0Start Audio SendBA 1 (male &female)Start Audio ReceiveBA 1End Audio ReceiveBA 11sT0 10 sStart Audio SendAB 1 (female 1)End Audio SendAB 1(female 1) Start Audio Receive BA 1(female & female)Start Audio Send BA 1 End Audio Send BA 1Stop through connection quality testTransmission quality test 40Start Audio Receive AB 1(female 1)End Audio Receive AB 1(female 1)
Relative TimeT0 - 2T0Test equipment ASETUP / INVITEALERTING /180 RingingCONNECT / 200 OKCONNECT ACK/ACKNETWORK Test equipment BSETUP / INVITEALERTING /180 RingingCONNECT / 200 OKCONNECT ACK/ ACKStart through connection quality testT0Start Audio SendBA 1 (male &female)Start Audio ReceiveBA 1End Audio ReceiveBA 11sT0 10 s1sStart Audio SendAB 1 (female 1)End Audio SendAB 1(female 1)Start Audio SendAB 2 (female 2)End Audio SendAB 2(female 2)Start Audio SendAB 3 (male 1)End Audio SendAB 3(male 1)Start Audio SendAB 4 (male 2)End Audio SendAB 4(male 2)PauseStart Audio ReceiveBA 1 (female 1) Start Audio Receive BA 1(female & female)Start Audio Send BA 1 End Audio Send BA 1Stop through connection quality testTransmission quality test 41Start Audio Receive AB 1(female 1)End Audio Receive AB 1(female 1)Start Audio Receive AB 2(female 2)End Audio Receive AB 2(female 2)Start Audio Receive AB 3(male 1)End Audio Receive AB 3(male 1)Start Audio Receive AB 4(male 2)End Audio Receive AB 4(male 2)Start Audio Send BA 1(female 1)
Early media listening speech quality Early media refers to media (e.g. audio and video) which areexchanged before a particular session is accepted by thecalled user (in terms of the signalling). Within a dialogue,early media occurs from the moment the initial INVITE is sentuntil the User Agent Server (UAS) generates a final response.It may be unidirectional or bidirectional, and can begenerated by the caller, the called party, or both. Typicalexamples of early media generated by the called party areringing tone and announcements (e.g. queuing status). Earlymedia generated by the caller typically consists of voicecommands or dual tone multi-frequency (DTMF) tones todrive interactive voice response (IVR) systems.42
Early media SIP overviewINVITESession Progress 183PRACKEARLY MEDIA200 OKMedia43
Call set up delayCall setup delay configurationsFromToVoLTEMMTel (IMS) fixed accessMMTel (IMS) fixed accessVoLTEVoLTEVoLTEUMTSIMS PES with AGCF with AGCF (orPSTN or ISDN Access)IMS PES with AGCF with AGCF (orPSTN or ISDN Access)UMTSIMS PES with AGCF with AGCF (orPSTN or ISDN Access)LTE with CS fallbackUMTSIMS PES with VGWIMS PES with VGWUMTSIMS PES with VGWLTE with CS fallbackUMTSUMTSUMTSLTE with CS fallback44
Connections with parallel data transferConnectionswith paralleldata transferVoice fromDatafromVoice toData toVoLTELTEMMTel (IMS) fixed accessWEB ServerVoLTELTEVoLTEWEB ServerLTE Mobilenetwork withCSFBUMTSLTE Mobilenetwork withCSFBLTEIMS PES with AGCF withAGCF (or PSTN or ISDNAccess)WEB ServerUMTSIMS PES with AGCF withAGCF (or PSTN or ISDNAccess)WEB ServerLTEIMS PES with VGWWEB ServerUMTSUMTSIMS PES with VGWWEB ServerUMTSUMTSUMTSWEB Server45
.under ConstructionGamingAdaptive video streamingIPTVHigh speed internetMultithreaded broadband test.46
Current ITU proposed approach47
48
Case Study from existing country (NN) Regulator considers to measure the followingKPIs with his own resources: Mobile services: Radio network unavailabilityCoverageUnsuccessful call attempt -internationalCall set up timeNetwork latencyAverage HTTP Mean Data Rate and RatioPacket lossJitterITU ASP ROSource: ITU49
SMS End to End Delivery Time - InternationalSMS Completion Failure Ratio – InternationalVideo Streaming Service Non AccessibilityVideo Streaming Reproduction Cut-off RatioHTTP Service Non AccessibilityHTTP Set-up TimeHTTP Session Failure Ratio– Fixed services: Network latencyAverage HTTP Mean Data Rate and RatioPacket lossJitterITU ASP ROSource: ITU50
Video Streaming Service Non AccessibilityVideo Streaming Reproduction Cut-off RatioHTTP Service Non AccessibilityHTTP Set-up TimeHTTP Session Failure Ratio In addition the regulator will measure thefollowing KPIs which have to be alreadymeasured by the operators (doublechecking):ITU ASP ROSource: ITU51
– Mobile services: Unsuccessful call attempt -NationalCall Set-up TimeDropped Call RatioVoice QualitySMS End to End Delivery Time - NationalSMS Completion Failure Ratio - National– Fixed service KPIs: Unsuccessful call attemptCall Set-up TimeDropped Call RatioVoice QualityITU ASP ROSource: ITU52
Types of measurements OECD report categorises the types of clientsthat initiate each performance test at the enduser side and examines their characteristics:––––End-user Application Measurement (EAM)End-user Device Measurement (EDM)Project Self Measurement (PSM) andPSM by Internet Service Provider (PSM-ISP)53
Official measurement projects in OECD area “Mobile” is Yesif any indicator is provided in publicised data to showperformance of Internet access by a mobile access technology(LTE/3G/Wi-Fi ) which can be used in motion. Measurements can be undertakenat fixed points. Categories of metrics are as follows: DATA, also referred to as Internet speed, is amount of datatransferred within a certain time such as a second between aclient and a server; DNSR is DNS response time; WEB is length oftime to load an webpage from a certain major website to aclient; LT is latency; JT is jitter; PL is packet loss54
Countryor organizationAustriaChileFranceClienttypeMobile PurposesEAMYesPSM-ISPPSMYesYesMeasured metricsConsumer protection, DATA,LT,JT,PL (DNSRCompetitionand WEB areenhancement,planned)Network development(information onnetwork quality),Net neutrality(planned)Quality of servicesindicatorsVerification of licenseobligations, consumerprotection, competitionenhancement, networkdevelopmentDATA, DNSR andAggregation rate.(parameters informedby operators, notnecessarily verified bySUBTEL)Number ofGeographical andtopological location of clientsImmediate proximity tothe Vienna Internetexchange (VIX)Depending on ISPDepending on ISP(Example: domestic on-netand off- net servers as wellas an US server, statisticsreported for each)Voice quality, SMS,off-net (dedicated to theMMS, data rates (DL and study) for data rateUL), web surfing, video measurementservice quality55Approx. 27 000clients, 300 000tests, (currentvalue, on- goingmeasurements)Measures in 2000different locations(for a total ofabout20.000 tests foreach operator)
Countryor organizationMeasured metricsNumber ofGeographical andtopological location of clientsConsumer protectionNet neutralityPlatform measurement:DATA, DNSR, WEB, LT,HTTP response timeEnd user measurement:DATAOff net with a directconnection to domesticpoints of interchangebetween the networks ofdifferent operatorsNoConsumer protectionCompetitionenhancement, NetneutralityDATA, LT, JT, PL, ISP'srestriction on certainNearest available M-Labservices such as P2P and servervideo streamingYesConsumer protection. DATA, LT, PL, error rate.The results can be used Only for mobile: WEB,as evidence in casesweb failure rate, JTwhere promised speedis not realized and thusthe user wishes toexercise the right ofwithdrawal of contractClienttypeMobile PurposesEAMand PSMYes forPSMGermanyGreeceItalyEAMPSMand EAM(fixed), PSM(mobile)56Domestic points ofinterchange between thenetworks of differentoperators (Rome andMilan)Approx. 550thousands endusers and 26 pointsof platformmeasurementApprox. 10000usersFixed: 21 points forPSM, 25 535 enduser softwaredownloads forEAMMobile: 1013points in 20 cities
Countryor organizationClienttypeMobile PurposesEAM forfixed, PSMfor mobileKoreaMexicoYesEAMYesNew ZealandNorwayEDMNoEAMYesMeasured metricsFixed : DATA, WEBMobile: WEB, Rates of"successful'' downloadand upload that wereConsumer protectionNetwork development faster than certainspeed, web loadingtime, (calling quality)Number ofGeographical andtopological location of clientsISP on-net serverN/ADATA, LTConsumer protectionCompetitionenhancementDATA, WEB (onshoreAuckland and Wellington inand offshore), LT, JT, PL, the country, Sydney inDNSRAustralia, Dallas in the USConsumer protectionDATA, LT57Mexico cityNorwegian Internetexchange200 points formobile PSM, 2000users from each ISPfor fixed EAM(Approx. 1 milliontests per month)N/A(Approx. 8000 testsdone in September2013, if the testsfor ISPs with morethan 40 tests arecounted)
Countryor organizationClienttypeMobile PurposesMeasured metricsPortugalEAMNoConsumer protectionMarket supervision NetDATA, LT, traffic shapingneutralitySpainPSM-ISPYesConsumer protectionNoConsumer protectionCompetitionenhancement, NetneutralitySloveniaSwedenEAMEAMYesDATA, successful log-inratio (probability ofsuccessful connectionsto the ISP for Internetbrowsing), unsuccessfuldata transmission ratio(probability of filetransmissions withouterror)DATA, LTConsumer protection,self-help, ISP- statistics,reportsDATA, LT58Number ofGeographical andtopological location of clientsAccordance with Section5.2 of ETSI 2005 (ideally theserver should be as near aspossible to the gateway ofthe measured ISP to theaccess network but finalchoice has to be made bythat ISP)More than 210clients (probes)deployed for eachmeasured service.5.6 million testsper year performedin total.Server is located inLjubljana at the webhosting provider with a 1Gbit/s connectivity to theinternet.Measurement is atthe early stage.Currently 220 tests.5 locations close to urbancenters of Sweden.Stockholm, Malmö,Gothenburg, Sundsvall,Luleå100000 users/day,100 million sincelaunch 2007.
Countryor organizationTurkeyClienttypePSM-ISPUnited Kingdom EDMMobile PurposesNoConsumer protectionand CompetitionenhancementNoConsumer protectionFixed EDM,Mobile EAMUnited StatesYesEuropeanCommissio nConsumer protectionMeasured metricsDATAThe cities are categorizedinto five groups accordingto internet traffic from high Underto low. ISPs pick two cities developmentfrom each category.DATA, WEB, LT, PL, JT,DNSR5 servers located in London Approx. 2000and its outskirtsdevicesDATA, WEB, LT(UDP andICMP),PL(UDP and ICMP),video streaming, VoIP,DNS R, DNS failures,latency under load,availability ofconnection, dataconsumptionCore measurement points: Fixed: Approx. 70009 geographically diversedevices Mobile:off-net servers placed by (Just started)M-Lab Secondary points:121 on-net servers placedby ISPs(Results are based on offnet points only. On-netpoints are to checkdifferences)Network development(Digital Agenda forEurope)EDMNoNumber ofGeographical andtopological location of clientsDATA, WEB, LT, PL,DNSR, VoIP5924 M-Lab test nodes and 11SamKnows servers in 14cities across Europe. All areoff-net points and located Approx. 9000atdevicesmajor peering points orIXPs
Any questions ?Contact:Consultant@joachimpomy.de60
IMPROVING QUALITY OF GovernanceApplicationsPolicy & RegulationCapacity BuildingSensor NetworksTransportUniversal BroadbandGreen ICT & E-WasteMeasurementsElectricityPrivacy & SecurityInfrastructure SecurityWaterSMARTSUSTAINABLECITIESDigital InclusionSpectrum ManagementStandards, Conformity &C&IInteroperabilityTeleworking
- defines QoS rather from the viewpoint of the service provider than the service user Second layer is the Network Access - from user's point of view basic requirement for all the other QoS aspects and parameters Third layer contains other QoS aspects - Service Access, Service Integrity & Service Retainability