Transcription
Abasyn Journal of Social Sciences – Volume: 9 – Issue: 1Impact of Technology Quality, Perceived Ease of Use and PerceivedUsefulness in the Formation of Consumer’s Satisfaction in theContext of E-learningHassan Jalil ShahPh.D. Scholar, National Defense UniversitySaman AttiqNational Defense UniversityAbstractThe purposes of this research is to find out the impact oftechnology quality, perceived ease of use and perceived usefulness in theformation of consumer’s satisfaction in the context of E-learning. Datawas collected by using online questionnaire form 1338 students of virtualeducation system universities. It was concluded that that consumersperceive a high quality e-learning system to be useful with respect totheir needs and they also consider a high quality technology easy to use.The results imply that if an e-learning system is useful, then the customerwould be satisfied. Consumers have favourable feeling of satisfactionwith e-learning when it is perceived to be useful and easy to use. Thisstudy provides a valuable insight and sound ground for academicianswho are interested in studying technology quality, perceived ease of useand perceived usefulness in context of E-learning. It also presentsvaluable insights for practitioners and policy makers and it has revealedimportant findings and implications for aforementioned context.Key words: Technology quality, perceived ease of use and perceivedusefulness, E-learningThe profound changes in the recent market trends have shapedthe powers of market actors, the nature of competition, their prioritiesand orientations. These changes are the result of consumer empowermentthrough which consumers have become an independent and active forcein the market place (Ali, 2007; Barrutia & Charterina, 2006; Economist,2005). According to Mackay, (2008); Barrutia and Charterina (2006);Stolle and Micheletti (2005); and Smith and Sivakumar (2004) ease ofcommunications across the globe, developments in informationtechnology, wide exposure to media and entertainment, widespreadaffluence, and education are accountable for the aforementionedtransformations in consumer behavior. Consequently, the research onconsumer behavior has become a matter of dire importance for bothacademia and practitioners.In an era of rapidly growing globalization, marketing managersare faced with wide range of challenges and opportunities in developinga suitable marketing plan and strategy for customers of differentgeographies and characteristics. In the modern business, the competitionis transformed from price to non-price which requires that not onlymarkets but the tools of marketing must also be thoroughly researched.124
Abasyn Journal of Social Sciences – Volume: 9 – Issue: 1The core responsibility and a challenging task for marketer is tounderstand the basis on which consumers take decision between differentavailable alternatives (Huang, Lurie, and Mitra, 2009; Lin, Wang, andHwang, 2010). Since the consumer gather and process information infundamentally different ways, resultantly, there is a significant differencein adoption of a product/services. Difference in adoption of aproduct/service is not only due to the characteristics of theproduct/services itself, but also due to the distinctive behavior andcharacteristics of the consumer. Informational sources, hence play animportant role in behavior of a consumer. Product or service attributesare key factors in the formation of consumer attitude and behavior.Product attributes may include price, quality, efficacy, performance,functionality etc (Zeithaml & Valarie, 1988).In the current era of e-commerce, besides a wide array ofproducts and services, consumers also have to deal with huge amount ofinformation. Service quality is one of the core concepts of marketing fordeveloping customer satisfaction (Han & Ryu, 2009). Customersatisfaction is the focal point of the marketers since it is the prerequisiteof customer loyalty for instance word of mouth repurchase intentions(Liu & Jang, 2009). Consequently, in intensely competitive market,service quality is a key for gaining competitive advantage (Han & Ryu,2009).The tumultuous growth of internet provides a wide space forelectronic services like e-learning. E-learning is one of the emergingparadigms of modern education as it is a tool for delivering informationfor training and education. E-learning network models provide freedomin interaction between instructor and learners (Katz, 2002). E-learning isa tool which is equipping institutes of higher education and businesses inmeeting the demands of modern society. The e-learning market isobserving a growth rate of around 35.6 percent (Wu, Tsai, Chen, & Wu,2006). Various companies, training and educational institute areinvesting a large amount of money and devoting great efforts for thedevelopment of e-learning programs for users (Chiu, Sun, Pei-Chen, &Ju, 2007). The origin of the term e-Learning remains ambiguous and acomprehensive definition by Rosenberg (2001) has defined e-learning as“E-Learning refers to the use of internet technologies to deliver a broadarray of solutions that enhance knowledge and performance” (p.28).Significance of the studyThe advent of ICT has revolutionized every dimension of humanlife. Technology has had a profound impact on the field of learningthroughout the history, hence, the ICT revolution has impacted theeducational landscape to an extent that it is completely embedded inevery dimension of learning today (Kurti, 2009; Kravitz, 2004). Thecustomization of technology in the field of learning has led to theconcept of „Technology Enhanced Learning‟ (TEL), which, consisting of125
Abasyn Journal of Social Sciences – Volume: 9 – Issue: 1learners and technology provide socio-techno innovations to supporteducational practices in a variety of settings (Balacheff, 2006; Kurti,2009).Problems in Technology AcceptanceHowever, to remain competitive in the exponential growth in theICT and increasingly affordable environment, online educationalinstitutions imparting e-learning need to develop new online deliverymethods (Olson, 2005). Technical problems in the acceptance oftechnology mediated learning environment include; limited the access toservices; infrastructural inadequacies characterized by lack of internetconnection (Aduwa-Ogiegbaen & Iyamu , 2005).Research carried out on E-Learning in PakistanIn Pakistan, many qualitative studies have been carried out onthe area of „efficacy of e-learning‟ by Farid, Ahmad, & Alam (2015),„challenges in implementation of e-learning in Pakistan‟ (Farid S. ,Ahmad, Niaz, Imtiazi, & Asghar, 2014). „M-Learning in Pakistan‟(Yasira, 2014), „failures of E-Projects of e-learning (Nawaz, 2014),attitude towards e-learning (Jawaid, Hafeez, Khan, & Khalique, 2013),„problem of implementing e-learning in comparison of developedcountries (Ayesha & Mariam, 2013), „e-health initiatives in Pakistan(Qureshi, et al., 2013). Similarly, Nawaz (2012) and Hussain (2012)identified lack of knowledge about technology, ineffective user training,lack of user perception, borrowed e-learning models, lack of technicalsupport and digital divide as the main stumbling blocks inimplementation of e-learning in Pakistan. Another study carried out byNiwaz, Kayani, and Kayani (2011) was designed to highlight thecontributions of „Virtual University of Pakistan‟ and proffer some viablerecommendations including the need for creation of awareness about elearning in Pakistan and improving physical and human resources toattract a better talent in the e-learning stream (Niwaz, Kayani, & Kayani,2011). Sind University conducted a study in 2011 to explore the impactsof information technology trends on e-learning process in Pakistan (Ali,Ahmed, Shaikh, & Bukhari, 2011).However, there is dearth of literature concerning userunfavourable attitude after initial experiences. Research regardinginformation technology clearly shows that satisfaction is one of thesignificant contributors for the successful implementation of e-learningsystems (DeLone & Mclean, 1992). There are several factors that mayaffect the satisfaction of e-learners like environmental dimensions,system design, technology (Arbaugh J. B., 2002; Chen and Bagaksa,2003; Thurmond, Wambach, Connors, and Frey, 2002; system quality(Calisir, Gumussoy, Bayraktaroglu, and Karaali, 2014); perceivedusefulness and ease of use (Pituch and Lee, 2006) etc. Based onextensive review of literature, the current study has three majorobjectives.126
Abasyn Journal of Social Sciences – Volume: 9 – Issue: 1Research Objectiveso To investigate the impact of technology quality on consumer‟sperceived ease of use, and perceived usefulness in the context ofe-learning.o To investigate the impact of consumer‟s perceived ease onperceived usefulness in the context of e-learning.o To investigate the impact of consumer‟s perceived ease andperceived usefulness on consumer‟s satisfaction in the context ofe-learning.Literature ReviewConsumer Satisfaction in the context of e-learningThe success of e-Learning depends upon the user intention tocontinue using an e-learning service. Furthermore, critical success factorfor building long term relationship is satisfaction (Lee M. , 2010).Satisfaction is defined as “affect or feeling or emotion resulting fromone‟s evaluation of the situation”. The concept of satisfaction as affectincludes both positive affect (satisfaction) and negative affect(dissatisfaction) (Savickas, 1994). Positive affective response to asituation determines consumer satisfaction from individual‟s point ofview (Osipow & Fitzgerald, 1996). Consumer dissatisfaction isconsidered as the bipolar opposite of satisfaction; or consumersatisfaction and dissatisfaction may be viewed as two differentdimensions (Giese & Cote, 2000). Studies have emphasised that theconcept of satisfaction is associated with a number of factors like trust(Lim, Widdows, and Park, 2006; Kim, Kim, and Shin, 2009); justices(Pizzutti and Fernandes, 2010), perceived value (Ryu, Lee, and Kim,2012); service quality (Sureshchandar, Rajendran, and Anantharaman,2002), corporate image (Wu H.-C. , 2013); corporate social reasonability(Nilsson and Ballantyne, 2014) and customer loyalty (Martínez andBosque, 2013) etc. Researchers also explored the outcomes of customersatisfaction as outcome of positive word-of-mouth; repurchase intention,and purchasing behaviour (Omar, Nazri, Abu, and Omar, 2009; Dholakiaand Bagozzi, 2001; Seiders, Voss, Grewal, and Godfrey, 2005).In the e-learning context, perceived e-learner satisfaction can bedefined as “the degree of perceived learner satisfaction towards elearning environments as a whole” (Sun, Tsai, Finger, Chen, & Yeh,2008). Satisfaction in a blended/ hybrid learning environment has beendefined by Wu, Tennyson, and Hsia (2010) as “the sum of anindividual‟s behavioural beliefs and attitudes that results fromaggregating all the benefits that an individual receives from using theblended system” (p.157). Based on previous research, e-learnersatisfaction can be defined as a “summary affective response of varyingintensity that follows asynchronous e-learning activities, and isstimulated by several focal aspects, such as content, user interface,127
Abasyn Journal of Social Sciences – Volume: 9 – Issue: 1learning community, customization, and learning performance” (Wang,2003, p. 77).Technology QualityIn the present day environment, e-learning and technologyapplication are now synonymous to each other and it has been found thatthe use of new technology will invoke consumers‟/users‟ interest insearching and upgrading their knowledge, hence the management need tomaintain the technology to ensure the usefulness of e-learning (Yacob,Abdul Kadir, Zainudin, & Zurairahq, 2011). Similarly, system qualitycan be measured as system accessibility, flexibility of system,convenience of access, reliability and response time (Calisir, Gumussoy,Bayraktaroglu, & Karaali, 2014). Any problem in the system quality mayresult in the withdrawal of consumer. This withdrawal may affect theconsumer/user perceptions regarding ease of use and usefulness of thesystem perception of (Chang and Tung, 2008; Lee and Lee, 2008). Thequality of technology and reliability of technology are importantdeterminants of the effectiveness of learning (Piccoli, Ahmad, and&Ives, 2001; Hiltz S. R., 1995; Hiltz S. R., 1994). Wang and Xiao (2009)reported that services quality and system quality have a significantlypositive impact on perceived ease of use and perceived usefulness(Calisir, Gumussoy, Bayraktaroglu, & Karaali, 2014).The higher thequality of technology, the higher would be learning effects (Piccoli,Ahmad, & Ives, 2001; Webster & Hackley, 1997). Based on previousgrounding, it can be proposed that:H1:There is significant and positive impact of technology quality onconsumer‟s perceived ease of use.H2:There is significant and positive impact of technology quality onconsumer‟s perceived usefulness.Perceived ease of use & Perceived usefulnessPerceived ease-of-use (PEOU) is the degree to which a personbelieves that using a particular system would be free from effort (DavisF. D., 1989).Theory of reasoned action (TRA) argued that behaviors arecontrolled by cognitive factors which can be measured by predictingbehavioral intentions. Moreover, Technology acceptance model (TAM)postulates that individual‟s intention to use technology is determined byperceived ease of use and perceived usefulness (Davis F. D., 1989) andare considered as fundamental determinants of user acceptance (Adams ,Nelson , and Todd , 1992; Sun, Tsai, Finger, Chen, and Yeh, 2008;Arbaugh J. B., 2002). Davis, Bagozzi and Warshaw (1989) identifiedperceived usefulness as a most significant contributing factor ofbehavioral intentions. Perceived usefulness and ease of use have beenapplied consistently in marketing and IT areas to investigate newproducts or systems.128
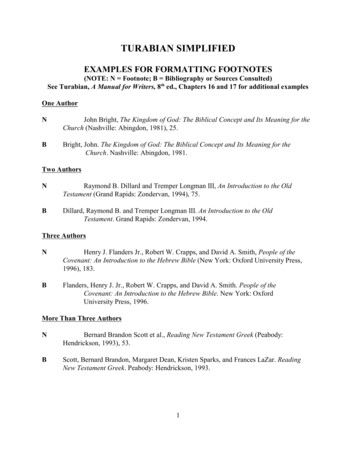
Abasyn Journal of Social Sciences – Volume: 9 – Issue: 1Particularly, improved consumer‟s perceived ease of use resultedin increased performance because it would generate a positive impact onperceived usefulness (Venkatesh & Davis, 2000). Prior marketingliterature validates a significantly positive relationship between ease ofuse and perceived usefulness in online context (Bigné-Alcaniz, RuizMafé, Aldàs-Manzano, and Sanz-Blaz, 2008; Wu H.-C. , 2013). Arbaugh(2000) and Chiu, Chang, Cheng and Fang (2009) documented asignificantly positive impact of perceived usefulness on satisfaction.Prior studies have also confirmed the positive relation between perceivedease of use and favourable attitude or satisfaction (Chang & Wang, 2008;Stoel & Lee, 2003), among individual‟s ease of use, perceive usefulnessand intentions in the context of e-learning (Arbaugh & Duray, 2002;Pituch & Lee, 2006). Specifically, a consumer is more likely to developsatisfaction and have favourable intentions toward online experiences ifit is perceived to be useful (Bhattacherjee, 2001). Consumers havefavourable feeling of satisfaction with online experiences when it isperceived to be useful and easy to use (Devaraj, Fan, & Kohli, 2003;Pavlou, 2003). Extent of research has verified that ease of use andusefulness has a significant impact on satisfaction of consumers (Lin,2008).H3:There is significant and positive impact of consumer‟s perceivedease of use on perceived usefulnessH4:There is significant and positive impact of consumer‟s perceivedease of use on his/her satisfactionH5:There is significant and positive impact of consumer‟s perceivedease of use on his/her satisfaction.Theoretical FrameworkPerceived Easeof sefulness129
Abasyn Journal of Social Sciences – Volume: 9 – Issue: 1Figure 1. Theoretical frameworkResearch MethodologyData Collection and MeasuresTo identify the institutions offering education through e-learning,hybrid/ blended learning or distance education, all the HEIs, Universitiesand Territory Educational institutions were contacted through email. Listof these institutions was drawn from the website of ult.aspx).Afterevaluation, it was determined that presently only 3 universities areoffering education through e-learning mode, namely; Allama Iqbal OpenUniversity (AIOU), Virtual University of Pakistan (VUP) and VirtualCampus of COMSAT (VCOMSAT). Accordingly, the students wereconsidered as sampling unit and these universities were considered aspopulation for the study.For data collection, questionnaires were floated online amongstudents of three universities i.e. VU, VCOMSAT, and VAIOU as theseuniversities have virtual education system for students. Sample size of1338 complete questionnaires were received and included in study.Technology quality is first construct for which Amorosos and Cheney(1991) scale is used. This scale has four items (e.g. I feel the informationtechnologies used in e-Learning are very easy to use).Table 1. Measurement lityTINEQUAmorosos&Cheney (1991)4Perceived ease ugh(2000)4CustomerSatisfactionTCSATOliver (1997)4MeasurementScale1 StronglyAgree,5 Strongly1 StronglyAgree,5 Strongly1 StronglyAgree,5 Strongly1 StronglyAgree,5 StronglyConsumer‟s perceived ease of use is second construct for whichArbaugh (2000) scale is used. This scale has four items (e.g. It would beeasy for me to become skillful at using web-based learning systems).Consumer‟s perceived usefulness is third construct and Arbaugh (2000)scale is used. This scale has four items (e.g. using web-based learningsystem would enhance my effectiveness in the program). Customersatisfaction is fourth construct and (Oliver, Rust, and Varki (1997) scale130
Abasyn Journal of Social Sciences – Volume: 9 – Issue: 1is used. This scale also has four items (e.g. I am satisfied the fact that thecontent provided in e-learning part of the course is up to date).Data Analysis and ResultDemographic StatisticsData was collected from 1338 respondents. Out of these 1338respondents, 500 were males and remaining 838 were females. Mode forgender was 2 with 0.48 standard deviation. Skewness and kurtosis were 0.53 and -1.73 for gender which represented normality of data.Respondents were also asked about their age groups. Most ofrespondents (434 respondents) were from 25 to 30 years age group.Mean age was 3.06 with 1.36 standard deviation. Skewness and kurtosiswere 1.07 and 1.34 for age which represented normality of data.Respondents were also inspected about their education level and moststudents have 16 year education. Mode for education was 3 with 0.93standard deviation. Skewness and kurtosis were -0.07 and -0.91 foreducation which represented normality of data (table 2).Most of thestudents were from VU (866 students). Mode for university was 1 with0.81 standard deviation. Skewness and kurtosis were 0.97 and 0.80 foruniversity which represented normality of data.Respondents were also inspected about study mode and most ofrespondents (695 students) were taking education at their homes. Meanfor study mode was 1.63 with 0.73 standard deviation. Skewness andkurtosis were 0.70 and -0.85 for study mode which represented normalityof data. Respondents were also asked about their degree/certificate whichthey earned. Most of respondents (495 students) have MBA/MSc/MAdegree. Mean for degree was 2.04 with 1.00 standard deviation.Skewness and kurtosis were 0.92 and 0.73 for degree/certificate whichrepresented normality of data.Correlation AnalysisTo find out relationship among study variables, correlationanalysis was used. Results represented that perceived usefulness hasstrong positive relation with technology quality as r 0.70. In the sameway, perceived ease of use has strong relationship with customersatisfaction as r 0.82. Mean values of study variables are from 2.11 to2.17 and standard deviation is from 0.70 to 0.72. to check normality ofdata, skewness and kurtosis test was executed as results lies between -2to 2 as per criteria (Table 3).Table 2. Correlation and Descriptive Analysis of constructs11.2.3.Technology QualityPerceived Ease of UsePerceived Usefulness21.73134M (S.D)2.13 (0.72)2.13 (0.70)2.11 (0.71)Skewness0.280.20Kurtosis0.160.01131
Abasyn Journal of Social Sciences – Volume: 9 – Issue: 14.Customer Satisfaction.70.70.82.821.772.17 (0.72)10.230.33-0.040.33**. Correlation is significant at the 0.01 level (2-tailed).Multicollinearity TestMulticollinearity is also checked for studied variables withcustomer satisfaction. Due to the value of r among all variables is around0.7, therefore, it is required to analyze this issue. Test results presentedno issue of multicollinearity as tolerance and variance inflation factor(VIF) values are above 0.10 and below 10 respectively as per criteria(O‟Brien, 2007).Table 3. Multicollinearity AnalysisCollinearity StatisticsVariablesTolerance1. Technology Quality0.442. Perceived Ease of use0.283. Perceived Usefulness0.301. Customer Satisfaction (Dependent variable)VIFactor2.283.613.35Structural Equation Modeling (SEM)Testing of Measurement ModelConfirmatory factor analysis is carried out for measurementmodel. Factor loading (FL) and squared multiple correlation (SMC)values measured to check reliability of items and observed errors. If FLvalue is less than 0.50 with SMC value is less than 0.20 of an item thenthis item is excluded (Hu & Bentler, 1999).First latent variable is technology quality and its items producedFL and SMC values among 0.75-0.90 and 0.57-0.81 respectively. Secondlatent variable is perceived ease of use and its items produced FL andSMC values among 0.83-0.89 and 0.68-0.79 respectively. Third latentvariable is perceived usefulness and its items produced FL and SMCvalues among 0.83-0.91 and 0.68-0.82 respectively. Fourth latentvariable is customer satisfaction and its items produced FL and SMCvalues among 0.76-0.92 and 0.58-0.84 respectively.At end, goodness fit indices also examined for measurementmodel that represented satisfactory results i.e. CMIN/DF 9.60; GFI 0.92; AGFI 0.88; CFI 0.96; RMSEA 0.08. Convergent validity alsotested for measurement model (Fornell & Larcker, 1981). Satisfactoryresults are found for convergent validity i.e. internal consistency rangedamong 0.80 and 0.93, composite reliability (CR) ranged among 0.80 and0.92 and average variance extracted (AVE) ranged among 0.71 and 0.76.R2 also tested and its values are explaining variability of responsesaround their means.Table 4. Convergent Validity Verification132
Abasyn Journal of Social Sciences – Volume: 9 – Issue: 1Latent VariablesR2SMCSt. FLAlphaCRAVE1.Technology Quality2.Perceived Ease of Use3.Perceived Usefulness4.Customer ng of Structural ModelStructural model contained four latent variables and sixteenobserved variables. Conceptual model contained one stimulus variablei.e. technology quality (TINEQU) which were stated as exogenousvariable, two organism variables i.e. perceived ease of use (TCPEO) andperceived usefulness (TCPUF), and one response variables i.e. customersatisfaction (TCSAT) which was stated as endogenous variables.Hypotheses TestingThe first hypothesis (H1) demonstrates significant relationshipexist technology quality and consumer perceived ease of use. Thusresults of H1 represented that standardized regression coefficient is 0.80with p 0.00 which presented significant positive relationship andaccepted this hypothesis. The results of hypothesis (H2) represented thatstandardized regression coefficient is 0.15 with p 0.00 which presentedsignificant positive relationship among technology quality and perceivedusefulness. The results of hypothesis (H3)represented that standardizedregression coefficient is 0.77 with p 0.00 which presented significantpositive relationship among perceived ease of use and perceivedusefulness. The result of hypothesis (H4)represented that standardizedregression coefficient is 0.75 with p 0.00 which presented significantpositive relationship among perceived ease of use and customersatisfaction. Similarly, the last hypothesis also demonstrates significantand positive relationship among perceived usefulness and customersatisfaction. Thus results of hypothesis (H5)represented that standardizedregression coefficient is 0.18 with p 0.00 which presented significantpositive relationship among perceived usefulness and customersatisfaction.For structural model, goodness of model fit indices were alsoexamined which showed satisfactory results i.e. CMIN/DF 9.77; GFI 0.91; AGFI 0.88; CFI 0.96; RMSEA 0.08.Table 5. Hypotheses SummaryHypothesesH1H2H3H4H5Structural PathsTINEQU TCPEOTINEQU TCPUFTCPEO TCPUFTCPEO TCSATTCPUF TCSATSt. Reg. weights0.800.150.770.750.18Sig.p 0.05p 0.05p 0.05P 0.05p irmedDiscussionIt was assumed that the technology of the quality would havesignificant and positive impact on the perceived ease of use and133
Abasyn Journal of Social Sciences – Volume: 9 – Issue: 1perceived usefulness of e-learning. Results of this study indicate that thetechnology quality is a powerful predictor of ease of use and perceivedusefulness of the e-learning. These results support the findings of theprevious studies (Chang & Tung, 2008; Lee & Lee, 2008; Wang & Xiao,2009) where it was concluded that consumers perceive a high quality elearning system to be useful with respect to their needs and they alsoconsider a high quality technology easy to use (Calisir, Gumussoy,Bayraktaroglu, & Karaali, 2014).Study results also indicate that e-learning systems that areconsidered easy to be used are the ones which actually provide utility. Acomplex system will not be able to deliver its core purposes as far as elearning is concerned. Study results compliment previous studies whereresearches argue that improved ease of use resulted in increasedperformance as well as it would generate a positive impact on perceivedusefulness (Venkatesh & Davis, 2000). Prior marketing literaturevalidates a significantly positive relationship between ease of use andperceived usefulness in online context (Bigné-Alcaniz, Ruiz-Mafé,Aldàs-Manzano, and Sanz-Blaz, 2008); Wu H.-C. , 2013).Study results indicate that perceived ease of use and perceivedusefulness have a significant impact on customer satisfaction. It can beinferred from the results that easy to use e-learning systems are of centralimportance in satisfying the customers. Findings support the long heldunderstanding that individual‟s intention to use technology is determinedby perceived ease of use and perceived usefulness (Davis,1989).Similarly the results also indicate that perceived ease of use has asignificant influence on customer satisfaction. The results imply that thecustomer would be satisfied if an e-learning system is useful. Consumershave favourable feeling of satisfaction with e-learning when it isperceived to be useful and easy to use (Devaraj, Fan and Kohli, 2002;Pavlou, 2003). When a customer is obtaining the required utility from asystem then he/she would be satisfied. Chiu et al. (2009) alsodocumented a significantly positive impact of perceived usefulness onsatisfaction. Overall the study results indicate that a high quality easy touse e-learning system is of prime importance in creating customersatisfaction. A useful and relevant e-learning system is also of equalimportance in satisfying the customers.Limitations and Future ResearchSeveral contributions in extent theory and practicenotwithstanding, like every other study, limitations are inherent to thisstudy as well. Foremost limitation of this study is the cross sectionaldesign. Cross sectional design does not permit us to observe and predictthe level of satisfaction consumer experience over time. A longitudinaldesign or experimental designs in particular are advised to be adopted forfuture research. Consumers of e-learning in educational sector inPakistan are in large numbers because there are only three institutes in134
Abasyn Journal of Social Sciences – Volume: 9 – Issue: 1Pakistan that are in this sector. Consumers from other sectors such as ITindustry may also be included in future researches. Convenient samplingis criticized every now and then by researcher over its ability togeneralize results. Probability sampling techniques are anotheropportunity for future researchers to achieve better generalizability. Alarger sample size is also advised for achieving a greater level ofunderstanding with e-learning in future.Consumers of otherbackgrounds such as government or private office workers, students etc.may also be included in future researchers. Other constructs from TAM,TAM 2 and UTAUT models can be incorporated in future researchesalong with other constructs that are used to better explain consumer‟ssatisfaction in e-learning context. Also future studies can be conducted toexplore the outcomes of e-learning satisfaction such as e-learningloyalty. Gender education interest in e-learning can be incorporated ascontrols to see the differences in level of satisfaction with respect todemographics. Other causal models may also be tested in futureendeavors to test mediating influences on satisfaction with e-learning.ReferencesAdams , D. A., Nelson , R. R., & Todd , P. A. (1992). Perceived Usefulness,Ease of Use, and Usage of Information Technology: A Replication .MIS Quarterly, Vol. 16, No. 2 , 227-247 .Aduwa-Ogiegbaen , S. E., & Iyamu , E. S. (2005). Using Information andCommunication Technology in Secondary Schools in Nigeria:Problems and Prospects. Educational Technology & Society, 8 (1), 104112.Ali, A. (2007). The soveriegn customer. Competitive Review , 17 (1/2).Ali, M., Ahmed, A., Shaikh, A. W., & Bukhari, A. H. (2011
determinants of the effectiveness of learning (Piccoli, Ahmad, and& Ives, 2001; Hiltz S. R., 1995; Hiltz S. R., 1994). Wang and Xiao (2009) reported that services quality and system quality have a significantly positive