Transcription
March 2022High-Yield and Bank Loan OutlookCredit Returns in theUpcoming Fed Hiking Cycle
Investment ProfessionalsTable of ContentsScott MinerdSummary. 1Chairman of Investments andGlobal Chief Investment OfficerKevin H. Gundersen, CFASenior Managing Director,Portfolio ManagerThomas J. HauserSenior Managing Director,Portfolio ManagerBrian SmedleyChief Economist,Head of Macroeconomicand Investment ResearchMaria M. Giraldo, CFAManaging Director,Investment ResearchHighlights from the Report. 1Leveraged Credit Scorecard. 2Macroeconomic Overview.3Leveraged Credit Returns During Tightening Cycles.4Investment Implications.8
SummaryWhile we expect the Federal Reserve (Fed) will begin an interest rate hiking cyclein March 2022, there may be little reason for concern for leveraged credit markets:History shows that credit tends to deliver positive returns in these periods.Corporate debt defaults remain very low and are likely to continue that way, whilemany issuers have experienced a rating upgrade. Rates rising modestly fromcurrent levels are likely to be well tolerated, but investors should set leveragedcredit return expectations accordingly following two years of strong performance.History can offer some guidance.It may surprise those who pulled 15 billion from high-yield bond mutualfunds to pour 33 billion into bank loan mutual funds last year that, in fact,corporates outperformed similarly rated bank loans in the two most recent Fedtightening cycles. Realized spread compression is a key reason for this relativeoutperformance. The recent backup in credit spreads has now added some upsideto corporate bond returns that evens the positive return potential between bankloans and high-yield corporates, but we continue to slightly favor bank loans givenan expected step up in coupons and virtually no duration exposure if Treasuryyields rise more than we expect.Highlights from the Report Given broadening price pressures in the economy, there is growing urgency forthe Fed to begin a rate hiking cycle in 2022 and shrink the size of their balancesheet. This report explores the performance of leverage credit in past tighteningepisodes and what we expect in this cycle. History shows that high-yield corporate bonds have outperformed loans inrecent tightening cycles due primarily to spread compression. While it seemedunlikely that this would be the case in this tightening cycle with spreads nearhistorical tights at the end of 2021, the recent spread widening in January 2022added upside return potential for corporate bonds. This evens the return profileeven with the corporate bond market’s duration exposure. Rating upgrades present an interesting value proposition in both sectorscorporates to capture spread tightening and improve the average quality of acredit portfolio. 2021 data show that the market does not always price in anexpected upgrade. We slightly favor bank loans primarily due to their low duration profile andwider discount margins that leave more room for spread compression.Guggenheim InvestmentsHigh-Yield and Bank Loan Outlook First Quarter 20221
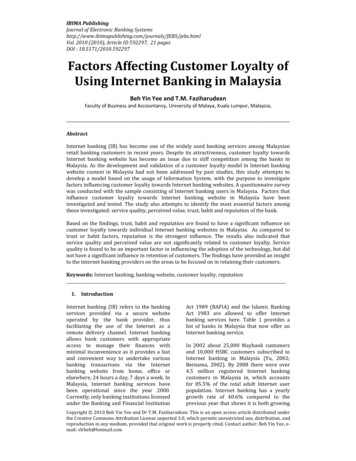
Leveraged Credit ScorecardAs of 12.31.2021High-Yield BondsDecember 2020October 2021November 2021December E BofA High-Yield 3%6667.5%7408.3%6907.8%Bank LoansDecember 2020October 2021November 2021December 2021DMM*PriceDMM*PriceDMM*PriceDMM*PriceCredit Suisse Leveraged Loan 9.15CCC/Split CCC1,16784.2892391.1097189.9394590.61Source: ICE BofA, Credit Suisse. *Discount Margin to Maturity assumes three-year average life. Past performance does not guarantee future results.ICE BofA High-Yield Index ReturnsQ3 2021Credit Suisse Leveraged Loan Index ReturnsQ4 2021Q3 20213%3%2%2%1%1.1%0.9%0.7%0.7%0.8%0.7%Q4 -0.2%-1%Index ReturnBBBCCCSource: ICE BofA. Data as of 12.31.2021. Past performance does not guarantee future results.Guggenheim InvestmentsIndex ReturnBBBCCC/Split CCCSource: Credit Suisse. Data as of 12.31.2021. Past performance does not guaranteefuture results.High-Yield and Bank Loan Outlook First Quarter 20222
Macroeconomic OverviewMarching into the Inflation BattlezoneThere is no reason tobelieve that inflationis embedded in theeconomy at this point,or we’re heading towarda bear market for bonds.Like wide lapels and avocado-green refrigerators, the word “inflation” is redolent– Scott Minerd,Chairman of Investments andGlobal Chief Investment Officerpandemic when production lockdowns in Asia caused disruptions in the globalof the 1970s. But while the tools likely to be used to combat surging prices arethe same as those of nearly a half-century ago—namely, tighter monetary policy—today’s price pressures have different origins. A good deal of recent price pressuresare likely to ultimately prove transitory, such as those caused by supply-chainissues, but this will now make little difference to the view that the next Fed hikingcycle will begin this year, 2022.The current inflationary wave springs from the early days of the COVIDsupply chain. With orders drying up, makers of essential components such assemiconductor chips ceased production. Meanwhile, just as the flow of goodsto Western markets was slowing, consumer demand for physical productsincreased as government-provided income-replacement programs went intoeffect, diverting spending from services such as travel and out-of-home diningthat became unavailable due to the pandemic.While pandemic shutdowns initially drove up unemployment, the easing ofrestrictions and reopening of the economy fueled labor demand faster thanworkers were willing to return, leaving employers scrambling. Nothing hasbeen more emblematic of the consequences of the situation than the conga-lineof cargo ships awaiting slots to unload at U.S. ports. Particularly on the WestCoast, port facilities are inundated with containers because there aren’t enoughtruckers to move the goods nor workers at warehouses to store them. Now,Russia’s invasion of Ukraine threatens to prolong these supply chain issues.Worker shortages have raised the cost of labor to the highest level since 2001,based on the year-over-year increase in the fourth quarter reading of the Bureauof Labor Statistics’ Employment Cost Index. Higher wages, as well as shortagesof building supplies and low mortgage rates, have pushed up the price of newand existing housing and spilled over into rental prices, major components of thecost of living. These forces, as well as higher commodity prices, have contributedto higher prices for consumers. By the Fed’s preferred measure of inflation—thepersonal consumption expenditures price deflator—core prices rose 4.9 percentin December on a year-over-year basis, the fastest rate since 1983.While we see signs that port congestion is easing and materials shortages areimproving, the broadening of price pressures to the services sector has forcedthe Fed to pivot away from its position that recent inflation is entirely transitory.At its December meeting, the central bank accelerated its schedule for taperingasset purchases, and effectively opened the door for rate hikes to begin as soonGuggenheim InvestmentsHigh-Yield and Bank Loan Outlook First Quarter 20223
as March 2022. In doing so, the Fed is aiming to keep inflation expectations frombecoming unanchored, especially in light of the Russia/Ukraine conflict thathas pushed commodity prices much higher. The pivot toward tighter policy mayalready be paying dividends, as the New York Fed’s January Survey of ConsumerExpectations showed a 50 basis-point decline in three-year ahead inflationexpectations, putting expected price growth at a level more consistent with theFed’s target of 2 percent.While the situation in Ukraine remains a wildcard, we now expect the Fed willhike by at least four times this year, with the risk of larger or more frequent hikesif the inflation data continues to run hot. A big topic of debate is the central bankbalance sheet, which we expect the Fed will begin shrinking by July of this year,if not sooner. The pace of runoff should be materially faster than in the last cyclegiven the relative size and the degree of economic overheating, which introducesan element of uncertainty around the expected impact of Fed tightening ongrowth and interest rates.While the monetary policy backdrop will shift meaningfully in 2022, somestrong tailwinds to growth remain. Consumption will benefit from the surge inhousehold net worth and accumulated consumer savings over 2.4 trillion inexcess of the pre-COVID pace of saving, helping to cushion the impact of fadingfiscal support. Growth should get a further boost from rising business investment,as inventories are replenished from very low levels and capital expendituresincrease amid a tight labor market. Although the compressed timeline ofaccommodative policy withdrawal presents uncertainties, the analysis in thisreport shows that the economic backdrop against which the Fed is tighteningpolicy typically favors risk assets.Leveraged Credit Returns During Tightening CyclesWith the Fed likely to hike rates in 2022 for the first time since 2018, a review ofthe performance of the leveraged credit market during previous tightening cycles,combined with an assessment of credit conditions today, are key elements ofthe sector outlook for the next 12 months. The available history of returns givesus the opportunity to examine performance over the last four hiking cycles.Each cycle has been different, but all inform our view on the factors that aregoing to influence returns while the Fed is tightening; namely the likely path forbenchmark rate changes, spread changes, and default activity.Guggenheim InvestmentsHigh-Yield and Bank Loan Outlook First Quarter 20224
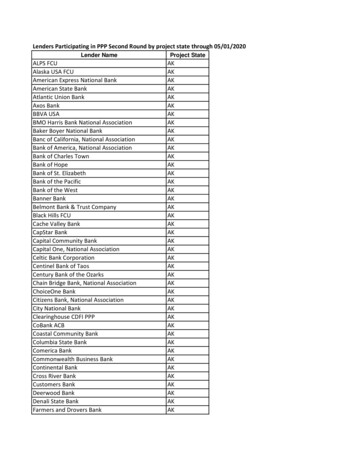
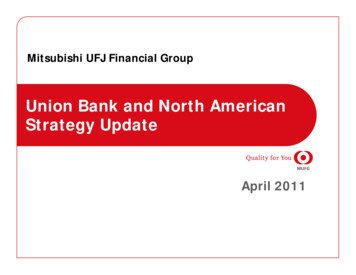
Each cycle has been different, butDuration Risk and Spread Compression Are Key Drivers as Rates Riseall inform our view on the factorsthat are going to influence returnswhile the Fed is tightening; namelythe likely path for benchmarkrate changes, spread changes anddefault activity.IncomeFactor1994 - 1995 Fed Tightening CycleHigh Yield CorporatesBank Loans1999 - 2000 Fed Tightening CycleHigh Yield CorporatesBank Loans2004 - 2007 Fed Tightening CycleHigh Yield CorporatesBank Loans2015 - 2019 Fed Hiking CycleHigh Yield CorporatesBank LoansNext Hiking Cycle, modeledHigh Yield CorporatesBank LoansApproximate Return Attribution, um 5.10%6.07%Source: Differences in each sector’s rating profile are not controlled for in this analysis. Table is for illustrative purposes to show howkey factors may have affected performance in previous tightening cycles. Duration factor for high-yield corporates is based on theproduct of the change in 5-year Treasury yields and the index modified duration. Spread factors are based on the product of thechange in credit spreads and the index spread duration. Credit losses are based on the average default rate during the tighteningcycle, net of a 45% recovery rate assumption for corporates and 70% recovery rate assumption for bank loans. Other factors notshown here include index turnover, refinancing activity, roll-down effect, and factors due to approximating index characteristics,which can also affect total returns.Beginning with the hiking cycle that lasted from 1994 through mid-1995, bankloans outperformed high yield corporates as duration exposure drasticallyweighed on the returns of the latter. BB-rated loans and B-rated loans deliveredannualized returns of 8.7 percent and 8.8 percent, compared to 4.9 percent andHigh-yield corporate bonds haveoutperformed similarly rated bankloans in the two most recent Fedtightening cycles. Realized spreadcompression is a key reason for thisrelative outperformance.Bonds Outperformed in the Last Hiking CycleAnnualized Total Return During Hiking CyclesBB Loans10%B LoansB Bonds9.0%8.7% 8.8%7.6%8%6%BB Bonds4.9% 4%-6%- 4.2%1994 - 1995 FedTightening Cycle1999 - 2000 FedTightening Cycle2004 - 2007 FedTightening Cycle2015 - 2019 FedHiking CycleSource: Guggenheim Investments, Credit Suisse, Bloomberg. Data as of 12.23.2021Guggenheim InvestmentsHigh-Yield and Bank Loan Outlook First Quarter 20225
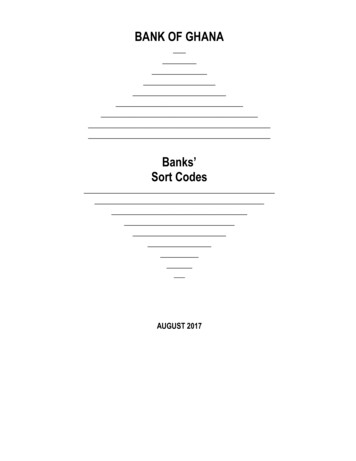
4.6 percent for BB-rated and B-rated corporates, respectively. The seven-yearTreasury yield rose by 137 basis points in this cycle, measured from two monthsbefore the first rate hike until two months before the first rate cut. However,strong corporate profit growth resulted in low default rates, and spreads remainednear 330 basis points. High-yield coupons of 11 percent offered some cushion forduration risk, leading to positive returns in corporates, but bank loans had thebenefit of spread tightening, rising coupons and no duration exposure.After several mid-cycle rate cuts that avoided a recession in the mid-1990s,the next hiking cycle began in 1999. This time the gap between loan and bondreturns was wider, with annualized returns of 7.6 percent in BB-rated loans and5.7 percent in B-rated loans, versus 2.6 percent for BB-rated bonds and a loss of4.2 percent for B-rated bonds. The big detractor to performance was actuallyspread widening, as this is the only cycle in the last four where the default rateincreased, causing spreads to widen by 132 basis points. The Fed’s rate hikesbrought about an 87 basis-point increase in seven-year Treasury yields whichalso weighed on corporate bond returns.A move to higher rates is notnecessarily a negative for riskassets and credit, based on history.Fed Tightening Cycle Usually Occurs in Benign Credit EnvironmentsRate Hiking CycleRate increases likely will tighten16%financial conditions, but they14%are tightening from extremelyeasy levels.U.S. High Yield Default RateFed Fund Target Rate12%10%8%6%4%2%0%1992199419961998 2000 2002 2004 2006 2008 201020122014201620182020Source: Guggenheim Investments, Moody’s Investor Services, S&P Global Ratings, Bloomberg. Data as of 11.30.2021The 1999–2000 hiking cycle took place during a vulnerable period just after theAsian Financial Crisis, a big collapse in oil prices, and already increasing corporatedefaults. Of the few hiking cycles we examine in this report, this cycle may be theleast comparable to today, with the key exception that Russia’s potential default onsovereign debt could reveal unknown financial market exposures much like theydid in 1998. Furthermore, China’s strict policies on real estate could lead to a globalgrowth slowdown. This could have similar consequences to the devaluation of theThai baht that had ripple effects from 1997 through 1999.Guggenheim InvestmentsHigh-Yield and Bank Loan Outlook First Quarter 20226
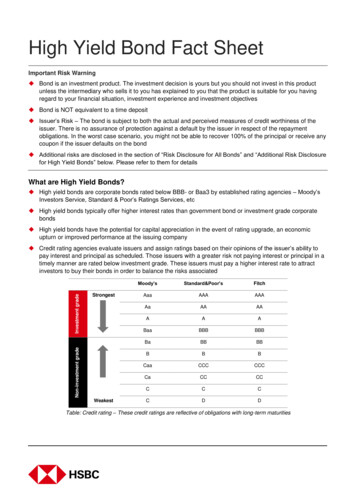
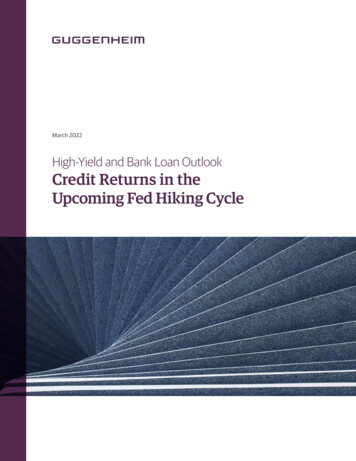
This brings us to the hiking cycles in which high-yield corporate bonds haveoutperformed loans on a total return basis, those beginning in 2004 and 2015.Corporate bond spreads tightened more than similarly-rated bank loans in theseperiods, which we estimate added an average of 180 basis points annualizedto corporate bond returns compared to an average of just 70 basis pointsannualized for bank loans. Bank loans price gains are effectively capped bygreater refinancing risk than corporates.Given the dichotomous view that history offers on the relative bond-vs-loanperformance during hiking cycles, it is challenging to pin down a high-convictionconclusion as the Fed gears up to tighten policy again. On the one hand,refinancing risk looms over the loan market, limiting return upside, which wouldargue in favor of fixed-rate corporates over loans. Furthermore, the recent wideningin credit spreads has added some cushion. High-yield corporate bond spreads of367 basis points are still 113 basis points tighter than where they were at the startof previous rate hikes, but if spreads tighten by 100 basis points between now andthe last rate hike, which history shows there is potential for, this could add4 percentage points in cumulative returns on top of current yields of 5.3 percent.High-yield corporate bond spreadsof 367 basis points are still 113 basispoints tighter than where theywere at the start of previous ratehikes, but if spreads tighten by 100basis points between now and thelast rate hike, which history showsBonds Spreads Are Tighter in This Hiking CycleSpreads at the Start of Past Hiking CyclesHigh Yield Corporate BondsBank Loans700 bps672632600 bpsthere is potential for, this could add4 percentage points in cumulative500 bps458426returns on top of current yields of5.3 percent.379400 bps328388367328324300 bps200 bps199419992004Hiking Cycle Starting Year20152022*Source: Guggenheim Investments, Bloomberg, Credit Suisse. *Based on spreads as of 2.17.2022.If defaults stay low and spreads remain tight, as we expect they will, the wildcardfor fixed-rate corporates will be duration risk, similar to the 1990s hiking cycleswhen it weighed on performance. How much interest rates are likely to risefrom here depends on a variety of factors, but our estimate is that rates will peakaround 2–2.25 percent. This implies about 30–55 basis point cumulative upsideGuggenheim InvestmentsHigh-Yield and Bank Loan Outlook First Quarter 20227
for the belly of the curve (five- and seven-year Treasury yields), resulting in1.5–2.5 percent cumulative negative contribution to total return. It wouldpartially offset the return boost from our assumed spread tightening path.Duration is a risk that the bank loan market does not face directly. The floatingrate coupon on bank loans should rise in tandem with the general movementof short-term interest rates and cushion their performance. That should resultin less volatility in bank loans. And there is room for price upside with theaverage bank loan currently trading at a price of 98 percent of par. With bankloan coupons starting off at 4.5 percent, rate hikes ahead, and a positive creditoutlook, the return prospects for loans look slightly more attractive.In both sectors, the environment provides opportunities for the credit savvy.One of those is riding the escalator of credit upgrades, which still presents spreadtightening opportunity. Over the last six months, 14 percent of the ICE BofA HighYield Index has seen at least one notch upgrade, versus only 5 percent that haveexperienced a credit rating downgrade. In loans, 7 percent of the S&P / LSTALeveraged Loan index has seen at least one notch upgrade versus only 4 percentexperiencing downgrades.Many bonds experienced multi-notch rating changes in 2021 alone, and ourreview of those bonds showed that their potential for a rating upgrade was notalways priced in. Based on a pool of B-rated bonds that were upgraded multipletimes in 2021, spreads tightened by 100 basis points more compared to bondsthat saw no rating change over the same period.Many bonds experienced multinotch rating changes in 2021Potential for Credit Rating Upgrades Give Room for Spread CompressionCumulative Spread Change for B-rated Bonds With vs. Without Rating Changesalone, and our review of thosebonds showed that their potentialfor a rating upgrade was notBonds Experiencing Multinotch UpgradesSingle B IndexBonds with No Rating Changes 100always priced in. 500-50-100-150March 2021 April 2021May 2021June 2021July 2021Aug. 2021Sept. 2021Oct. 2021Nov. 2021Source: Guggenheim Investments, ICE Index Services, Bloomberg. Data as of 12.23.2021. Based on a sample of 12 index-eligibleB-rated bonds that experienced muti-notch credit rating upgrades versus 12 index-eligible B-rated bonds that saw no rating changebetween Q1 2021 and Q4 2021.Guggenheim InvestmentsHigh-Yield and Bank Loan Outlook First Quarter 20228
Investment ImplicationsCredit investors need not fear a Fed tightening cycle, since rate hikes typicallyoccur when growth is strong and defaults are low. The one exception was thelate 1990s, but based on the Treasury yield curve signal, that cycle was far moreadvanced and vulnerable than the current environment. Even then, bank loansperformed well despite some spread widening.We believe leveraged credit continues to offer an attractive opportunity for fixedincome portfolios as the Fed is only about to begin withdrawing monetary policyaccommodation. Both sectors carry features that can support returns as the Fedis raising interest rates, namely spread compression in high-yield corporates andfloating coupons in bank loans.As we think about key features of the current environment to factor intoour forward-looking views, COVID variants and supply-chain problems stillcloud the macro outlook. But double-digit earnings growth in both high-yieldcorporates and bank loans, coupled with low borrowing costs, currently mitigatethe consequences of short-term growth setbacks on credit worthiness. Moreprolonged setbacks would likely keep the Fed from raising interest rates andtightening financial conditions too quickly.The tightening periods studied in our report include only those months inwhich rate hikes took place and the period in which the Fed was on hold justbefore cutting rates. Therefore, capturing the performance that typically occursin periods we have defined as “rate hiking cycles” will necessitate accuratelyforecasting when the tightening cycle is coming to an end. Proprietary indicatorsdeveloped by our Macroeconomic and Investment Research Group suggest weare likely a couple of years away from a downturn that would prompt the Fed tobegin a rate cutting cycle.Guggenheim InvestmentsHigh-Yield and Bank Loan Outlook First Quarter 20229
Important Notices and DisclosuresINDEX AND OTHER DEFINITIONSThe referenced indices are unmanaged and not available for direct investment. Index performance does not reflect transaction costs, fees or expenses.The Credit Suisse Leveraged Loan Index tracks the investable market of the U.S. dollar denominated leveraged loan market. It consists of issues rated “5B” or lower, meaning that thehighest rated issues included in this index are Moody’s/S&P ratings of Baa1/BB or Ba1/ BBB . All loans are funded term loans with a tenor of at least one year and are made by issuers domiciledin developed countries.The Intercontinental Exchange (ICE) Bank of America High-Yield Index is a commonly used benchmark index for high-yield corporate bonds.A basis point (bps) is a unit of measure used to describe the percentage change in the value or rate of an instrument. One basis point is equivalent to 0.01%.The three-year discount margin to maturity (dmm), also referred to as discount margin, is the yield-to-refunding of a loan facility less the current three-month Libor rate, assuming a threeyear average life for the loan.The London Interbank Offered Rate (Libor) is a benchmark rate that a select group of banks charge each other for unsecured short-term funding.Spread is the difference in yield to a Treasury bond of comparable maturity.EBITDA, which stands for earnings before interest, taxes, depreciation and amortization, is a commonly used proxy for the earning potential of a business.RISK CONSIDERATIONSFixed-income investments are subject to credit, liquidity, interest rate and, depending on the instrument, counter-party risk. These risks may be increased to the extent fixed-income investmentsare concentrated in any one issuer, industry, region or country. The market value of fixed-income investments generally will fluctuate with, among other things, the financial condition of theobligors on the underlying debt obligations or, with respect to synthetic securities, of the obligors on or issuers of the reference obligations, general economic conditions, the condition ofcertain financial markets, political events, developments or trends in any particular industry. Fixed-income investments are subject to the possibility that interest rates could rise, causing theirvalues to decline.Bank loans are generally below investment grade and may become nonperforming or impaired for a variety of reasons. Nonperforming or impaired loans may require substantial workoutnegotiations or restructuring that may entail, among other things, a substantial reduction in the interest rate and/or a substantial write down of the principal of the loan. In addition, certain bankloans are highly customized and, thus, may not be purchased or sold as easily as publicly-traded securities. Any secondary trading market also may be limited, and there can be no assurance thatan adequate degree of liquidity will be maintained. The transferability of certain bank loans may be restricted. Risks associated with bank loans include the fact that prepayments may generallyoccur at any time without premium or penalty. High-yield debt securities have greater credit and liquidity risk than investment grade obligations.High-yield debt securities are generally unsecured and may be subordinated to certain other obligations of the issuer thereof. The lower rating of high-yield debt securities and below investmentgrade loans reflects a greater possibility that adverse changes in the financial condition of an issuer or in general economic conditions, or both, may impair the ability of the issuer thereof tomake payments of principal or interest. Securities rated below investment grade are commonly referred to as “junk bonds.” Risks of high-yield debt securities may include (among others): (i)limited liquidity and secondary market support, (ii) substantial market place volatility resulting from changes in prevailing interest rates, (iii) the possibility that earnings of the high-yield debtsecurity issuer may be insufficient to meet its debt service, and (iv) the declining creditworthiness and potential for insolvency of the issuer of such high-yield debt securities during periods ofrising interest rates and/ or economic downturn. An economic downturn or an increase in interest rates could severely disrupt the market for high-yield debt securities and adversely affect thevalue of outstanding high-yield debt securities and the ability of the issuers thereof to repay principal and interest. Issuers of high-yield debt securities may be highly leveraged and may nothave available to them more traditional methods of financing.This article is distributed for informational or educational purposes only and should not be considered a recommendation of any particular security, strategy or investment product, or asinvesting advice of any kind. This article is not provided in a fiduciary capacity, may not be relied upon for or in connection with the making of investment decisions, and does not constitute asolicitation of an offer to buy or sell securities. The content contained herein is not intended to be and should not be construed as legal or tax advice and/or a legal opinion. Always consult afinancial, tax and/or legal professional regarding your specific situation.This article contains opinions of the author but not necessarily those of Guggenheim Partners or its subsidiaries. The author’s opinions are subject to change without notice. Forward lookingstatements, estimates, and certain information contained herein are based upon proprietary and non-proprietary research and other sources. Information contained herein has been obtainedfrom sources believed to be reliable, but are not assured as to accuracy. No part of this article may be reproduced in any form, or referred to in any other publication, without express writtenpermission of Guggenheim Partners, LLC. Past performance is not indicative of future results. There is neither representation nor warranty as to the current accuracy of, nor liability for, decisionsbased on such information.Applicable to United Kingdom investors: Where this material is distributed in the United Kingdom, it is done so by Guggenheim Investment Advisers (Europe) Ltd., a U.K. Companyauthorized and regulated by the Financial Conduct Authority (FRN 499798) and is directed only at persons who are professional clients or eligible counterparties for the purposes of the FCA’sConduct of Business Sourcebook.Applicable to European Investors: Where this material is distributed to existing investors and pre 1 January 2021 prospect relationships based in mainland Europe, it is done so by GuggenheimInvestment Advisers (Europe) Ltd., a U.K. Company authorized and regulated by the Financial Conduct Authority (FRN 499798) and is directed only at persons who are professional clients oreligible counterparties for the purposes of the FCA’s Conduct of Business Sourcebook.Applicable to Middle East investors: Contents of this report prepared by Guggenheim Partners Investment Management, LLC, a registered entity in their respective jurisdiction, and affiliateof Guggenheim Partners Middle East Limited, the Authorized Firm regulated by the Dubai Financial Services Authority. This report is intended for qualified investor use only as defined in theDFSA Conduct of Business Module.1. Guggenheim Investments assets under management are as of 12.31.2021 and include leverage of 20.7bn. Guggenheim Investments represents the following affiliated investmentmanagement businesses: Gugg
Bank Loans December 2020 October 2021 November 2021 December 2021 DMM* Price DMM* Price DMM* Price DMM* Price Credit Suisse Leveraged Loan Index 486 95.73 440 98.53 451 98.06 439 98.39 BB 305 98.88 303 99.50 317 99.09 307 99.42 B 469 98.55 444 99.34 457 98.86 444 99.15 High-Yield Bonds December 2020 October 2021 November 2021 December 2021