Transcription
Mitsubishi UFJ Financial GroupUnion Bank and North AmericanStrategy UpdateApril 2011
This document contains forward-looking statements in regard to forecasts, targets andplans of Mitsubishi UFJ Financial Group, Inc. (“MUFG”) and its group companies(collectively, “the group”). These forward-looking statements are based on informationcurrently available to the group and are stated here on the basis of the outlook at thetime that this document was produced. In addition, in producing these statementscertain assumptions (premises) have been utilized. These statements and assumptions(premises) are subjective and may prove to be incorrect and may not be realized in thefuture. Underlying such circumstances are a large number of risks and uncertainties thatcould cause actual results to differ materially. Please see other disclosure and publicfilings made or that will be made by MUFG and the other companies comprising thegroup, including the latest kessantanshin, financial reports, Japanese and U.S. securitiesreports and annual reports and filings, for additional information regarding such risksand uncertainties. The group has no obligation or intent to update any forward-lookingstatements contained in this document.In addition, information on companies and other entities outside the group that isrecorded in this document has been obtained from publicly available information andother sources. The accuracy and appropriateness of that information has not beenverified by the group and cannot be guaranteed. The Peer Group is comprised of the following 19 banks Bank of America Corp, JP Morgan Chase, Citigroup, Wells Fargo Co., U.S. BanCorp, PNC Financial Services Group, Inc.,SunTrust Banks, Inc., BB&T Corp, Regions Financial Corp, Fifth Third Bancorp, KeyCorp, M&T Bank Corp, Comerica, Inc.,Huntington Bancshares Inc., Marshall & Ilsley Corp, Zions Bancorporation, First Horizon National Corp, AssociatedBanc-Corp, City National Corporation1
ContentsCurrentCurrent StateState ofof UnionUnion BankBankz Overview of Union Bank(1) Company profile and history5(9) Capital position21(2) Footprint6(10) FDIC assisted transactions22(3) Ranking in the U.S.7z Business environment for FY201124(4) Corporate governance8(5) Management team9(6) Business characteristics(7) Strategy1011z Financial results for FY2010(1) Income statement summaryNorthNorth AmericanAmerican StrategyStrategyz Weight of North America business26within BTMU13(2) Outline of results by business segment 14z Overview of Headquarters forthe Americas, BTMU2728(3) Balance sheet summary15(4) Loans16z North American ManagementCommittee(5) Credit quality17z NAMCO initiatives29(6) Deposits18z Alliance with Morgan Stanley30(7) Net interest margin19z Non-organic growth31(8) Liquidity202
Current State of Union BankNorth American Strategy3
z Overview of Union Bankz Financial results for FY2010zBusiness environment for FY20114
Company profile and historyzOne of the largest regional banks headquartered inCalifornia, with approximately 150 years of historyUB Company ProfileHead officeBranchesHistorySan Francisco400(mainly in California)1864: The Bank of California established as the first commercialbank in the west coast of the USA1883: First National Bank of San Diego (later changed its name toSouthern California First National Bank) established1914: Kaspare Cohn Commercial and Savings Bank (later changedname to Union Bank) establishedEmployees10,686Total assets 79 billion / 6.5 trillion1975: Bank of Tokyo California acquired Southern California FirstNational Bank to form California First BankTotal loans 48 billion / 3.9 trillion1984: The Mitsubishi Bank acquired The Bank of California 60 billion / 4.9 trillion1988: California First Bank acquired Union Bank (Union Bank nameretained)Total depositsNet businessprofits 985 million / 80.8 billionNet Income 573 million / 47.0 billion*Figures are for FY2010 or as of the end of 2010,converted at 82 yen to a dollar1996: As a result of the merger of The Mitsubishi Bank and TheBank of Tokyo, The Bank of California and Union Bankmerged to form Union Bank of California2008: Became a wholly owned subsidiary of BTMU and Bank namewas changed to Union Bank5
Footprintz400 branches, mainly in California, provide a solid foundationzGood coverage in many desirable west coast markets, including SanDiego, Los Angeles, San Francisco, and SeattleNote: UB owns corporate banking offices in Texas, New York and Illinois6
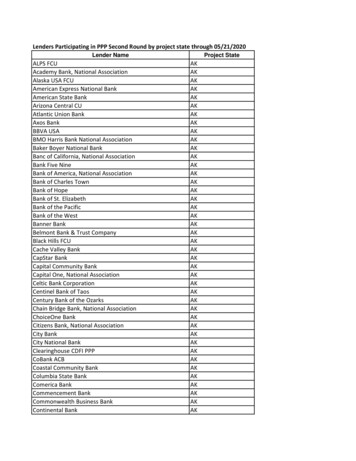
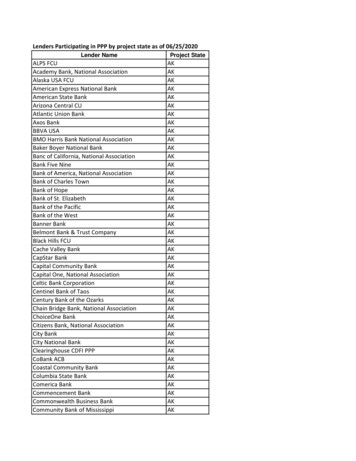
Ranking in the U.S.z Ranked 18th in the U.S. and 3rd in California in terms of total depositsas of June 2010 (most recent data available)Ranking in the U.S.Bank nameRanking in CaliforniaTotal deposits( bn)Bank nameTotal deposits( bn)1Bank of America8291Bank of America2222Wells Fargo Bank7192Wells Fargo Bank1633JPMorgan Chase Bank6333Union Bank614Citibank2554JPMorgan Chase Bank615PNC Bank1775Citibank486U.S. Bank1696U.S. Bank31・7Bank of the West23968City National Bank17・9East West Bank136410Comerica Bank13・10・Regions Bank・18 Union Bank・7
Corporate governancez UnionBanCal’s Board of Directors has 15 members, 11 of which are independentz Established 4 committees under the Board, all chaired by independent directorsz Committed to good disclosure, including voluntarily issuing quarterly earningsreleases and filing quarterly and annual financial statements with the SECShareholderShareholderMUFGMUFG100%BoardBoard ofof alCorporationCorporation(Holding(Holding company)company)100%OtherOther subsidiariessubsidiaries(Leasing,(Leasing, etc.)etc.)RiskRisk CommitteeCommitteeUnionUnion Bank,Bank, N.A.N.A.(Bank(Bank subsidiary)subsidiary)ExecutiveExecutive CompensationCompensation&& BenefitsBenefits CommitteeCommitteeOtherOther subsidiariessubsidiaries(Securities,(Securities, etc.)etc.)NominatingNominating &&GovernanceGovernance CommitteeCommitteeDirectorsIndependent Directors Nobuo Kuroyanagi (Chairman ofBTMU)(*) Tatsuo Tanaka (Chairman,Deputy president of BTMU) Masaaki Tanaka (Managingexecutive officer, BTMU) Masashi Oka (President & CEO) Aida Alvarez (former Administrator, Small BusinessAdministration) David Andrews (retired SVP, Governmental Affairs,General Counsel & Secretary, PepsiCo, Inc.) Nicholas Binkley (Partner, Forest Binkley & Brown) Dale Crandall (President, Piedmont CorporateAdvisors, Inc.) Murray Dashe (retired Chairman, CEO & President,Cost Plus, Inc.) Mohan Gyani (Vice Chairman, Roamware, Inc.)(*) Director of Union Bank onlyAuditAudit && FinanceFinanceCommitteeCommittee Christine Garvey (former global head of Corporate RealEstate & Services, Deutsche Bank AG) Takeo Hoshi (Professor, University of California, SanDiego) Fernando Niebla (President, International TechnologyPartners, LLC) Barbara Rambo (CEO, Taconic Management Services) Dean Yoost (retired Partner, PriceWaterhouseCoopers)8
Management teamzA U.S.-based management team of mostly American executiveszExecutive Committee members:PresidentPresident&&CEOCEOM.OkaM. sViceViceChairmanChairman&&ChiefRiskChief nkingBankingR.Dawson,SEVPR. Dawson, VPHumanHumanResourcesResourcesP.Fearer,P. ingJ.J.Wied,Wied,SEVPSEVP9
Business characteristicszPortfolio is well balanced between corporate and retail segmentsRevenue breakdown (FY10)【By segment】Other5%Retail40%Corporate55%【By account type】Trading, etc.11%Fees &commissions16%Net interestincome 73%Business characteristics¾Corporate banking segment:¾ Serves middle market and corporatebusinesses headquartered throughout theU.S., with particular strength in Californiasmall & mid-sized companies¾ Commercial real estate¾ Examples of specialized corporateindustries nationwide: Highly competitive power & utilitiesplayer in the North America, MUFGranked No. 1 in North Americaproject finance Corporate Cash ManagementServices¾ Wealth management services¾Retail banking segment:¾ Serves approximately 1 million households¾ High-touch, high-quality customer service¾ High-quality residential mortgage portfolio10
StrategyStrategic GoalszUnion Bank’s strategic goal is to be a high profitability relationship bank,with national nicheszFY2011 Strategic focus is franchise optimization:Optimize Revenue:Optimize Expense:M&A driven growth:Improved focus & execution inregional relationship banking andnational niche businessesTransform processes &infrastructure, with “funding”from productivity initiativesAdditional revenue growth throughbank & non-bank M&A to improvegeographic penetration &diversificationCorporate Banking¾ Infill within Existing Core Geographies- Expand presence in Pacific North West- Leverage existing presence in Texas¾ Wealth Management Expansion- Leverage existing commercial relationships- Align product offerings and balance revenue mix¾ Niche and Product Expansion- Expansion in existing niche business lines as wellas development of new niche business linesRetail Banking¾ Jumbo Lending Business- Profitable, market share leader, high credit quality- Continue to grow jumbo California residential mortgages¾ Consumer credit offerings- Expand product set, business line, and geographies¾ Business Banking- Restructure the group for growth and scale¾ Distribution Channels- Investing in alternative channels (online, mobile, ATM)11
z Overview of Union Bankz Financial results for FY2010zBusiness environment for FY201112
Income statement summary Consolidated Income Statement z Pre-tax, pre-provision income Net interest income increased primarily due to:- Balance sheet optimization and securities portfoliore-balancing strategy adopted in FY2010 Noninterest income increased primarily due to:- Higher gains from securities sales in FY2010 (related tosecurities portfolio re-balancing)- Higher Capital Markets and Commercial Banking feeincome- Partially offset by declining deposit fees from lowerrates & regulatory pressures, an industry-wide challengeFY20092,9873,3573702Net interest income2,2602,4341743Noninterest income727923196291250(41)135133(2)5Service charges on depositsaccountsTrust and investmentmanagement fees6Merchant banking fees6583187Brokerage commissions andfees344068Card processing fees, net324199Trading account activities7411137Securities gains, 8586(1,114)(182)932(215)8031,018(65)573638410 Pre-tax pre-provision income up 10% over FY200911 Noninterest expense Significant reduction (84%) in provision due toimprovement in credit environment, resulting inimproved credit quality throughout the portfolioz Net income Strong return to profitability in FY2010 with net incomeof 573 mnChange1 Total revenue Operating expenses increased primarily due to:- Higher FTE from acquisitions- Significant one-time charges in the 4th quarter due tocertain reserves for contingencies and an assetimpairment chargez Provision for loan lossesFY2010( mn)12Salaries and employee benefits13Other than above14 Pre-tax, pre-provision income15Provision for loan lossesIncome (loss) before income16 taxes and includingnoncontrolling interests17 Net income (loss)13
Outline of results by business segmentzTotal revenue increased for corporate and retail segments from FY2009 to FY2010:¾ Corporate revenue growth driven primarily by increased fee income and higher net interest income on deposits¾ Retail revenue growth driven primarily by growth in average deposit and loan balances and an expansion in themargin on assets, slightly offset by a reduction in fee income driven by regulatory changesBreakdownBreakdown ofof changeschangesinin totaltotal revenuerevenueTotalTotal revenuerevenue byby segmentsegment( mn)( 1014
Balance sheet summary Consolidated Balance Sheet zLoans Increased due to acquisitions and a returnto loan growth across most loan categoriesin FY10H2zSecurities Declined due to balance sheet optimizationand securities portfolio re-balancingstrategyzDeposits Deposit optimization strategy reducedhigher-rate deposit accounts volumes,supporting net interest margin expansionzNon-performing assets NPA levels improved as economystrengthened and asset quality improvedacross the board*1 NPA ratio at low level of 1.15%, veryfavorable compared with peers( mn)End Dec. 09 End Dec. 10Change1 Total lable for sale5Held to maturity6 Total liabilities7 Deposits8Noninterest bearing14,55916,3431,7849Interest FY103.24%(0.16%)1,3501,142(208)1.58%1.15%(0.43%)10 Total equity11 Net interest margin12 Nonperforming assetsNonperforming assets13to total assets*1*1 Excluding FDIC covered assets15
Loansz Strong 5-year loan growth reflects franchise strength and balancez Challenging economic environment in FY2010 made growth difficult, but UB held theportfolio nearly steady with acquisitionsz UB has a well-balanced loan portfolio with a relatively low concentration in CREAverage loans55Annually ( bn)*1Loan portfolio*1 QuarterlyAssets of the 2 banksacquired through FDICassisted transactions 8.4%Lease financing1.4%Commercial,financial andindustrial31.7%4539.4403535.7CAGR ercialreal estate17.4%20FY 06FY 07FY 08FY 09FY 10FY 10Q1 FY 10Q2 FY 10Q3 FY 10Q4*1 Average loans for FY10, excluding FDIC covered assets16
Credit qualityz NPL ratio consistently lower than peers, due to differentiated business model, loan mix, and long-termcommitment to conservative credit managementz UB manages risk through portfolio diversification, industry concentration limits, loan limits, geographicdistribution, and type of borrowerz No subprime or option ARM residential mortgages loansz Low residential mortgage delinquency rate due to focus on prime loans, high FICO scores, and low LTVsNetNet Charge-offs/averageCharge-offs/average loansloansNPL/totalNPL/total loansloans6.0%3.0%(at period-end)(year-to-date)UBPeer average2.80%UBPeer %0.0%FY08Source: SNL and company 0.79%FY09FY10FY060.03%FY07FY08Source: SNL and company reportsFY09FY1017
Depositsz UB benefited from depositor flight-to-quality beginning in FY2008z Lack of quality, risk-appropriate opportunities to invest the large pool of deposits led to thebalance sheet optimization project in FY2010z Balance sheet optimization targeted right-sizing the balance sheet through runoff of higher-ratedeposits and remixing the securities portfolio to enable NIM expansionAverage deposits( bn)Annually 807065.6 Quarterly67.868.164.861.76056.65042.243.140 40.03020FY06FY07FY08FY09FY10FY10Q1 FY10Q2 FY10Q3 FY10Q418
Net interest marginz Annual net interest margin results on declining trend as fall in funding costs due tolower rates is largely complete, while decline in yield on earning assets continuesz Returned to NIM expansion in FY10Q2 as balance sheet optimization projectsucceededNet interest margin7%6%Annually Quarterly5.45%Yield on total earning assetsNet interest margin5%Rate on total interest bearing 3.36%3.53%2% Y10Q4Source: 2010 10-K, Quarterly Earnings ReleasesYield on total earning assets Interest Income/ Total earning assets Net interest margin (Interest Income-Interest expense)/Total earning assetsRate on total interest bearing liabilities Interest Expense/ Total interest bearing liabilities19
Liquidityz UB maintains a robust liquidity profile anchored by a strong deposit basewith diverse wholesale funding capacityz Portfolio of high-quality securities, mainly U.S. government bonds andAgency RMBS, can be readily converted to cash or serve as collateralSecurities available for saleDepositsDeposits && WholesaleWholesale FundingFundingNegotiableCDs 2.6FHLB 3.0CommercialPaper 0.7( mn)Fed FundsPurchased 0.4Medium-andLong-termDebt 2.6AmortizedcostTotalU.S. Treasury and otherU.S. governmentDeposits 57.4RMBS-agencyRMBS-non agencyState and municipal 66.7 billionAt December 31, 2010ABS and debt securitiesEquity securitiesFair ValueGrossUnrealizedGains (28)6822512636943734004020
Capital positionz Tier 1 common and TCE ratios compared very favorably with peers at December 31, 2010z At December 31, 2010: BIS Tier 1 ratio 12.44%, total capital ratio 15.01%z No government funds in capital structurez Sizable capital cushion, available to support organic growth and acquisitionsSelect Capital RatiosComparisonComparison ofof CapitalCapital RatiosRatios withwith PeersPeers( mn)End Dec.09End Dec.10Change1 Total capital ratio14.54%15.01%0.47%2Tier 1 ratio11.82%12.44%0.62%3Tangible commonequity ratio8.29%9.67%1.38%As of end Dec. 1016%12%12.42%9.08%8%4%4 Tier 1 capital7,4858,0295445 Tier 2 capital1,7181,656(63)6 Total capital9,2039,6854820%Tier 1 commonTangiblecapital ratio common 2%63,29864,5161,218Peers AverageSource: Company disclosures21
FDIC assisted transactionsz Completed integration of Tamalpais bank in January 2011z On track to complete integration of Frontier bank in April 2011TamalpaisTamalpais BankBank Assets and deposits acquired・Assets: approx. US 0.6 bn(including loans of approx. US 0.5 bn)・Deposits: approx. US 0.4 bn Network・7 branches in Marin County, California Strategic implication・Expand branch network and customer base in MarinCounty, home to many high-income individuals・More efficient than de novo expansionFrontierFrontier BankBank Assets and deposits acquired・Assets: approx. US 3.2 bn(including loans of approx. US 2.8 bn)・Deposits: approx. US 2.5 bn Network・47 branches in Washington State, 3 branches and1 loan production office in Oregon Strategic implication・Washington State is a growing market, highly rankedby market size and population growth among all 50U.S. states・Achieved strong coverage in Seattle, creatingstronger footprint on west coast22
z Overview of Union Bankz Financial results for FY2010zBusiness environment for FY201123
Business environment for FY2011zEconomic environment9 Economy/Interest rates Clear signs of improvement but FRB cautious about earlytermination of monetary easing Fed Funds rate expected to remain near zero in FY2011z Regulatory environment9 Dodd Frank Durbin amendment, Volcker rule, Regulation Q repeal, enhancedrisk management9 Regulation E Prohibit charging overdraft fees unless customers expressly opt-in9 Basel III Need to address liquidity regulations (LCR ratio)24
Current state of Union BankNorth American Strategy25
Weight of North America business within BTMUzNorth America gross profits approx. 60% of BTMU’s overseas totalzNorth America accounts for one third of global revenue poolGrossGross profitsprofits breakdownbreakdown (FY09)(FY09)BTMUconsolidatedOverseasbusiness(Yen 3,605.1 bn) (Yen 2,373.3 bn)(Yen 564.6 bn)MUFGtotalGlobalGlobal revenuerevenue poolpoolOther Asia9%China9%NorthAmerica33% Europe17% 17% AsiaLatinAmericaNorthAmerica14%BTMU66%49% 49%Overseasbusiness24%UNBC45%Japan9%Middle Eastand Africa3%North Americaapprox. 60%of totalEurope30%Source: Boston consulting groupLatinAmerica7%26
Overview of Headquarters for the Americas, BTMUBusiness linesBusiness,Business, customerscustomers andand managementmanagementBusiness:Commercial banking in the AmericasCorporate Banking Division ・・・ Promote Japanese & Asian corporate business(current NY branch)for the Americas No.1Customers:Japanese and non-JapaneseCorporate Banking Division ・・・ Promote Japanese & Asian corporate business(current Chicago branch)for the Americas No.2Management: Masaaki Tanaka, CEO for the AmericasY. Nishio, Head of Asian Corporate BankingR. Chafetz, Head of Corporate and InvestmentBanking for the AmericasC. Trunz, Chief Risk Officer for the AmericasCorporate Banking Division ・・・ Promote Japanese & Asian corporate businessfor the Americas No.3(current LA and SF branch)Corporate Banking Division ・・・ Promote business with blue-chip Non-Japanesefor the Americas No.4companies mainly included in Fortune 500Investment BankingDivision for the Americas・・・Promote syndicated loans, asset finance andstructured finance in the AmericasGlobal Markets Division for ・・・ Promote market business including foreign currencytreasury & exchangethe AmericasOverseas branches・・・ Promote Japanese & Non-Japanese corporate businessNetworkGrossGross revenuerevenue inin thethe Americas,Americas, BTMUBTMUNorth America( bn)100South AmericaVancouverSeattle80San Francisco60Los AngelesMontrealTorontoBostonNew sBogotaAtlantaHoustonLima40Mexico City20Rio de JaneiroSao PauloCaymanSantiagoBuenos Aires0FY07LoansFY08DepositsFY09Fees & commissionsFY10 H1ForexCIB27
North American Management CommitteeName:North American ManagementCommittee (NAMCO)Established: August 2009Role:Creation of integrated businessstrategies and pursuit of groupsynergies among all U.S. unitsMembers: Tatsuo Tanaka, Chief Executive, Global Business Unit, BTMU (Chairman)Masaaki Tanaka, CEO for the Americas, BTMUMasashi Oka, President and CEO, Union BankD. Andrews, Lead Director, UnionBanCal & UB BoardP. Kelly, President, Knox & Co.B. Rambo, Strategy Designated Director, UnionBanCal & UB BoardE. Ludwig, Founder and CEO, Promontory Financial Group28
NAMCO initiatives Integrated North America strategy Shared aspiration of becoming a top 10 US bank Strengthen non-organic growth Strengthen overlapping businesses Introduce a unified model in Power & Utility business and becomeNo. 1 in North America Start to incorporate P&U model in other overlapping business areas Enhance Cross Sell Deposits and Cash Management Services, Investment banking products Promote cooperation of administration functions Harmonize processes in risk management and financial control Strengthen staff exchange program29
Alliance with Morgan StanleyAlliance with Morgan Stanley in the Americas Collaboration between BTMU and Morgan Stanley BTMU and Morgan Stanley collaborate through Morgan Stanley MUFG LoanPartners, LLC, a joint marketing company, to leverage the expertise of MUFG andMorgan Stanley in corporate finance and securities underwriting to provide firstclass financial services to corporate customers in the Americas.-An example of a successful deal・Large acquisition by a Chemical fertilizer producer (April 2010)Acted as Joint Lead Arrangers and fully underwrote a 4.05 bn syndicated loanfacility for this large acquisition finance. Collaboration between UB and Morgan Stanley UB and Morgan Stanley promote collaborative business through corporate andpersonal trust businesses and asset management (sales of UB investmentproducts through Morgan Staley’s distribution channels).-An example of a successful progress・Started sales of Union Bank’s Market Linked CDs and trust products to MorganStanley customers.30
Non-organic growthz In order to become a top 10 U.S. bank, actively pursuequality acquisition opportunities that meet key strategic andfinancial criteria(Examples of investment criteria) Strategic fit Expand geographic reach Improve market share in existing markets Diversify revenue and profit streams Scale benefits Business model fit Cost synergies Revenue synergies Investment return31
No.1ServiceNo.1No.1Reliability GlobalCoverage32
3 JPMorgan Chase Bank 633 4 Citibank 255 5 PNC Bank 177 k n a B . S .6U 9 6 1 ・・ ・ 10 Regions Bank 96 ・・ ・ 18 Union Bank 64 Bank name Total deposits ( bn) 1 Bank of America 222 k n a B o g r a F s l 3l 62We 1 3 Union Bank 61 4 JPMorgan Chase Bank 61 5 Citibank 48 k n a B . S .6U 1 3 7 Bank of the West 23 8 City National Bank 17 k .