Transcription
Network Sensitivity to Hot-Potato DisruptionsRenata TeixeiraAman ShaikhTim GriffinGeoffrey M. VoelkerUC San Diego AT&T Labs–Research Intel ResearchUC San DiegoLa Jolla, CAFlorham Park, NJCambridge, UKLa Jolla, RACTHot-potato routing is a mechanism employed when there are multiple (equally good) interdomain routes available for a given destination. In this scenario, the Border Gateway Protocol (BGP) selectsthe interdomain route associated with the closest egress point basedupon intradomain path costs. Consequently, intradomain routingchanges can impact interdomain routing and cause abrupt swings ofexternal routes, which we call hot-potato disruptions. Recent workhas shown that hot-potato disruptions can have a substantial impacton large ISP backbones and thereby jeopardize the network robustness. As a result, there is a need for guidelines and tools to assist inthe design of networks that minimize hot-potato disruptions. However, developing these tools is challenging due to the complex andsubtle nature of the interactions between exterior and interior routing. In this paper, we address these challenges using an analyticmodel of hot-potato routing that incorporates metrics to evaluatenetwork sensitivity to hot-potato disruptions. We then present amethodology for computing these metrics using measurements ofreal ISP networks. We demonstrate the utility of our model by analyzing the sensitivity of a large AS in a tier 1 ISP network.Categories and Subject DescriptorsC.2.2 [Network Protocols]: Routing Protocols; C.2.3 [ComputerCommunication Networks]: Network OperationsGeneral TermsDesign, Reliability, Management, PerformanceKeywordsNetwork robustness, sensitivity analysis, hot-potato routing, BGP,IGP, OSPF1.INTRODUCTIONInternet Service Providers (ISPs) seek to build robust networksso that small perturbations in the environment or internal conditions do not significantly impact network performance. However,Permission to make digital or hard copies of all or part of this work forpersonal or classroom use is granted without fee provided that copies arenot made or distributed for profit or commercial advantage and that copiesbear this notice and the full citation on the first page. To copy otherwise, torepublish, to post on servers or to redistribute to lists, requires prior specificpermission and/or a fee.SIGCOMM’04, Aug. 30–Sept. 3, 2004, Portland, Oregon, USA.Copyright 2004 ACM 1-58113-862-8/04/0008 . 5.00.tim.griffin@intel.comvoelker@cs.ucsd.eduin practice robustness is not so easily achieved. In fact, robustnessis not even an easy thing to measure. A network can seem to berunning smoothly only to crash unexpectedly after some seemingly“small” event.A robust network should have low sensitivity to routing behavior and traffic load variations. To understand the robustness of anIP network, it is important to understand the robustness of both thecontrol and data planes. For example, a small routing change inside a network may have significant impact in the control plane bycausing an extremely large number of routing messages — whichin turn may overload and crash routers, even though the routes initially in play were carrying no traffic. On the other hand, smallrouting shifts of popular routes can impact the data plane by causing a large swing in traffic, perhaps leading to congestion, losses,delay, and jitter.Even though understanding a network’s sensitivity to a change isa crucial step in designing of a robust network, current traffic engineering techniques and tools for network design and managementhave limited capability to analyze this sensitivity. In fact, there iseven little terminology to describe and measure network sensitivity. In this paper, we address this problem by defining metrics forcharacterizing network sensitivity to routing changes inside an autonomous system’s (AS) network.Routing in an AS is performed by the interplay of interdomainrouting, which in the Internet today is BGP [1], and the intradomain routing protocol (such as OSPF [2] and IS-IS [3]). Routers onthe border of an AS exchange reachability information using BGP,which is responsible for determining the AS-level forwarding path.Inside each AS, interior gateway protocols (IGPs) determine shortest paths between every router in the network. BGP determines theset of best egress points for a destination prefix. When there aremultiple equally good egress points in terms of BGP-specific attributes, IGP provides a ranking of these egress points for a giveningress point in terms of closeness. When the egress point selection is decided by comparing IGP costs, it is commonly called hotpotato routing.In previous work [4], we have used measurements of one ISPnetwork to show that hot-potato routing can have a significant impact on BGP route selection. For example, one IGP routing changeof a router’s BGP table. We call suchwas measured to changeabrupt BGP route shifts caused by IGP cost changes hot-potato disruptions. Motivated by these findings, in this paper we proposemetrics that capture the impact of intradomain changes on the control and data planes.We model the control plane as a routing matrix that maps anode and a destination to a set of potential egress points1 . This ma- A node has a set of potential egress points for each destination,because we do not consider the tie-break after the comparison of
trix is a function of the routes sent to an AS and the locally implemented routing policies. The routing matrix stores the set of egresspoints that are best according to BGP and that have equal IGP distances from the node. Changes in both IGP and BGP may affecta network routing matrix. We express this dependence informallyin the following relation, whererepresents the combination ofinformation from the two protocols: The data plane is often modeled as a traffic matrix. The trafficmatrix represents the volume of traffic from an ingress point toan egress point. We adopt this abstraction because, when combinedwith the routing matrix, it is easier to determine metrics such as theoverall network load or individual link loads.We define the traffic demand as a matrix , which determinesthe volume of traffic entering the network at a given ingress pointto a given destination prefix. The actual egress point that the traffic uses to exit the network is determined by the routing matrix.Thus, changes in traffic demands or routing decisions may result inchanges in the traffic matrix. We represent this combination as in the following relation. Informally, we can now talk about measuring robustness, or putanother way, the sensitivity of a network (or elements of a network)to perturbations. We are interested in the control plane sensitivityto an IGP change . We can capture this as and say that the network is robust if for all “small” weproduce a “small” . This naturally extends to a quantificationof data plane sensitivity, which captures perturbations to the trafficmatrix and can be derived from the control plane perturbations.Note that control plane and data plane sensitivities are not necessarily related. For example, a small routing change can produce alarge shift in traffic, and a large routing change can leave traffic unchanged. There is an interesting analogy to seismic scales in thesedefinitions. The Richter Scale is a familiar quantification of themagnitude of seismic events. A less familiar scale, called the Modified Mercalli Scale, is used to rank the intensity of a seismic event— that is, the impact that an earthquake has on human society. Themagnitude scale captures an intrinsic property of a seismic event,while values on the intensity scale vary with location and may depend on local conditions such as the structural integrity of buildings. So our “control plane sensitivity scale” is analogous to theRichter scale, while the “data plane sensitivity scale” is analogousto the Modified Mercalli Scale.In this paper, we make the following contributions to the understanding of network sensitivity to internal events:1. An analytic model of an IP network control plane and dataplane, and their interactions;2. A terminology for network sensitivity analysis;3. A methodology for computing a network’s sensitivity usingdata typically collected by large ISPs for management purposes; andIGP distances.4. A case study of applying our model to a large AS of a tier 1ISP network.The rest of the paper is organized as follows. We discuss relatedwork in Section 2. In Section 3, we present background material onrouting from an ISP perspective and discuss the challenges of modeling it. In Section 4, we model the routing matrix while focusingon a single destination prefix. We then extend the model in Section 5 to capture control plane and data plane sensitivity. Section 6presents our methodology to compute control plane sensitivity inreal networks and analyzes control plane sensitivity of a tier 1 ASto link and router failures. We conclude and present future directions in Section 7.2. RELATED WORKTraffic engineering tools evaluate the impact of different networkconfigurations on the traffic matrix. For example, Netscope [5] is atool from AT&T Labs that allows network operators to experimentwith different IGP configurations to determine the load distributionacross links. Although Netscope incorporates models of intradomain routing and hot-potato routing, these models are not formallydescribed. The algorithm presented in [6] searches for the set ofOSPF weights that leads to an optimal link load distribution. Subsequent work [7] considers weight setting that are more robust tolink failures and changes in traffic demands. More recent work [8]models the BGP routing decision in detail and allows the study ofchanges to BGP configuration on the egress point selection. Noneof these tools focuses on the network sensitivity to routing changesspecifically. They evaluate route selection ( ) and traffic distribution ( ) considering different network settings, but not theimpact of the change ( or ) on the network ( or ).The impact of intradomain routing changes ( ) on interdomain routing ( ) and that of egress point changes ( )on traffic ( ) have been quantified using measurements of ISPnetworks. A study of the Sprint network [9] characterizes the impact of BGP changes on the traffic matrix. This study found thatchanges in the traffic matrix do not correlate with BGP routingchanges. In [4], we measured the impact of intradomain changes onBGP route selection and find that some intradomain changes causea large churn of BGP routes. This study identified the seriousnessof the impact of routing interaction on ISP networks and motivatedus to develop the model and analysis presented in this paper.3. MODELING ROUTING BEHAVIORWe start this section with an overview of routing in a typical Internet Service Provider (ISP) network. Then, we outline the challenges of modeling the routing behavior and the impact of internal routing changes on the selection of external routes and consequently on traffic.3.1 Routing within an ISP NetworkThe Internet is an interconnection of Autonomous System’s (AS)networks, which are administered by ISPs and their customers. Inorder for customers of one ISP to be able to communicate with customers of another, every router in the ISP has to learn how to reachdestination prefixes that belong to its customers and those of otherISPs. Typically, BGP is used for exchanging reachability information of external destination prefixes. In particular, routers at the periphery of the ISP speak external BGP (eBGP) with routers outside(from customers or other ISPs) to learn about destination prefixesreachable via these outside routers. If a router at the periphery selects one of the routes learned externally as the best to reach the
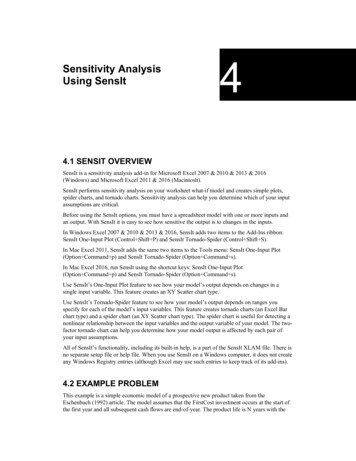
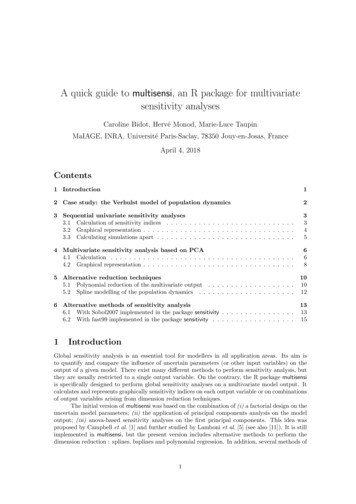
pTraffic to pNeighbor ASAnnouncement ofroute to pBA0. Ignore if exit point unreachable1. Highest local preference2. Lowest AS path length3. Lowest origin type4. Lowest MED (with same next-hop AS)5. eBGP-learned over iBGP-learned6. Lowest IGP path cost to exit point (“Hot potato”)7. Configuration-specific tie-breaking(e.g., older route or lowest router-id of BGP speaker)109CC uses egress point Ato route to pFigure 1: Hot-potato routing determines thatuses routethrough ! to forward packets to the destination prefix " .destination prefix, it distributes this route to all other routers insidethe network using internal BGP (iBGP).In addition to running BGP (iBGP and eBGP), an AS also runsan Interior Gateway Protocol (IGP) that is responsible for determining the path between routers inside the network. The most commonly used IGPs are OSPF [2] and IS-IS [3], which are link-stateprotocols. With link-state protocols, each router learns the entiretopology of the network and uses Dijkstra’s shortest path algorithmto compute the shortest path to all other routers in the network.An ISP often connects to a customer or another ISP at multiplephysical locations. This leads to scenarios where a BGP route forthe same prefix is learned by more than one router at the peripheryof the ISP network. For example, consider the scenario shown inFigure 1, where routers ! and both learn how to reach prefix "via eBGP. Both routers propagate this route via iBGP to router(as indicated by the solid arrows). From ’s point-of-view, bothroutes are equally good in terms of their BGP attributes. Therefore,can choose either ! or as the egress point out of the ISP forsending the traffic destined to " . To break the tie,selects therouter that is closer in terms of the IGP distance to the egress point.In this example, picks ! as the egress point for all the traffic todestination prefix " (as shown by the dotted line in Figure 1).When the BGP best route selection is based on the IGP distance,it is called hot-potato routing. In fact, hot-potato routing happensbecause the IGP distance to the BGP “next-hop” (the egress point)is one of the steps in the decision process used by a router liketo select the best BGP route for a given prefix. Table 1 presentsthe steps in the BGP decision process. A router uses the decisionprocess on a per prefix basis, i.e., it applies the eight steps outlinedin the table for every prefix to select a route out of multiple BGProutes the router learns for that prefix. As the table shows, firstthe router uses the IGP information to ensure that it can reach theegress point of a route using an IGP path within the network. Thenit considers various BGP attributes of routes. At the end of step 5,if two or more routes survive as equally good routes, then the routercompares the IGP distance to the egress points of these routes, andselects the route with the lowest IGP distance to the egress point.In transit AS in the core of the Internet a significant fraction ofthe routes are selected based on hot-potato routing. These includeall routes learned from peer networks and from customers that connect to the AS in multiple locations. Hot-potato routing can causea router to change its routing decision because the IGP distances toegress points have changed due to a failure, a planned maintenanceor a traffic engineering event inside the network. We call such BGProuting changes due to the hot-potato rule in the decision processhot-potato changes.Table 1: Principle steps in the BGP decision processConsider Figure 1 again and assume that a failure in one of thelinks in the path from to ! causes its cost to become # # . Thissmall change in the IGP distance makes egress point closer tothan ! , prompting it to send traffic destined to " via . Indeed, asobserved in [4], in some cases hot-potato routing can cause a largefraction of BGP routes at a given router to switch egress points dueto a single IGP change inside the network. Thus, abrupt hot-potatorouting changes can have a significant impact on both the controlplane and the data plane. The goal of this paper is to understandwhen and why such changes happen through an analytic model ofthe BGP/IGP interaction and sensitivity metrics that characterizenetwork sensitivity to IGP changes.3.2 ChallengesModeling the sensitivity of routing and traffic to IGP changesinside an ISP network requires a good understanding of how thenetwork uses IGP and BGP for routing, the resulting routing matrix, the traffic demands, and how the traffic demands and routingmatrix combine to generate the traffic matrix. Below we outline themain challenges of modeling this complex system:IGP. Each AS has the freedom to design its internal routing infrastructure and select the appropriate IGP to route packets withinthe network. For scalability reasons, both OSPF and IS-IS allowhierarchical routing by dividing a network into areas [2, 3]. Whenareas are employed, packets are forwarded along shortest pathswithin an area, but may deviate from the shortest paths when theytraverse multiple areas. As a result, a model of hot-potato routingneeds to incorporate the link weights and the division of routersinto areas and accurately model the IGP path cost computation.BGP. Modeling the complete set of egress points per prefix withinan ISP can become complicated due to the iBGP architecture of anetwork. The BGP standard requires a full mesh of iBGP connections between all BGP speaking routers in the network [1]. This ensures that all the routers know about the best routes learned by every other router via eBGP. To overcome the resulting scalability issues, networks with a large number of BGP speakers usually structure them into some form of iBGP hierarchy; “router-reflectors”and “confederations” are two popular ways of forming this hierarchy [10]. An unfortunate side-effect is that some BGP routes areavailable to only a subset of BGP routers inside a network. This canlead to scenarios where different routers in a network have differentsets of egress points.Routing matrix. After we have an abstract model of both IGPand BGP decisions, we still need to combine them to form therouting matrix, which depends on the interaction of the two protocols. Some parts of this interaction are standardized such as steps0 through 6 of the BGP decision process, whereas some like the tiebreaking rule after the comparison of IGP costs are not. This implies that the interaction between IGPs and BGP depends on routerimplementation or specific network configuration.Traffic demands and traffic matrix. The traffic demand placedon a network depends on the traffic sent and received by the end-
users attached to customer and peer networks, and the locations inwhich% they connect to the network. Consequently, traffic demandsvary considerably over time. In general, it is hard to obtain a representative snapshot of the traffic demands and the resulting trafficmatrix. Even though measurement and estimation of the traffic matrix have received considerable research attention of late [11, 12,13], measurements are aggregated or sampled and not all routers inthe network are capable of collecting the required data [13].3.3 Assumptions of the ModelTo reduce the complexity of modeling all these details, we makethe following simplifying assumptions:1. All routers know all routes to reach a destination prefix. As mentioned earlier, this assumption is valid when BGPspeakers are organized in a full iBGP mesh. In ASes that usean iBGP hierarchy this assumption no longer holds. However, even in the case of an iBGP hierarchy, the followingcondition is enough for our model to capture the networksensitivity correctly: every router at the very least learns theroute that it would have picked as the best route had it learnedall the eBGP-learned routes for a given prefix.2. Well-configured iBGP. Griffin and Wilfong [14] describescenarios in which iBGP misconfigurations can lead to routedeflections. This means that routers in the forwarding pathto an egress point for a prefix disagree on the selection of theegress point leading to deflections and loops in an extremecase. We assume that the network configuration satisfies theconditions specified in [14] for avoiding such loops and deflections.3. Stable BGP routing snapshots. We assume that BGP policies and eBGP routes are stable. Our model works with snapshots of BGP routes and analyzes the impact of intradomainrouting changes on snapshot of routes.4. Stable snapshots of traffic demands. Similarly, our modeltakes as input snapshots of the traffic demands to analyze theimpact of intradomain routing changes on traffic.These assumptions allow us to model the state of routing systemand snapshots of traffic. Our model does not capture the routingdynamics or traffic load variations directly. A single underlyingevent may cause a series of routing messages, and routers in thenetwork may take some time to converge to a consistent state. Wedo not model the sequence of messages exchanged to reach a stablerouting state. Instead, we model a routing change from one stablestate to another stable state reached after the convergence phase.4.REGIONS AND REGION SHIFTSThis section first introduces concepts from multidimensional dataanalysis that inspired us in our network sensitivity analysis. Then,it describes a graph model and the concepts of graph regions andregion shifts that together form the basis of our network model ofhot-potato routing. The set of definitions presented here capture theinteraction between BGP and IGP when considering a single destination prefix. In Section 5, we build on this terminology to definecontrol plane and data plane sensitivity metrics. Table 2 summarizes the notation introduced in this section and the following one,and used in the remainder of the paper.BasicUniverse of verticesUndirected weight graphRoot set or egress set ’s rank for root vertex ?Region of a root vertex ?Region index set of a vertex Class of graph transformationsProbability function forgraph transformations&')( *-,/.10 .324.35761.8,:9;& 9;&5@* .1?A6BDCE*F'4.G H6HIJ,BLK@*-'4.1 M. 6NIO P 'QRegionalRegion-shift functionVertex sensitivityImpact of a graph transformationGraph sensitivityRS*F'4.G T. .1UV6WX*-'4.Y T.EP '4. Q . 6Z *-'4.G T.EU[6\]*F' .1 M.1P '4. Q 6Control Plane SensitivitySet of destination prefixes ;ab )ced3fRhgDi *-'4.E M. .YUV6W gDi *-'4.1 N.EP '4. Q . 6Mapping of prefixes to egress setsRouting-shift functionNode routing sensitivityRouting impact of a graphtransformationControl plane sensitivityData Plane SensitivitySet of ingress nodesIngress-to-prefix traffic matrixTotal traffic volume entering Traffic-shift functionIngress node traffic sensitivityTraffic impact of a graphtransformationData plane sensitivityZ gDi *F'4.G M.EUV6j\ gDi *-'4.1 N.EP '4. Q 6kl * 6R m i F* '4.G N.3kn. G. U[6W m i *-4' .E M.GP '4. Q o. kn. 6Z m ip*F'4.G N.3kn.GUV6\ m i *-'4.E M.EP '4. Q .okq6Table 2: Summary of definitions and metrics.4.1 Multidimensional Data AnalysisExtracting useful information from a network configuration is avery difficult task. We are interested in the sensitivity of a networkto hot-potato disruptions, which depends on a number of factors including network topology, routing policies, location in the network,the specific network changes considered, etc. To make mattersworse, there seems to be no “one size fits all” metric that can capture the routing sensitivity in a meaningful way. Our approach tomanaging this complexity is inspired by the area of databases wheresimilar challenges arise — Online Analytic Processing (OLAP) [15,16, 17]. The key to OLAP design is to arrange data in a multidimensional cube, and then provide natural ways to “slice and dice”the data along multiple dimensions.For instance, imagine a three-dimensional OLAP data cube inwhich each cell contains sales totals indexed by product sold, cityof sales, and day of sales. It is possible to explore the sales databy dicing it into one, two, or three-dimensional slices, and thenaggregating and displaying a slice in various ways. For example, ifwe fix a product and city, then we obtain a one-dimensional slice ofthe cube that captures the sales over time of the chosen product inthe chosen city. This slice could be used to compute an average overall days, or to find the days of maximum sales. In a similar way,if we fix a city, we can obtain a two-dimensional slice of the cubethat captures the sales of all products in that city over all days. An
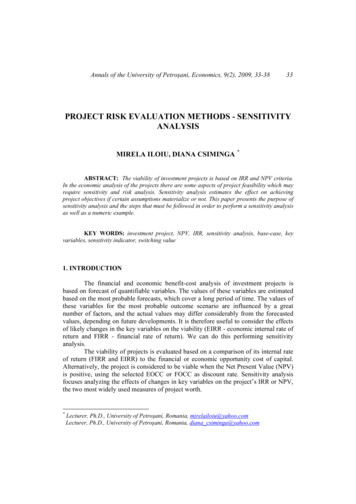
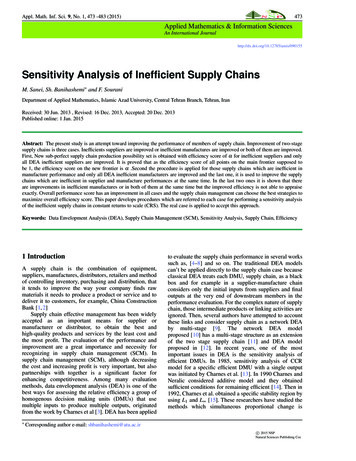
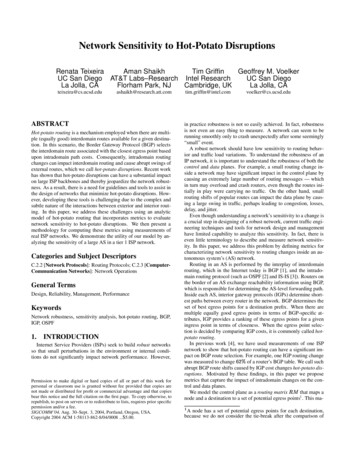
interesting characteristic of most data cubes is that the dimensionaldata %has some natural hierarchical structure. For example, we couldgenerate a new data cube by “rolling-up” the time dimension to thelevel of month, the location dimension to the level of country, andthe product dimension to the level of category.Figure 2 presents the OLAP data cube we define for the purposeof exploring the impact of hot-potato routing on a network. Ourdimensions are location (routers), network change (representing afixed class of changes such as “all single link failures” or “all singlenode failures”), and IP prefixes. We find that a large number ofinteresting hot-potato sensitivity queries can be computed with avery simple data cube — each data cell contains only a single bit!This bit is set if the associated router changes egress points for theassociated prefix when the associated network change is applied.In this paper, we will not explore the fine-grained hierarchy of ourdimensional data (for example, routers are naturally grouped intoPoPs, which can be grouped into regions, which in turn can begrouped into countries), but the utility of this should be clear.IP prefixesnetworkchangeslocationsFigure 2: Data cube for network sensitivity analysis.decision process) to use any of the associated regions. Note that if p v , then C u3 w8 Ts .We define 4]u3 wY w8 § as the region index set of a vertex in a graph divided into regions according to the root set .BLK@*-'4.Y T. 6 ( ª? ? T. B C *F'4.G H6E« The region index set of a vertex is the set of root nodes thatare closest to . If is the egress set for a destination prefix " ,then ]u3 wY wY represents ’s entry in the routing matrix whenconsidering " . If is disconnected from the graph, then D wY{]uF w8 F Ts and ]u3 w1 hw1 Ts .For example, the graph in Figure 3 presents the internal topology of the AS shown in Figure 1. The figure shows the division ofthis topology into regions for the destination prefix " from our previous example. The root set is the egress set for " , so )s 7! w8 . All other nodes are internal nodes. An arrow from vertex to vertexrepresents that vertex is the successor of vertex in the shortest path to a root . The distances from to ! and are ² and#ª³ , respectively; therefore, is in the region of ! (i.e., it forwardspackets using egress point ! ). The region )sq 7! w w8µ¶w8· wV H represents all routers that forward packets to " using ! as the egresspoint, and the region ¹ s wV similarly represents the routersthat use as the egress. Note that router is in both and ¹ ,hence ]u3 w1 hwV Ms 7! w8 .In this section, we study slices of the data cube that correspondto an IP prefix such as the one represented by the shaded surfacein Figure 2. We define metrics of region-shift sensitivity computedover this surface.BLCE*-'4.G H6 (: , and 5 * .Y? 6N p5 * .Y? 61. ? T.E?H(J ? E T This construction divides into regions, and each region C u3 w8 L is a shortest distance tree rooted in . Note, though, thatthe division of into regions is not a partition of the vertices in because regions are not necessarily mutually disjoint. For instance,if {]uF w8 F Ts {]uF w1 - - for Ew A H , then p C u3 w8 L ; C ¡8u3 w8 L .We allow vertices to be in more than one region to model the potential of the tie-break decision (after the hot-potato step in the BGP We consider v a subset of a greater universe of vertices becausewe want to study cases in which vertices are deleted or added to thegraph .5938 J114F4.2 DefinitionsLet r be the universe set of vertices. Given an undirected weightedgraph ts u3vTwYxyw1z wY{ , where v } r , and a non-empty set ofvertices } r , we say that is the set of root vertices.2 Theseroot vertices represent the set of egress points for a destination prefix.Every vertex r has a local ranking of root vertices. Thefunction {]uF w8 F returns ’s rank for root vertex . When either or p v , {]uF w8 F Ms . If {]uF w8 F {]uF w8 - F , then is closer to thanto . The ranking function { represents the IGP distance betweenrouters in a network, and consequently its computation depends onspecific details of the intradomain routing protocol and the networkconfiguration. In a network with no IGP hierarchy, {]uF w8 F is thesum of the weights of the edges in a shortest path between and .If the network has a more complex IGP structure, then {]uF w8 F canbe computed using a model of the IGP hierarchy [5, 18].Given a graph with ranking function { and a root set , eachroot vertex induces a region :v such that:D3ACRegion of AB6104G6Region of BFigure 3: Example of the division of into regions.A graph transformation of is a function ºO»Lu3vTw8xSwYz wY{ ¼3u v w8x w8z wY{ that deletes one or more edges or vertices, changesthe weight of one or more edges, or adds one or more edges orvertices. Let S be the class of graph transformations of , suchas the set of single edge deletions. Every graph transformation ºhas a probability ½ uFº@ associated with it such that ¾ ¿[À@ÁN ½ uFº s# .For each º¶ à S and v , we can compute the region-shiftfunction Äpu3 w8 w8 wYº as follows:RS*-'4.G T. .1UV6 (.ÅÇÈ Æ . BLK@*AU7*-' 6Y.1 T. 6if BLK@*-'4.1 M. 6 ()otherwiseIntuitively, the function Ä determines whether a vertex
alyzing the sensitivity of a large AS in a tier 1 ISP network. Categories and Subject Descriptors C.2.2 [Network Protocols]: Routing Protocols; C.2.3 [Computer-Communication Networks]: Network Operations General Terms Design, Reliability, Management, Performance Keywords Network robustness, sensitivity analysis, hot-potatorouting, BGP, IGP, OSPF 1.