Transcription
www.msci.comThe Fundamentals of Fundamental FactorModelsJune 2010Jennifer BenderFrank NielsenMSCI Research 2010 MSCI. All rights reserved.Please refer to the disclaimer at the end of this document.1 of 15Electronic copy available at: http://ssrn.com/abstract 1707661
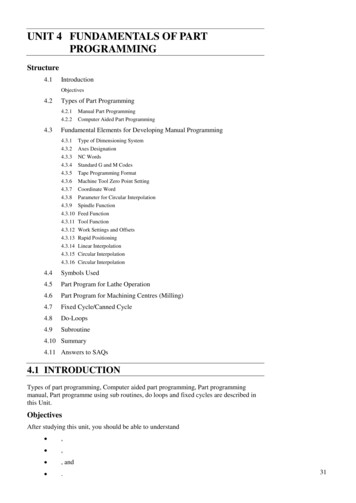
The Fundamentals of Fundamental FactorModels June 2010IntroductionFundamental analysis is the process of determining a security’s future value by analyzing acombination of macro and microeconomic events and company specific characteristics. Thoughfundamental analysis focuses on the valuation of individual companies, most institutionalinvestors recognize that there are common factors1 affecting all stocks. For example,macroeconomic events, like sudden changes in interest rate, inflation, or exchange rateexpectations, can affect all stocks to varying degrees, depending on the stock’s characteristics.Barr Rosenberg and Vinay Marathe (1976) developed the theory that the effects ofmacroeconomic events on individual securities could be captured through microeconomiccharacteristics – essentially common factors, such as industry membership, financial structure, orgrowth orientation.Rosenberg and Marathe (1976) discuss possible effects of a money market crisis. They say amoney market crisis would:“result in possible bankruptcy for some firms, dislocation of the commercial paper market, and adearth of new bank lending beyond existing commitments. Firms with high financial risk (shownin extreme leverage, poor coverage of fixed charges, and inadequate liquid assets) might bedriven to bankruptcy. Almost all firms would suffer to some degree from higher borrowing costsand worsened economic expectations: Firms with high financial risk would be impacted most; themarket portfolio, which is a weighted average of all firms, would be somewhat less exposed; andfirms with abnormally low financial risk would suffer the least. Moreover, some industries such asconstruction would suffer greatly because of their special exposure to interest rates. Others suchas liquor might be unaffected.”This early insight into the linkage between macroeconomic events and microeconomiccharacteristics has had a profound impact on the asset management industry ever since. In thispaper, we discuss the intuition behind a fundamental factor model based on microeconomic traits,showing how it is linked to traditional fundamental analysis. When building a fundamental factormodel, we look for variables that explain return, just as fundamental analysts do. We highlightthe complementary role of the fundamental factor model to traditional security analysis and pointout the insights these models can provide.Fundamental Analysis and the Barra Fundamental Factor ModelFundamental analysts use many criteria when researching companies; they may investigate afirm's financial statements, talk to senior management, visit facilities and plants, or analyze aproduct pipeline. Most are seeking undervalued companies with good fundamentals orcompanies with strong growth potential. They typically review a range of quantitative andqualitative information to help predict future stock values. Exhibit 1 summarizes key areas.1Common factors are shared characteristics between firms that affect their returns.MSCI Research 2010 MSCI. All rights reserved.Please refer to the disclaimer at the end of this document.2 of 15Electronic copy available at: http://ssrn.com/abstract 1707661RVTemp
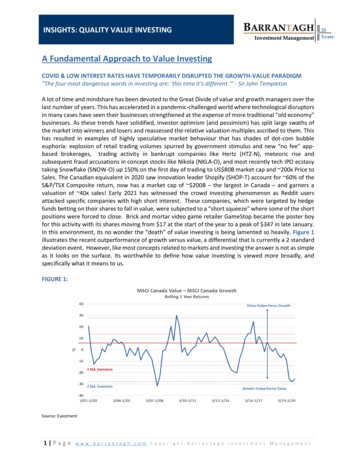
The Fundamentals of Fundamental FactorModels June 2010Exhibit 1: Main Areas of Stock Research2QualitativeQuantitativeBusiness ModelCapital StructureCompetitive AdvantageRevenue, Expenses, andEarnings GrowthManagement QualityCash FlowsCorporate GovernanceSimilarly, the goal of a fundamental factor model is to identify traits that are important inforecasting security risk. These models may analyze microeconomic characteristics, such asindustry membership, earnings growth, cash flow, debt-to-assets, and company specific traits.Exhibit 2 shows the cumulative returns to Merck, GlaxoSmithKline, and Bristol-Myers, three of thelargest pharmaceutical companies in the US. The chart illustrates the similarities in the returnbehavior of these stocks, primarily because they are US large cap equities within the sameindustry. We also see that Bristol-Myers underperformed the other two companies in recentyears, indicating that other firm-specific factors also impacted its performance.Exhibit 2: Industry Membership Drives Similarities Between StocksCumulative Returns (July 1986 0)2520151050MerckGlaxoSmithKlineBristol‐Myers Squibb CompanyThe first task when building a fundamental factor model is to identify microeconomic traits. Theseinclude characteristics from industry membership and financial ratios to technical indicators likeprice momentum and recent volatility that explain return variation across a relevant securityuniverse. The next step is to determine the impact certain events may have on individual stocks,such as the sensitivity or weight of an individual security to a change in a given fundamental2Balance sheet and income statement data are readily available from 10K filings while access to company management and informationabout the business model and competitor landscape will vary on a case-by-case basis.MSCI Research 2010 MSCI. All rights reserved.Please refer to the disclaimer at the end of this document.3 of 15Electronic copy available at: http://ssrn.com/abstract 1707661RVTemp
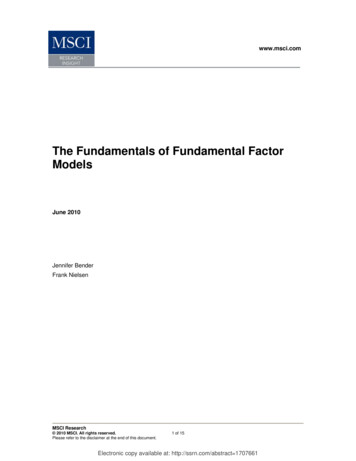
The Fundamentals of Fundamental FactorModels June 2010factor.3 Finally, the remaining part of returns needs to be modeled, which is the company-specificbehavior of stocks.How does the model we have described compare with the way a fundamental analyst or portfoliomanager analyzes stocks? The basic building blocks of analysts and factor modelers are in factsimilar; both try to identify microeconomic traits that drive the risk and returns of individualsecurities. Exhibit 3 compares the two perspectives. In both views, there are clearly firm-specifictraits driving risk and return. There are also sources of risk and return from a stock’s exposure, orbeta, to the overall market, its industry, and certain financial and technical ratios. But the objectiveof the fundamental analyst is to forecast return (or future stock values) whereas the fundamentalfactor model forecasts the fluctuation of a security or a portfolio of securities around its expectedreturn.Exhibit 3: Overview of Stock Determinants: Fundamental Analysis versus Factor Model oNews/TrendsCompanyNewsFactor ModelRisk Modeler:Forecast RiskFundamentalAnalysisPortfolio Manager:Forecast ReturnBoth the analyst and the factor model researcher look at similar macro and microeconomic dataand events when researching factors that drive stock returns and risk. Exhibit 4 shows examplesused in the Barra equity models. 4 These traits have been identified as important in explaining therisk and returns of stocks. Note that adjustments of financial statements are incorporated inseveral ways.53In the Barra US equity model for example, we allow companies to be split up into five different industries, depending on their businessstructure.4This exhibit shows some of the fundamental variables used in the Barra US and Japan Equity Models. However, the models are notlimited to fundamental data. Depending on further research, technical variables such as price momentum, beta, option-implied volatility, etc.may also be used. For instance, price momentum has been shown to significantly explain returns ( Carhart, 1997). Qualitative data canalso be included in these models if there are straightforward ways to assign appropriate values to individual stocks. In general,incorporating qualitative data remains a challenge for both asset managers and factor model researchers. The former must relate this datato valuation models, while the latter must integrate this information into the risk models.5A key task for the fundamental analyst is to adjust financial statements – each analyst wants to get at the “real” number rather than whatis reported in financial statements. Even under generally accepted accounting principles, management can be aggressive with basicprinciples, such as revenue/expense recognition, usage of unusual, infrequent or extraordinary items, and timing issues that may lead toviolations of the matching principle. A significant part of this may involve studying the footnotes of the statements. We use forward-looking,analyst-derived descriptors in our models for this purpose.MSCI Research 2010 MSCI. All rights reserved.Please refer to the disclaimer at the end of this document.4 of 15RVTemp
The Fundamentals of Fundamental FactorModels June 2010Exhibit 4: Sample Fundamental Data Used in Barra Models6ValueBook valueGrowthFive‐year payoutAnalyst predicted Variability in capitalearningsstructureTrailing earningsGrowth in total assetsForecast operatingGrowth in revenuesincomeSalesPension liabilitiesHistorical earningsForecast salesgrowthAnalyst‐predictedearnings growthEarnings VariationVariability in earningsStandard deviation ofanalyst predictedearningsVariability in cashflowsExtraordinary items inearningsLeverageMarket leverageForeign SensitivityExchange rate sensitivityBook leverageOil price sensitivityDebt to assetsSenior debt ratingSensitivity to other marketindicesExport revenue aspercentage of totalRecent earnings changesHow are the fundamental data used in a factor model? Certain factors are found to explain stockreturns over time, for example, industries and certain financial and technical ratios. If suchfactors explain returns across a broad universe of stocks, they are deemed important. In financialtheory, these factors are “priced” across assets, for example, Fama/French Value, Growth, andSize factors.Once we have identified the factors, we need to link each stock to each factor. For this, we usemicroeconomic characteristics. We start by identifying a set of characteristics we call descriptors.For instance, if the factor is growth, a few descriptors might include earnings growth, revenuegrowth, and asset growth (see Exhibit 4). These include both historical and forward-lookingdescriptors, such as forecast earnings growth. After we identify the important descriptors, westandardize them across a universe of stocks, typically the constituents of a broad market index.7Exhibit 5 illustrates how Microsoft’s exposures for the Barra US factors - Size, Value, and Yield are calculated. We subtract the estimation universe average8 descriptor for each factor and divideit by the standard deviation of the universe of stocks.Exhibit 5: Calculating Exposures from Raw Data (April 1, 2010)Barra FactorSizeValueYieldCapitalization (USD9Bn)Book toPricePredicted DividendYieldMicrosoft256.70.150.02Estimation Universe Average69.80.390.02Estimation Universe Std Dev21.10.370.02Exposure1.64-0.620.06Descriptor for Factor6Variables like profitability and debt loads get incorporated in our models through factors like Earnings Yield, Growth, and Leverage.Expectations of profitability and future revenue growth and cost savings get incorporated through variables such as the analyst consensusview on future P/E. What about key metrics that are not included? There are two reasons why variables fundamental analysts might lookat are not incorporated in a factor model. The first is that some of these factors may help managers forecast return but they are notgenerally good risk factors. (A good return factor has persistent direction though not a lot of volatility – the ability of a company to beatearnings estimates is one of these factors). The second reason is that there may be risk factors specific to individual industries that areless meaningful across industries. Industry or sector risk models would include these risk factors.7All existing Barra models focus on a particular market, using an equity universe that includes all sectors and large to mid-caps with somesmall-caps. Important criteria relevant to only the airline industry could be captured in sector factor models, a current area of research.8This is actually a market-cap weighted average.9Note that the actual descriptor for the US Size factor uses the log of market capitalization. The log of market cap for Microsoft is 12.46.The estimation universe average is 10.22 and the standard deviation 1.36. The resulting exposure for Microsoft is 1.64.MSCI Research 2010 MSCI. All rights reserved.Please refer to the disclaimer at the end of this document.5 of 15RVTemp
The Fundamentals of Fundamental FactorModels June 2010In some cases, factors reflect several characteristics. This occurs when multiple descriptors helpexplain the same factor. The Barra US Growth factor, for instance, reflects five-year payouts,variability in capital structure, growth in total assets, recent large earnings changes, and forecastand historical earnings growth. Exhibit 6 shows how we calculate Microsoft’s exposure to theGrowth factor. Each descriptor is first standardized and then the descriptors are combined toform the exposure.Exhibit 6: Calculating Exposures when there are Multiple Characteristics (April 1, 2010)FactorDescriptorGrowthGrowthRate arningsGrowthVariabilityin CapitalStructureEarningsGrowth RateOver Last 5Years5 ionUniverse Std 0.950.06-0.400.240.030.09Weight of 7In addition to factors like Value, Size, Yield, and Growth, which we call style factors, a stock’sreturns are also a function of its industry. Industry exposures are calculated in a different way. Acompany like Google for instance, is engaged solely in Internet-related activities. It has anexposure of 100% (1.0) to the Internet industry factor in the Barra
The second reason is that there may be risk factors specific to individual indust ries that are less meaningful across industries. Industry or sector risk models would include these risk factors. 7 All existing Barra models focus on a particular market, using an equity universe that includes all sectors and large to mid-caps with some small-caps. Important criteria relevant to only the airline industry could be