Transcription
Copyright!Reproduction and dissemination – also partial – applicable to all media only withwritten permission of Umschau Zeitschriftenverlag GmbH, Wiesbaden.Science & Research Original ContributionPeer-reviewed Manuscript received: May 29, 2017 Revision accepted: August 21, 2017Nutri-Score: Evidence of the effectivenessof the French front-of-pack nutrition labelChantal Julia, Serge HercbergAbstractFrance recently decided to implement a newly developed 5 colourFront-of-Pack (FOP) nutrition labelling, “Nutri-Score” to orient consumers towards healthier food choices at the point of purchase and asan incentive for manufacturers to reformulate their products towardshealthier compositions. Results of validation studies suggest that theFood Standards Agency nutrient profiling system (FSA-NPS) underlyingthe Nutri-Score can adequately characterize the nutritional quality offoods, and that an individual score (FSA-NPS dietary index, FSA-NPS DI)based on the FSA score of the foods consumed can adequately summarize the nutritional quality of the diet. Moreover, the FSA-NPS DI isassociated with chronic diseases onset. The format of the Nutri-Scoreappears well-perceived and understood. Finally, the Nutri-Score wasassociated with a higher nutritional quality of purchases in experimentaland large scale trials. Altogether, these elements tend to corroborate theNutri-Score as an efficient tool in public health nutrition.Keywords: front-of-pack labelling, nutrient profiling systems, validation, public health policiesBackgroundCitation:Julia C, Hercberg S (2017) NutriScore: evidence of the effectiveness of the French front-of-packnutrition label. ErnahrungsUmschau 64(12): 181–187This article is available online:DOI: 10.4455/eu.2017.048In order to tackle the growing increase in nutrition-related conditions, government-led strategiesand policies have introduced multifaceted interventions aiming at improving the diet in the population[1-5]. Among the variety of possible interventions, Front-Of-Pack(FOP) nutrition labels have receivedgrowing attention from public authorities and learned societies [4, 6].FOP nutrition labels are considered ahelpful guidance for consumers towards healthier food choices at thepoint of purchase [7-9]. Moreover,they are thought to be incentives formanufacturers to reformulate theirproducts towards healthier compositions, which would be materializedon the FOP label.Since 2001, France has set a publichealth nutrition policy, the Programme National Nutrition Santé(PNNS, French Nutrition and HealthProgram) which combines laws, regulations and incentives in the fieldof nutrition (diet and physical activity) to improve the population’shealth status [10, 11]. Following areport by the Minister of Health tothe president of the PNNS in 2014– which included 15 public healthmeasures [6] – the principle of aFOP nutrition label was included inthe Health law, enacted in January,2016 [12]. The Nutri-Score (alsoknown in its former version as the5-Colour Nutrition label, 5-CNL)was finally selected after comparison tests against several labelsproposed by industry or retailers inMarch 2017, and the EU was notified of the implementation of thislabel in the following month. Thismanuscript retraces the elementsthat led the French health authorities to select the Nutri-Score.The Nutri-Score/5-CNL relies on thecomputation of a nutrient profilingsystem, derived from the UnitedKingdom Food Standards Agencynutrient profiling system (FSA score)[13-15]. The FSA score is computedtaking into account nutrient contentper 100g for food and beverages. Itallocates positive points for “unfavourable” content: energy (kJ, 0-10points), total sugar (g, 0-10 points),saturated fatty acids (g, 0-10 points)and sodium (mg, 0-10 points). Negative points are allocated for “favourable” contents: fruits, vegetables and nuts (0-5 points), fibers (0-5Ernaehrungs Umschau international 12/2017 181
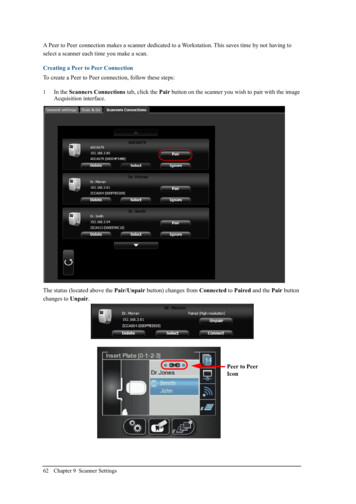
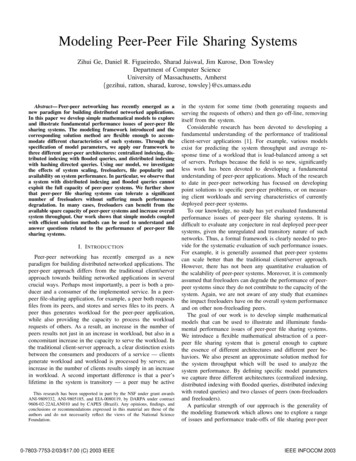
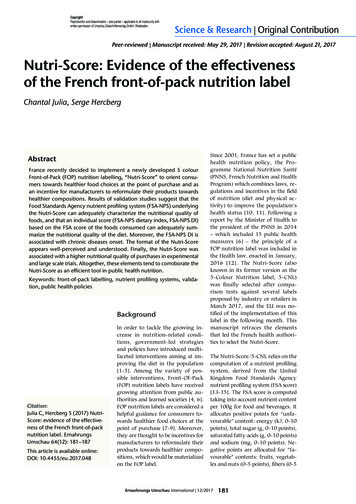
Copyright!Reproduction and dissemination – also partial – applicable to all media only withwritten permission of Umschau Zeitschriftenverlag GmbH, Wiesbaden.Science & Research Original Contributionpoints) and proteins (0-5 points).The total from positive (0-40 pointsin total) and negative (0-15 points)points is computed, yielding a globalscore ranging from -15 for the mosthealthy foods (0 positive points and15 negative points) to 40 for lesshealthy foods (40 positive pointsand 0 negative points) ( Table 1).From this overall score, five categories of nutritional quality are derived, defining the categories for theNutri-Score, ranging from ‘green’to ‘red’ ( Figure 1). Letters (A toE) were added to colours in order toimprove the readability of the label.The entire scale appears on the label,with the letter/colour correspondingto the product’s nutritional qualityenlarged. Using the Nutri-Score,whole-grain bread or plain yogurtare classified as Green/A, chocolate-flavored breakfast cereals or jamare classified as Yellow/C, and cho-1. Attribution of points, based on the content of nutrients and other elements per 100 g of a J)Sugars(g)Energy(kJ)Sugars(g)Saturatedfat (g)Saturated fat/Lipids (%)Sodium(mg)PointsFruits,veg (%)Fruits,veg (%)Fiber(g)Protein(g)0 335 4.5 00 1 10 900 40 40 0.7 1.61 335 4.5 30 1.5 1 16 901 402 670 9 60 3 2 22 1802 603 1,005 13.5 90 4.5 3 28 2703–4 1,340 18 120 6 4 34 3604–5 1,675 22.5 150 7.5 5 40 4505 806 2,010 27 180 9 6 46 54067 2,345 31 210 10.5 7 52 63078 2,680 36 240 12 8 58 72089 3,015 40 270 13.5 9 64 8109 3,350 45 270 13.510100–10 (a) 0–10 (b) 0–10 (a) 0–10 (b)Total 10 64 9000–10 (c)0–10 (c)0–10 (d)Points A (a) (b) (c) (d) [0 – 40] 3.2 2.1 4.8 60 2.8 6.4 3.5 8.00–5 (b)0–5 (c) 800–5 (a)Total0–10 (a)Points C (a) (b) (c) [0 – 15]Foods (points)Points A 11or for cheesePoints A 11Final score Points A – Points C 1.6 1.43. Attribution of colors2. Final score: -15 to 40 pointsPoints fruitsand vegetables 5 0.7 40Points fruits andvegetables 5Final score Points A – (fiber-points fruits & vegetables- points )Beverages(points)Colormin to -1watergreen0 to 2min to 1light green3 to 102–5yellow11 to 186–9orange19 to max10 to maxdark orangeFinal score Points A – Points CGreen: highest qualityRed: lowest qualityTable 1: S core computation and attribution of the categories for the Nutri-Score/5-CNLFor each component (in columns), points are attributed based on their nutritional composition for 100g. In some food categories, a specific attribution grid for points is used. The sum of points for A components (in red) is drawn. Depending on this sum, the total or partof C components are subtracted, yielding the overall score of the food product. The Nutri-Score is attributed based on this overall score,with specific thresholds for foods and beverages.182 Ernaehrungs Umschau international 12/2017
Copyright!Reproduction and dissemination – also partial – applicable to all media only withwritten permission of Umschau Zeitschriftenverlag GmbH, Wiesbaden.Figure 1: Nutri-Score, and its former graphical format, the 5-CNLcolate biscuits or chocolate spreadsas Red/E.Application of the FSAscore in the French foodenvironmentClassification of foodsThe FSA score was first applied to theFrench Nutrinet-Santé food composition database [16], which includesgeneric foods usually consumed inthe French diet. This study comparedthe classification of foods using theFSA score to French food-based dietary recommendations, and assessedwhether the FSA score was able todefine five categories of nutritionalquality of foods. Overall, the FSAscore classified foods consistentlywith nutritional recommendations.While 82.4% of fruit and vegetableswere in the first quintile of distribu-tion, 22% of ‘sugary snacks’ werein the fifth quintile of distribution.Moreover, the FSA score displayed alarge variability within food groups,which allowed for a discriminationof the nutritional quality within afood group. The feasibility and discriminant capacity of the FSA scorewere confirmed when applying itto a food composition database reflecting foods as sold in France, theOpen Food Facts database [17]. However these studies showed that theapplication of five categories of nutritional quality did not perfectlyagree with nutritional recommendations for 3 food groups: beverages,cheese and added fat. These resultswere further confirmed by a report of the French Agency for Food,Environmental and OccupationalHealth and Safety, ANSES [18]. TheANSES also proposed a first set ofthresholds for the Nutri-Score, basedon the quintiles of the distributionof the FSA score observed in the Observatory of Food Quality (OQALI)database and including more than12,000 foods and beverages, as soldin France. The French High Councilof Public Health (HCSP) was commissioned to precise thresholds defining the 5 colours and to make thenecessary adaptation of the FSA algorithm for cheese, added fats andbeverages [19], defining the finalcontours of the Nutri-Score/5-CNLfor France. The final thresholds ofthe Nutri-Score were set in order toincrease the discrimination of products within a food category.Minor modifications to the FSAscore algorithm were performed bythe HCSP for beverages, cheese andadded fats. Modifications consistedin the adaptations of the allocationof points for saturated fatty acids/fats, energy and sugars for beverages and modification of the overall algorithm (taking into accountprotein) for cheese ( Table 1), andallowed for an improvement of theconsistency between the 5-CNL/Nutri-Score classification and theFrench nutritional recommendations. For fats, the updated FSAalgorithm allowed to discriminatebetween vegetable oils rich in n-3polyunsaturated fatty acids (PUFA)(colza oil classified in Yellow/C vs.Red/E in the original version), vegetable oils low in n-3 PUFA (sunflower oil classified in Orange/D vs.Red/E in the original version) andanimal fats (butter, classified inRed/E in both versions). For beverages the updated algorithm discriminated between water (Green/A), artificially sweetened beverages (LightGreen/B), fruit juices (Yellow/C),low-sugar soft drinks (Orange/D)and regular soft drinks (Red/E),while in the original FSA score thedistribution of beverages was toonarrow to allow any discrimination. For cheese, the updated versionof the FSA score allowed to take better account of the calcium content ofcheese, which is highly correlated tothe protein content of cheese.Finally, the discriminant capacity ofthe 5-CNL was also confirmed in aErnaehrungs Umschau international 12/2017 183
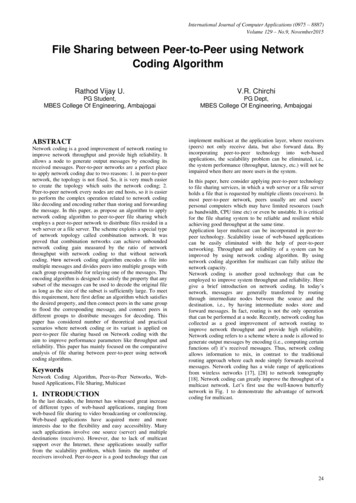
Copyright!Reproduction and dissemination – also partial – applicable to all media only withwritten permission of Umschau Zeitschriftenverlag GmbH, Wiesbaden.Science & Research Original Contributionlarge specific group of foods: breakfast cereals (n 380) [20], as alltypes of cereals – and even similarcereals from different brands – wereclassified in at least three categoriesof the 5-CNL.FSA score as an indicatorof the overall quality ofthe diet at individual levelThe FSA score was transposed intoan individual indicator aiming atreflecting the overall nutritionalquality of the diet, the FSA-NPSDI [21]. As the FSA score of foods,a higher FSA-NPS DI reflects lowernutritional quality of the foods consumed in the overall diet of the individual. The FSA-NPS DI was validated against food consumption,nutrient intake and biomarkers ofnutritional status, in three Frenchstudies: in a representative sampleof the French population randomlyselected from the NutriNet-Santéstudy (n 4,225) [21], in the FrenchSU.VI.MAX cohort study (n 5882)[22] and the representative population-based ENNS cross-sectionalstudy (n 2,754) [23].In all three studies, higher FSA-NPSDI (reflecting a lower nutritionalquality of the diet) was associatedwith higher consumption of sweet,fatty and salty foods and lowerconsumption of fruits, vegetables,fish and whole grains [21]. HigherFSA-NPS DI was also associated withhigher energy intakes, higher intakesof saturated fats, added sugars andlower intakes of polyunsaturatedfatty acids, fibers, vitamins and minerals. FSA-NPS DI was associatedwith lower levels of LDL-cholesteroland antioxidant biomarkers [22].FSA-NPS DI and health outcomesThe prospective associations between FSA-NPS DI and health outcomes were investigated in two largeFrench cohorts: the SU.VI.MAX cohort and the NutriNet-Santé cohortstudy. The investigated outcomeswere cancer (and breast cancer),cardiovascular disease, metabolicCancerQuintile 1Quintile 2Quintile 3Quintile 4Quintile 5p 0.03Quartile 1Quartile 2Quartile 3Quartile 4Obesity MenQuartile 1Quartile 2Quartile 3Quartile 4Obesity WomenQuartile 1Quartile 2Quartile 3Quartile 4Metabolicsyndrome Quartile 1Quartile 2Quartile 3Quartile 4p 0.03Cardiovasculardiseasep 0.01p 0.39p 0.020.52Figure 2: Prospective associations (multivariable odd ratio and 95% confidence interval) between FSA-NPS DI and health outcomes in theSU.VI.MAX cohort studysyndrome and weight gain [24-29].A synthesis of the observed associations in the SU.VI.MAX cohort isshown in figure 2. Overall, poorerdiets, as expressed by the FSA-NPS DIwere associated with a higher risk ofdeveloping a chronic disease in bothcohorts. Between the Quartile 4 (lesshealthy diets) and Quartile 1 (morehealthy diets) of the FSA-NPS DI, theodds of developing metabolic syndrome were increased by 43%, overweight and obesity in men by 61%and cardiovascular diseases by 40 to61%. Overall cancer risk was increased by 34% and breast cancer risk by52% between Quintile 5 and Quintile1 of the FSA-NPS DI.Perception, understandingand use of FOP nutritionlabelsObjective understandingThe theoretical framework of theeffectiveness of FOP labels suggeststhat perception and understandingare key elements to their impact[30]. These prerequisite were assessed in participants in the Nu-184 Ernaehrungs Umschau international 12/2017triNet-Santé cohort study, usingself-administered questionnaires[31, 32]. Four formats were compared, each one corresponding to aspecific type of FOP label: n utrient-specific with numeric information (Guideline DailyAmount, GDA), n utrient-specific with colour-coded information (MultipleTraffic Light, MTL), endorsement scheme, which appear only on the more healthyproducts within a category (Tick,similar to the Danish Keyhole andthe Dutch Choices) and graded summary systems (5-CNL,the former graphical format for theNutri-Score).The 5-CNL was considered the easiest to identify and the most likelyto be found easy and quick to understand. GDAs were considered theleast easy label to identify, and theone entailing the heaviest cognitiveworkload [32]. A second comparative study on the perception of FOPlabels showed that the Nutri-Scorehad the highest support in the population (preferred format on a setof variables for 43% of the sample),
Copyright!Reproduction and dissemination – also partial – applicable to all media only withwritten permission of Umschau Zeitschriftenverlag GmbH, Wiesbaden.and more particularly in subjectswith low adherence to nutritionalrecommendations [33].Objective understanding was assessed by asking participants to ratethe nutritional quality of three products based on the information provided by the FOP system. Comparedto a control situation, all labels significantly increased the likelihoodof correctly ranking the products.Overall, the 5-CNL was the mosteffective label (64.6% of correct answers), followed by the MTL (56.4%),GDA (50.2%) and the Tick (29.4%)labels [32]. The odds of correctlyranking products with the 5-CNLcompared to a control situationwere particularly high for subjectsmore at risk of having unhealthydiets: subjects with low educationallevel increased the odds of correctlyranking products tenfold and subjects with no perceived nutritionknowledge twentyfold [31].Use in purchasing situationsThe use of the label on consumerpurchasing intentions was evaluated in several complementary studies. First, a randomized study withan experimental online supermarket comparatively assessed the impact of four types of labels (5-CNL,MTL, GDAs and Check) in the NutriNet-Santé study (n 11,981). Theoverall nutritional quality of theshopping cart was measured usingthe mean FSA score of the selecteditems, with a lower score indicatinga higher overall nutritional quality.As expected, the control situationwas associated with the lowest overall nutritional quality of the shopping cart (9.34 2.57). Among thevarious formats tested, the 5-CNLsignificantly led to the highest overall nutritional quality of the items inthe shopping cart (mean FSA score:8.72 2.75, -6.6%) followed byMTL (8.97 2.68, -4.0%) and Tick(8.99 2.71, -3.7%) compared withthe control situation [34]. Notably,no effect was observed in the number of purchased items, or the priceof the shopping cart.An experimental study in a physicalexperimental supermarket (n 901)found that the 5-CNL, associatedwith an explanatory leaflet, was associated with a higher nutritionalquality of purchased sweet biscuits.No significant effect was observed forbreakfast cereals or appetizers [35].Two studies using an experimental economy design found that theNutri-Score was associated to thehighest improvement in the nutritional quality of the shopping cart.The first study (n 255) comparedthe Nutri-Score to MTL, and Reference Intakes (RIs), while the second (n 809) compared it to theHealth Star Rating system, MTL,SENS (a graded-summary label,using four categories associatedwith recommended frequencies ofconsumption, which was proposedby retailers) and a modified versionof the Reference Intakes (mRIs) [36,37]. In both studies, the Nutri-Scoreperformed best at improving thenutritional quality of the purchaseditems. In the second study, the nutritional quality of the shoppingcart was improved by 9.3% for Nutri-Score, 6.6% for the Health StarRating System and 4.8% for MTL[37]. Moreover, the Nutri-Score performed best in households with thelowest income.Finally, a large scale trial was performed in 60 supermarkets, 10 for eachof four proposed labels (Nutri-Score,MTL, SENS and the mRIs) and 20controls. The first results showedthat the Nutri-Score was associatedwith the largest improvement in thenutritional quality of purchases, followed by MTL and SENS. Moreover,the Nutri-Score was associated withan improvement in all subgroups ofthe population (in particular subjectsbuying discount brands), while withother formats some subgroups deteriorated the nutritional quality oftheir purchases [38].tri-Score/5-CNL were validated in various complementary studies. Moreparticularly, the Nutri-Score/5-CNLappears to have a positive impact indisadvantaged populations, as shownin various subgroup analyses.The adoption of the Nutri-Score inFrance is voluntary, based on EU regulations. So far, three large retailersand three manufacturers have agreedin a voluntary commitment charter toimplement the Nutri-Score. In order toprevent manufacturers from selectingthe foods they would label, the charter stipulates the commitment is forall foods in the portfolio. Hopefully,this uptake by large companies willprompt other to follow suit.ConclusionBoth the nutrient profiling systemand the actual FOP format of the Nu-Ernaehrungs Umschau international 12/2017 185
Science & Research Original ContributionMD, PhD Chantal Julia1, 2, 3MD, PhD Serge Hercberg1, 2, 41 Université Paris 13, Equipe de Recherche enEpidémiologie Nutritionnelle (EREN), Centred’Epidemiologie et Biostatistiques SorbonneParis Cité (CRESS), Inserm U1153, InraU1125, Cnam, COMUE Sorbonne-Paris-Cité93017 Bobigny/France2 Département de Santé Publique, HôpitalAvicenne (AP-HP), 93017 .hercberg@eren.smbh.univ-paris13.frConflict of InterestThe authors declare no conflict of interest.AcknowledgmentsThe authors thank particularly EmmanuelleKesse-Guyot, Sandrine Péneau, PaulineDucrot, Mathilde Touvier, MathildeDonnenfeld, Solia Adriouch, LéopoldFézeu, Mélanie Deschasaux and CarolineMéjean for their continuous participation inthe studies conducted in EREN on the impactof Front-of-pack nutrition labels. The authorsare grateful to France Bellisle for her assistancein revising the final draft for publication.References1. Hughes R (2004) Competencies for effectivepublic health nutrition practice: a developingconsensus. Public Health Nutr 7: 683 6912. Lachat C, Van Camp J, De Henauw S et al.(2005) A concise overview of national nutritionaction plans in the European Union memberstates. Public Health Nutr 8: 266 2743. Liu PJ, Wisdom J, Roberto CA et al. (2014)Using behavioral economics to design moreeffective food policies to address obesity. ApplEcon Perspect Policy 36: 6 244. O rganization for Economic Co-operation andDevelopment. Promoting sustainable consumption – good practices in OECD countries.Paris, OECD (2008)5. Serra-Majem L (2009) Moving forward inpublic health nutrition the I World Congress of Public Health Nutrition Introduction. Nutr Rev 67: S2 S66. Hercberg S. Propositions pour un nouvel élande la politique nutritionnelle française de santépublique dans le cadre de la stratégie nationale de santé. 1ère partie : mesures concernantla prévention nutritionnelle. URL: http://solidarites-sante.gouv.fr/IMG/pdf/rapport Hercberg 15 11 2013.pdf Zugriff 27.11.177. Hawley KL, Roberto CA, Bragg MA et al.(2013) The science on front-of-package foodlabels. Public Health Nutr 16: 430 4398. Hersey JC, Wohlgenant KC, Arsenault JE et al.(2013) Effects of front-of-package and shelfnutrition labeling systems on consumers. NutrRev 71: 1 149. van Kleef E, Dagevos H (2015) The growing roleof front-of-pack nutrition profile labeling: aconsumer perspective on key issues and controversies. Crit Rev Food Sci Nutr 55: 291 30310. Chauliac M, Hercberg S (2012) Changing thefood environment: the French experience. AdvNutr 3: 605S 610S11. Hercberg S, Chat-Yung S, Chauliac M (2008)The French National Nutrition and HealthProgram: 2001-2006-2010. Int J PublicHealth 53: 68 7712. Touraine M. Projet de loi n 2302 relatif à laSanté, présenté au nom de M. Manuel Valls,Premier ministre. Exposé des motifs. (2014)URL : www.assemblee-nationale.fr/14/projets/pl2302.asp Zugriff 27.11.1713. Rayner M, Scarborough P, Boxer A, Stockley L. Nutrient profiles: development ofFinal model. Final Report. (2005). 330632f1eee108d831099ce3fe9d.pdf Zugriff 27.11.1714. Rayner M, Scarborough P, Stockley L. Nutrientprofiles: applicability of currently proposedmodel for uses in relation to promotion of foodsin children aged 5-10 and adults. (2005).URL: on/267952402 Nutrientprofiles Applicability of currently proposedmodel for uses in relation to promotionof food to children aged 5-10 and ged-5-10-and-adults.pdf?origin publication list Zugriff 27.11.1715. Rayner M, Scarborough P, Lobstein T. The UKOfcom Nutrient Profiling Model - defining‘healthy’ and ‘unhealthy’ food and drinks forTV advertising to children. (2009). URL: t-profile-model.pdf Zugriff 27.11.1716. Julia C, Kesse-Guyot E, Touvier M et al.(2014) Application of the British Food Standards Agency nutrient profiling system in aFrench food composition database. Br J Nutr112: 1699 170517. Julia C, Ducrot P, Peneau S et al. (2015) Dis-186 Ernaehrungs Umschau international 12/2017Copyright!Reproduction and dissemination – also partial – applicable to all media only withwritten permission of Umschau Zeitschriftenverlag GmbH, Wiesbaden.criminating nutritional quality of foods usingthe 5-color nutrition label in the French foodmarket: consistency with nutritional recommendations. Nutr J 14: 10018. ANSES. Evaluation de la faisabilité du calculd’un score nutritionnel tel qu’élaboré par Rayneret al. Rapport d’appui scientifique et technique.(2015). URL: www.anses.fr/fr/system/files/DER2014sa0099Ra.pdf Zugriff 27.11.1719. Haut Conseil de la Santé Publique. Information sur la qualité nutritionnelle des produitsalimentaires. HCSP, Paris. (2015). efr 519 Zugriff 27.11.1720. Julia C, Kesse-Guyot E, Ducrot P et al. (2015)Performance of a five category front-of-packlabelling system - the 5-colour nutrition label to differentiate nutritional quality of breakfastcereals in France. BMC Public Health 15: 17921. Julia C, Touvier M, Mejean C et al. (2014)Development and validation of an individualdietary index based on the British Food Standard Agency nutrient profiling system in aFrench context. J Nutr 144: 2009 201722. Julia C, Mejean C, Touvier M et al. (2016)Validation of the FSA nutrient profiling systemdietary index in French adults-findings fromSUVIMAX study. Eur J Nutr 55: 1901–191023. Deschamps V, Julia C, Salanave B et al.(2015) Score de qualité nutritionnelle des aliments de la Food Standards Agency appliquéaux consommations alimentaires individuellesdes adultes en France. Bulletin Epidémiologique Hebdomadaire 24–25 :466–47524. Adriouch S, Julia C, Kesse-Guyot E et al.(2016) Prospective association between a dietary quality index based on a nutrient profilingsystem and cardiovascular disease risk. Eur JPrev Cardiol 23: 1669–167625. Donnenfeld M, Julia C, Kesse-Guyot E et al.(2015) Prospective association between cancerrisk and an individual dietary index based onthe British Food Standards Agency NutrientProfiling System. Br J Nutr 114: 1702–171026. Julia C, Ducrot P, Lassale C et al. (2015) Prospective associations between a dietary indexbased on the British Food Standard Agency nutrient profiling system and 13-year weight gain inthe SU.VI.MAX cohort. Prev Med 81: 189 19427. Julia C, Mejean C, Vicari F et al. (2015) Public perception and characteristics related toacceptance of the sugar-sweetened beveragetaxation launched in France in 2012. PublicHealth Nutr 18: 2679 268828. Adriouch S, Julia C, Kesse-Guyot E et al.(2017) Association between a dietary quality index based on the food standard agency
Copyright!Reproduction and dissemination – also partial – applicable to all media only withwritten permission of Umschau Zeitschriftenverlag GmbH, Wiesbaden.nutrient profiling system and cardiovasculardisease risk among French adults. Int J Cardiol 234: 22 2729. Deschasaux M, Julia C, Kesse-Guyot E etal. (2017) Are self-reported unhealthy foodchoices associated with an increased risk ofbreast cancer: prospective study using theBritish Food Standards Agency Nutrient Profiling System. BMJ Open 7: e01371830. Grunert KG, Wills JM (2007) A review ofEuropean research on consumer response tonutrition information on food labels. J PublicHealth 15: 385 39931. Ducrot P, Mejean C, Julia C et al. (2015)Objective understanding of front-of-packagenutrition labels among nutritionally at-riskindividuals. Nutrients 7: 7106 712532. Ducrot P, Mejean C, Julia C et al. (2015) Effectiveness of front-of-pack nutrition labels inFrench adults: results from the NutriNet-Santecohort study. Plos One 10: e014089833. Julia C, Péneau S, Buscail C et al. (2017) Perception of different formats of front-of-pack nutrition labels according to sociodemographic, lifestyle and dietary factors in a French population:cross-sectional study among the NutriNet-Santécohort participants. BMJ Open 7: e01610834. Ducrot P, Julia C, Méjean C et al. (2016) Impactof different front-of-pack nutrition labels onconsumer purchasing intentions: a randomizedcontrolled trial. Am J Prev Med 50: 627–63635. Julia C, Blanchet O, Méjean C et al. (2016)Impact of the front-of-pack 5-colour nutritionlabel (5-CNL) on the nutritional quality ofpurchases: an experimental study. Int J BehavNutr Phys Act 13: 1 936. Crosetto O, Muller L, Ruffieux B (2016)Réponse des consommateurs à trois systèmesd’étiquetage nutritionelle face avant. Cahiersde Nutrition et de Diététique 51: 124–13137. Crosetto P, Lacroix A, Muller L et al. Mesureexpérimentale en laboratoire des impacts surla qualité nutritionnelle du panier alimentairefamilial de l’apposition de ‘Systèmes d’étiquetage nutritionnel’ en face avant des emballages. INRA GAEL, Grenoble (2017)38. Comité Scientifique de l’étude d’expérimentation. Evaluation ex ante de systèmes d’étiquetage nutritionnel graphique simplifié. Rapportfinal du comité scientifique. (2015). rt comite scientifique etiquetage nutritionnel 150317.pdf Zugriff 27.11.17DOI: 10.4455/eu.2017.048Ernaehrungs Umschau international 12/2017 187
in France. The French High Council of Public Health (HCSP) was com-missioned to precise thresholds defi-ning the 5 colours and to make the necessary adaptation of the FSA al-gorithm for cheese, added fats and beverages [19], defining the final contours of the Nutri-Score/5-CNL for France. The final thresholds of the Nutri-Score were set in order to