Transcription
OECD Journal: Financial Market TrendsVolume 2016/1 OECD 2016Analytical tools for the insurancemarket and macro-prudentialsurveillancebyW. Jean Kwon and Leigh Wolfrom*This article provides an overview of the analytical tools used by insuranceregulators and supervisors for the purposes of market and macro-prudentialsurveillance. It is largely based on responses from 24 OECD and non-OECDcountries to a questionnaire on the use and relative importance of a set of commonindicators and analytical tools that provide information on the soundness,performance and competitiveness of the insurance market. The article thereforeprovides a point of reference on the use of analytical tools for market surveillanceand is intended to inform the further development of the OECD Global InsuranceStatistics framework.JEL classification: G22, G28, G32, G38.Keywords: Insurance market surveillance, insurance supervision, insuranceregulation, insurance statistics.* W. Jean Kwon, Ph.D., CPCU is the Edwin A.G. Manton Chair Professor in International Insurance andRisk Management and Director of the Center for the Study of Insurance Regulation School of RiskManagement, Insurance and Actuarial Science, St. John’s University. Leigh Wolfrom is a PolicyAnalyst in the OECD Directorate of Financial and Enterprise Affairs. This report was presented anddiscussed at the June 2016 meetings of the OECD Insurance and Private Pensions Committee (IPPC)and benefitted from comments by delegates. The authors are solely responsible for any remainingerrors. This work is published on the responsibility of the Secretary-General of the OECD. Theopinions expressed and arguments employed herein do not necessarily reflect the official views ofthe OECD or of the governments of its member countries or those of the European Union. Thisdocument and any map included herein are without prejudice to the status of or sovereignty overany territory, to the delimitation of international frontiers and boundaries and to the name of anyterritory, city or area.1
ANALYTICAL TOOLS FOR THE INSURANCE MARKET AND MACRO-PRUDENTIAL SURVEILLANCEIntroductionInsurance plays a critical role in supporting economic activity, and a sound insurancemechanism makes a critical contribution to the sustainability and growth of the nationaleconomy. Few individuals and entities can effectively protect their property ownership andother economic rights without relying on insurance. Insurance companies are alsosignificant institutional investors, playing a critical role in providing financing to the realeconomy through investments in bonds, stocks and other assets.Complexity in contract, sophistication in product design, mass consumption ofinsurance coverages and the need to ensure proper market conduct for the benefit ofindividuals and businesses reliant on insurance protection provide the basis of publicintervention in the form of supervision and regulation of insurance companies – for thepurpose of protecting policyholders and ensuring that insurance companies are sound andable to contribute to financial stability and benefit the real economy. A key requirement foreffective regulation and supervision is the authority’s ability to collect and analyse data inthe insurance market.This study, launched by the OECD’s Insurance and Private Pensions Committee (IPPC),provides a stocktaking and review of analytical tools and other indicators used ininsurance regulation and supervision, as well as for the purposes of policymaking for theinsurance sector. It is aimed at sharing experience and best practices across countries onthe use of analytical tools for monitoring the performance and stability of the insurancesector and, where relevant, providing a basis for expanding the OECD’s Global InsuranceStatistics framework.Use of the analytical tools examined in this report is not anything new to insuranceregulatory authorities around the world. Insurance authorities make use of a diverse set oftools for the analysis of insurance markets or insurance companies in their domesticmarkets. The set of analytical tools each of them employs reflects the specific countrycontext in terms of the level of development of the domestic insurance market, the numberof operating companies as well as other factors. The aim of this report is to identify bestpractices internationally in terms of the use of indicators and analytical tools formonitoring the insurance sector. Particularly, it examines the analytical tools thatauthorities employ for regulation and supervision of insurance markets. This report isintended also to support the development and revision of analytical tools in OECD andnon-member countries, highlight data sources and needs, and contribute to theidentification of data gaps that could be addressed not only by adjustments to OECD’sGlobal Insurance Statistics (GIS) exercise but also by complementary public and private datacollection efforts – with the ultimate objective of providing a consistent and comparable setof useful indicators of insurance market performance and risks.The OECD has been collecting insurance statistics for almost two decades, with dataon the insurance sector dating back to the early 1980s. In response to the financial crisis,the GIS was launched as part of the OECD’s insurance market monitoring activities. The2OECD JOURNAL: FINANCIAL MARKET TRENDS – VOLUME 2016/1 OECD 2016
ANALYTICAL TOOLS FOR THE INSURANCE MARKET AND MACRO-PRUDENTIAL SURVEILLANCEGIS provide an increasingly valuable cross-country source of comparable data andinformation on insurance sector developments for use by governmental and supervisoryauthorities, central banks, the insurance sector and broader financial industry, consumersand the research community. It covers the insurance sectors in OECD countries as well asa number of non-OECD Latin American countries (achieved through co-operation with theAssociation of Latin American Insurers (ASSAL)), a number of non-OECD countries inAsia as well as South Africa. The data is available at OECD StatExtracts (online, under“Finance” “Insurance Statistics”) and OECD Insurance Statistics (annual).1 It also publishesGlobal Insurance Market Trends (annual), which is available as a stand-alone version as wellas a section of OECD Insurance Statistics.Table 1 lists the key insurance data and performance indicators included in theOECD StatExtracts and Insurance Statistics. The data and indicators are unique in two broadaspects: The OECD collects data on the number of insurance undertakings and employees, grossand net premiums written for domestic and foreign risks and written abroad bybranches, claims paid and provisions, commissions, investments by asset class,shareholder equity and net investment income and available and minimum solvencycapital. This data is unique and no other international organisation is known to collectcomparable data. The OECD can calculate several performance indicators at the macro-level, a uniquefeature found in this database only. They include foreign insurers’ market share in thedomestic market, premiums per employee, the ratio of reinsurance accepted and theretention ratio, amongst others.Table 1. OECD Insurance Statistics: Data and performance indicators collectedCategoryRatioData (for domestic,foreign-controlledand branches and agenciesof direct insurersand reinsurers) Performance Indicators Number of insurance undertakingsNumber of insurance employees Insurance companies (full- and part-time staff) Intermediaries (brokers and agents and their staff) but excluding those who are not directly involvedin the insurance industry (e.g. solicitors) Gross and net premiums written (life, non-life, composite and by class of life and non-life) for domesticand foreign risks and business written abroad Gross claims paid (on direct business and reinsurance accepted) and outstanding claims provisions Gross technical provisions Gross operating expenses Commissions (on direct business and reinsurance accepted) Investments by asset class (life, non-life, composite, direct and reinsurers) and net investment income Available and minimum solvency capital Shareholder equity and net income Premiums (volume and growth), premiums per employee, insurance density and penetrationLife and non-life insurance share of the total insurance marketCountry’s market share in the OECDForeign insurers’ market share in the domestic marketBalance sheet and incomePortfolio allocationRatio of reinsurance acceptedRetention ratio (net written premiums /gross premiums written)Loss ratio, expense ratio and combined ratio (non-life)OECD JOURNAL: FINANCIAL MARKET TRENDS – VOLUME 2016/1 OECD 20163
ANALYTICAL TOOLS FOR THE INSURANCE MARKET AND MACRO-PRUDENTIAL SURVEILLANCEThere are other sources of international data on the insurance sector. The InternationalAssociation of Insurance Supervisors (IAIS), the international standard-setting body forinsurance supervision, gathers insurance data for use internally and by member countriesvia its Insurance Law Database (discontinued in 2009) and Reinsurers Database exercises.2 Thereinsurance database contains information about reinsurance premiums assumed andceded by type (i.e. proportional and non-proportional), by market and by line for the non-lifesector (property, liability and financial). In 2012, the IAIS began publishing a Global InsuranceMarket Report based on publicly available data as well as confidential data submitted to IAIS.3The report discusses the global (re)insurance industry from a supervisory perspective,focusing on the recent performance of the sector as well as key risks. No market or countryspecific information is available in this report.4 The International Monetary Fund (IMF) offersinsurance industry data under the Financial Access Survey (FAS) via its eLibrary. The datacovers mainly the number of insurance institutions, number of policies and technicalprovisions by market – life and non-life. For European countries, Eurostat maintains adataset covering the number of insurance enterprises, the number of employees, grosspremiums and gross claims by market (life, non-life, composite and reinsurance) for all EUmember countries (but not necessarily for all markets or all data years). Eurostat alsoprovides statistics on, inter alia, international transactions in insurance services (exports,imports and balance). The European Central Bank maintains financial statement data bycountry as well as a summary covering indicators of large EU insurance groups at the EU levelin the Statistical Data Warehouse. The indicators include: i) gross written premiums andsolvency ratios (life insurance); ii) gross premiums written, net combined ratios and solvencyratios (non-life insurance); and iii) retention ratios, return on equity and the number ofsample institutions (total).The discussion in this report is based also on the key findings from the responses to asurvey – developed by the OECD in consultation with the IAIS – that was conducted in 2015and 2016. A total of 24 responses were received, comprising eighteen responses fromOECD countries (Australia, Austria, Canada, Chile, Estonia, Germany, Iceland, Italy, Japan,Korea, Latvia, Luxembourg, Portugal, Slovakia, Spain, Switzerland, Turkey and theUnited States) and six responses from non-OECD economies (Colombia; Costa Rica;Hong Kong, China; Peru; Russia and Singapore).The structure of this report is as follows. In the following section, an overview of theanalytical tools that public authorities, particularly insurance regulatory authorities, usefor supervisory/market and macro-prudential surveillance purposes as well as theimportance of each of these tools for these purposes is provided. The indicators andanalytical tools discussed in the report have been identified based on an academicliterature review as well as the analytical measures and financial ratios that selectedinternational organisations and insurance regulatory authorities use (e.g. OECD, IAIS,National Association of Insurance Commissioners [NAIC] and European Insurance andOccupational Pensions Authority [EIOPA]), both those that are in common use andemerging indicators and analytical tools. The report concludes with a summary of keyfindings and potential implications for the OECD GIS exercise.4OECD JOURNAL: FINANCIAL MARKET TRENDS – VOLUME 2016/1 OECD 2016
ANALYTICAL TOOLS FOR THE INSURANCE MARKET AND MACRO-PRUDENTIAL SURVEILLANCEAnalytical Tools in Insurance MarketsThis section provides an overview of the analytical tools in the insurance industry,including the objectives that regulatory authorities as well as other interested parties hopeto achieve with these tools. An explanation and evaluation of the types of indicators andanalytical tools that have been developed – or are under development – for monitoring ofindustry performance and risk is also provided.The discussion throughout this section embeds the findings from the responses to anOECD survey. The survey sought information on the use of analytical tools, includingperiodic reviews and stress testing and financial market indicators, in the surveillance ofinsurance markets and individual insurance company performance and risks in therespondent countries as well as on any data gaps related to specific indicators and tools.The survey comprised four main sections: i) indicators related to the monitoring of thedepth and competitiveness of domestic insurance markets; ii) financial indicators andratios that may be used to monitor various components of the insurance business;iii) common market indicators of insurance company performance and risk; andiv) analytical tools used to monitor insurance market risks, including potential systemicrisks. Each section consisted of questions about the use and relative value of a set ofcommonly-used (and emerging) analytical tools and indicators, from the perspective ofmarket and macro-prudential surveillance as well as the relative value of including thegiven indicator in future OECD reports on Global Insurance Market Trends, where: Supervisory and/or market surveillance refers to the monitoring of performance and risksamong specific firms and/or groups of firms for the purposes of identifying potentialidiosyncratic risks to the financial soundness of individual firms or groups of firms. Macro-prudential surveillance refers to the monitoring of performance and risks acrossthe sector for the purposes of identifying potential systemic risks to the broaderfinancial system.In providing a rating of the relative value of a given indicator for surveillance purposes,the respondents were asked to select one of the following four categories: “Very high” indicating that the indicator is monitored regularly and considered a crucialindicator for surveillance purposes on a continuous basis. “High” indicating that the indicator is often monitored and considered an importantindicator for surveillance purposes under certain market conditions. “Low” indicating that the indicator is monitored occasionally and considered of potentialvalue under some market conditions. “Very low” indicating that the indicator is rarely monitored.Table 2. List of Indicators in the 2015-16 OECD SurveySectionIndicatorsInsurance Market Indicators Insurance penetration ratioInsurance density ratioHerfindahl indexMarket concentrationForeign insurance companies’ share of the domestic marketCommissions/premiumsOECD JOURNAL: FINANCIAL MARKET TRENDS – VOLUME 2016/1 OECD 20165
ANALYTICAL TOOLS FOR THE INSURANCE MARKET AND MACRO-PRUDENTIAL SURVEILLANCETable 2. List of Indicators in the 2015-16 OECD Survey (cont.)SectionIndicatorsInsurance Business Performanceand RiskProfitability and Income Generation Return on shareholders’ surplus Return on revenue Return on premiums Return on assets Dividends/net income Operating ratio (non-life)Adequacy of Capital/Provisions and Leverage Premiums/shareholders’ surplus Gross technical provisions/shareholders’ surplus Gross technical provisions/premiums Indicators of deficiency in gross technical provisions Indicators of leverage related to liabilities Indicators of leverage related to funding structureLiquidity Indicators related to cash flow liquidity Indicators related to liquidity of assets Indicators related to funding liquidity Liquidity coverage ratios Indicators related to the level of policy surrenders Indicators related to asset-liability matchingUnderwriting Performance and Risk Net underwriting income Claims (benefits) ratio Underwriting expense ratio Combined ratio (non-life) Indicators related to concentration in certain classes of insurance Indicators related to premium growth in certain classes of insurance and/or sectors Indicators related to the share of business in non-traditional non-insurance activitiesInvestment Performance and Risk Investment returns Investment yield Investment expense ratio Net investment income ratio Indicators related to changes in asset mix Indicators related to counterparty/investment concentration Indicators related to level of investment in riskier assets Indicators related to adequacy of investment income for meeting policyholder obligationsReinsurance Performance and Risk Premium cession Reinsurance commissions/shareholders’ surplus Claims paid by reinsurers/total claims Reinsurance assets/total assets Reinsurance recoverables/shareholders’ surplus Overall reinsurance result Indicators of counterparty risk related to cession of premiums to reinsurersFinancial Market Indicators Insurance Market RiskCredit default spreads10-year swap rateInsurance company stock price levelInsurance company stock price volatilityInsurance company price-to-book ratioInsurance company price-to-earnings ratioInsurance company credit ratings and/or outlookPeriodic reviews of market riskKey indicators of market risk Indicators related to interconnectedness Indicators related to changes in asset allocation Indicators used in stress testing Economic activity Inflation/interest rates Housing market activity Financial market performance Banking sector risks Insurance risks Reinsurance market risks 6OECD JOURNAL: FINANCIAL MARKET TRENDS – VOLUME 2016/1 OECD 2016
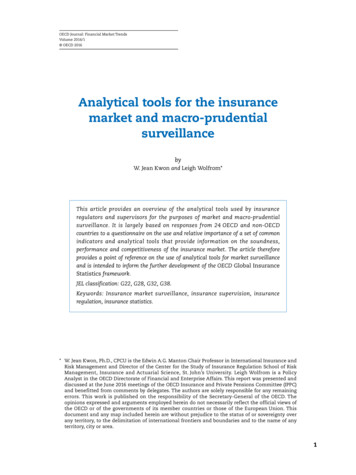
ANALYTICAL TOOLS FOR THE INSURANCE MARKET AND MACRO-PRUDENTIAL SURVEILLANCEInsurance Market IndicatorsThis section discusses common analytical tools and indicators that can be used asindicators of the depth and competitiveness of the insurance industry, including for threemain policy areas: i) the importance of the insurance sector in the economy (or,alternatively, the overall level of insurance coverage); ii) the level of competition, includingfrom foreign-owned insurance companies; and iii) the relative importance of brokers andagents in the distribution of insurance products.These indicators may be used as part of regular market monitoring or for policyanalysis and development. For example, in Canada, the Department of Finance usesindicators related to insurance market structure for policy analysis and development. InAustralia, the Australian Prudential Regulatory Authority (APRA) uses some of theseindicators for market monitoring while the Australian Competition and ConsumerCommission (ACCC) and the Australian Securities and Investments Commission (ASIC)may use them for policymaking purposes. In Chile, these types of indicators are usedfor internal reporting within the supervisory agency to monitor the depth andcompetitiveness of the insurance market.Countries were asked to rate the relative value of each of these indicators from apolicymaking perspective and to provide any other examples of commonly-used indicatorsfor these issues. Figure 1 provides the average rating for each of these indicators.Figure 1. Rating of the policy-making value of insurance market indicatorsAverage ratingVery highHighLowVery n participationCommissionsNote: The average rating was calculated based on countries’ responses to the survey. Only ratings provided by countriesthat use the given indicator were included. For the purposes of calculating the average rating of policy-making value,the following numeration was applied: 0: Very low; 1: Low; 2: High; 3: Very high.Indicators related to the importance of the insurance sectorThere are two commonly-used indicators of the importance of insurance in thenational economy (or alternatively, the level of insurance protection) – insurance densityand insurance penetration. Insurance penetration is calculated as the ratio of totalinsurance premiums – or premiums at the market level – to the country’s GDP. It can bemeasured using life premiums, non-life premiums or premiums written/earned in specificclasses of business and can therefore provide an overall indicator of the level of insurancecoverage by type of insurance as well as the growth potential of the insurance market of acountry – particularly when compared to penetration ratios in other countries. InsuranceOECD JOURNAL: FINANCIAL MARKET TRENDS – VOLUME 2016/1 OECD 20167
ANALYTICAL TOOLS FOR THE INSURANCE MARKET AND MACRO-PRUDENTIAL SURVEILLANCEpenetration offers some insight but should not be used alone to draw conclusions.Examination of insurance penetration during a multiple-year period can also be done usinga compound annual growth rate approach. Similarly, insurance density is calculated as theratio of total insurance premiums to total population and can be used as a proxy for percapita consumption of insurance. It becomes internationally comparable when calculatedusing a common hard currency although any use of the indicator over time should bebased on local currency in order to avoid large changes related to exchange ratefluctuations. One needs to be careful in interpreting the ratio because it merely assumesthat every citizen of the country, regardless of age or working status, consumes insuranceand that only citizens, thus not entities, consume insurance coverage.The responses in the aggregate suggest that regulatory authorities use both insurancepenetration and density ratio information to assess the importance of the insuranceindustry in their domestic economies as well as the maturity of the industry relative to theindustries in other countries. Countries appear to place more importance on thepenetration ratio over the density ratio as ten countries indicated that the density ratio hadlow or very-low value in terms of relevance for policy-making. A number of countries alsomonitor other elements related to the depth of insurance markets, such as the relativemarket share of non-life and life sectors and/or specific business lines. In theUnited States, the market share of surplus lines5 is also monitored. In Russia, the ratio ofinsurance reserves to GDP is used as an indicator of the depth of insurance markets. TheUnited States also monitors overall market growth over a 3-5 year period.While not covered in the survey, another potentially useful indicator is premium perinsurance industry employee (i.e. the ratio of gross (or direct) premiums written to thenumber of employees in the insurance industry).6 With the ratio information, a proxymeasure on human capital productivity in the insurance industry can be calculated.However, there is no known standard in employee classification (e.g. counting part-time/seasonal workers and staff employed by insurance companies vs. those by intermediaries).Accordingly, use of the ratio is limited and interpretation of the ratio information should bedone with care.Indicators related to competition in the insurance sectorThere are a number of indicators related to the structure of the insurance industry thatcan provide some perspective on whether there may be impediments to competition in thesector, such as excessive market concentration or limited foreign participation in the market: 8The Market Concentration Ratio (Companies) is a measure of the percentage of marketshare controlled by a given number of the largest companies in the domestic industry aswell as by market or by line of business. It is a simple sum of their market shares, wherethe number of companies for the calculation may vary depending on the study objectiveor the total number of companies in the industry. The number often ranges from threeto ten although countries use different approaches (e.g. BaFin [Germany] monitors thelargest 15 companies; Finma [Switzerland] looks at the largest 5; EIOPA collects andpublishes data on concentration in the largest 3, 5 and 10 companies for certain lines ofbusiness). A lower concentration ratio generally means a higher level of competition inthe market or the country, ceteris paribus. Conversely, a high ratio implies the possiblepresence of monopolistic competition or oligopoly (a ratio of 100 means full control ofthe market by the largest companies or the market is probably not privatised). Insuranceauthorities may find the ratio useful as an indicator of potential pricing control by aOECD JOURNAL: FINANCIAL MARKET TRENDS – VOLUME 2016/1 OECD 2016
ANALYTICAL TOOLS FOR THE INSURANCE MARKET AND MACRO-PRUDENTIAL SURVEILLANCEsmall number of large insurance companies. Results from market concentration analysiscan be used to check, albeit crudely, if there is a possibility of oligopolistic competition inthe insurance market, for example, when a 3-firm ratio is extremely high. The Herfindahl Index is calculated as the sum of the square of the market shares of allinsurance companies in the market.7 The ratios range, in theory, from zero (perfectcompetition) to 10 000 (monopoly). Interpretation of the index score is somewhatsubjective, although a score ranging between 1 000 and 2 000 is usually perceived toreflect a relatively competitive market environment. The Market Share of Foreign-Owned Insurance Entities can be calculated as the ratio ofthe sum of premiums written by foreign-owned insurance entities to total premiumswritten, where foreign-owned entities are broadly defined as locally operating insurancecompanies – including branches – whose parents were incorporated in a foreign country orjurisdiction. The ratio may be useful for measuring, for instance, the speed of marketliberalisation over time when a market is newly open to foreign insurance entities. It canalso be used to investigate whether a market remains attractive to foreign entities.However, depending on the definition of “foreign-owned”, the ratio may not reflect thepremium share owned by joint ventures and/or other domestic insurance companies withsignificant foreign ownership. For example, some countries use a threshold of 10% forsignificant foreign ownership while in others (e.g. Latvia) the threshold may be as highas 50%. Care needs to be taken in making any suggestions based simply on this ratio,particularly given the difficulty in defining a foreign-owned company. The usefulness ofthis ratio is also reduced where there is significant cross-border insurance trade (such asunder the European Single Market for insurance services). The indicator may also be moreimportant in markets where a relatively strong presence of foreign insurance companiesis necessary to maintain or enhance market capacity (in many countries, sufficientcapacity and competition is generated through local insurance companies).Among the indicators related to insurance market competition, the marketconcentration ratio is the most used (and most valued) across countries (eighteen of thetwenty-four respondent countries rated this indicator as having a high or very high-valuefor policymaking). The Herfindahl index was rated as being highly relevant in elevencountries and three countries indicated that it had a very high value for the purposes ofpolicymaking. The market share of foreign insurers’ was rated as highly or very highlyrelevant in fourteen countries although only one country (Chile) rated it as very high interms of policy relevance. Some countries identified additional indicators that could beused to monitor market concentration and competitiveness. Portugal uses a Gini-type8calculation of market concentration and also looks at the concentration of premiumswithin specific insurance groups (which may contain a number of life and/or non-lifesubsidiaries). In the United States, the number of insurance market entries and exits isused to provide additional data on market structure. Data on average premium rates inspecific segments (which may provide an indicator of the level of competition) is alsocollected and published regularly in the United States.Importance of brokers and agents in the distribution of insurance productsThe commissions-to-premiums ratio provides information on the relativeimportance of brokers and agents in the distribution of insurance products (relative todirect sales by insurance companies themselves). Findings from an analysis of thecommissions-to-premium ratio may offer some insight about the significance ofOECD JOURNAL: FINANCIAL MARKET TRENDS – VOLUME 2016/1 OECD 20169
ANALYTICAL TOOLS FOR THE INSURANCE MARKET AND MACRO-PRUDENTIAL SURVEILLANCEinsurer-controlled policy acquisition expenses on pricing as well as the efficiency ofintermediary-based insurance distribution channels. The indicator is used and consideredvaluable in sixteen of the twenty-four respondent countries and was rated as veryhigh-value in four countries (Hong Kong, China; Italy; Peru and Spain). In a number ofcountries, this ratio is collected as a means to monitor expense ratios (net commissions/net premium written) at individual companies.Insurance Business Performance and RiskUnderstanding the performance of individual insurance companies and the risks thatthey face is the core objective for a prudential regulator of insurance companies and allinsurance regulators have established standardised analytical tools to measure theperformance of individual insurance companies and the ma
practices internationally in terms of the use of indicators and analytical tools for monitoring the insurance sector. Particularly, it examines the analytical tools that authorities employ for regulation and supervision of insurance markets. This report is intended also to support the development and revision of analytical tools in OECD and