Transcription
2016 Startup Index of Nations, Cities:(Startups Worth 1 Billion Or More: “Unicorns”)Gerard J. TellisCenter for Global InnovationUSC Marshall School of BusinessGerard J. Tellis (PhD Michigan) is Professor of Marketing, Management and Organization, NeelyChair of American Enterprise, and Director of the Center for Global Innovation, at the USCMarshall School of Business. Dr. Tellis is an expert in innovation, advertising, social media,pricing, new product growth, and global market entry. He has published 5 books and over 100papers (http://www.gtellis.net ) that have won over 20 awards. His Google Scholar cites are over14,000.Thanks to Selin Erguncu (Visiting Scholar) and Raghuvardhan Suram (Graduate Student)for research assistance.1
RationaleInnovation is critical for the welfare of consumers, the success of firms, and the wealth ofnations. Radical innovations have led some startups and new entrants to disrupt giantincumbents, transform markets, and bring enormous wealth to individuals, firms, regions,and nations. Examples include Uber, Facebook, Amazon, and Apple. As a result, somestartups have reached billion dollar valuations in short period of time and earned the title ofUnicorns. Unicorn is a term used in the investment industry to indicate startups valued at 1billion or higher. This report presents rankings of countries and regions based on shares interms of numbers and valuations of unicorns headquartered in those countries or regions.MethodThis study created a unique list of unicorns over the last 24 months (2014-2015). Companyvaluations were identified from at least two independent sources. The primary sources areCB Insights (The Unicorn List) and Wall Street Journal (The Billion Dollar Startup Club).Startups that are missing in either list were verified from other sources, such as Zephyr,SDC Platinum, and news reports. If two sources indicate different valuations for a givenstartup, the valuation was further verified from other sources. If the discrepancy invaluation between two sources cannot be resolved from additional sources, then theaverage of the amounts reported by two sources was used. This list was created for eachmonth of a 24-month period ranging from January 2014 to December 2015.Startups can drop out from the list either by going public (IPO), being acquired byanother company, or dropping in valuation. Such companies appear in the list from themonth they have been a unicorn, until the month on which they drop out. Because of shortterm fluctuations in valuation, the study uses averages of monthly valuations to create theindex. For this purpose, regions and countries are ranked on a monthly basis. The finalrankings are then the average of monthly rankings.Regions were identified on a 50-miles rule. This rule clusters cities within a 50-miledistance as belonging to one region. For example, San Francisco, San Jose, and citiesbetween them are clustered as “Silicon Valley”; Shenzhen and Hong Kong are clustered as2
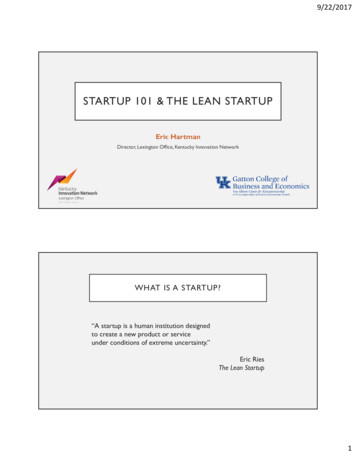
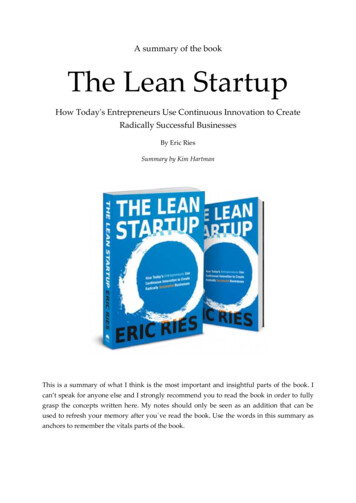
a single region “Shenzhen/Hong Kong”; Anaheim and Los Angeles are grouped togetherunder the name “Los Angeles”. Population and GDP of regions are from Wikipedia for themetropolitan areas (not for the urban or city populations). Similarly, country population andGDP values are from Wikipedia.FindingsThe main findings are as follows.1. The study identifies 18 countries and 40 regions having at least one unicorn, forat least one month, during the two-year observation period.2. Results reveal that the US tops the list in generating billion dollar startups with a65% share. China (14%) comes second, and India (4%), third. 11 countries (UnitedKingdom 3%, Singapore 2%, Sweden 2%, Germany 2%, Canada 1.6%, South Korea 1.5%,Russia 1% and Czech Republic 1%) are listed above the threshold, having at least 1% shareof all unicorns in terms of total population of unicorns. The threshold countries (having anaverage share of less than 1%, based on the valuation) include Israel, Australia,Netherlands, Brazil, Luxembourg, France and Taiwan. Some traditional economic powerssuch as Japan and Italy are absent from the ranking. Figure 1 displays the top countriesranked by the shares of unicorns, covering almost 97% of the total unicorn population overthe observation period.3
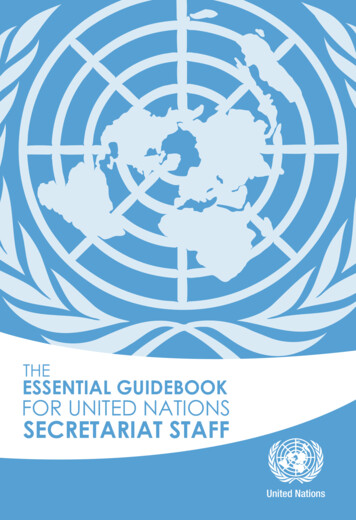
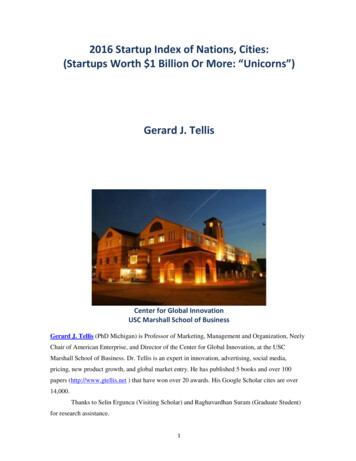
United States65%China14%India4%United Kingdom3%Singapore2%Sweden2%Germany2%Canada2%South Korea1%Russia1%Czech Republic1%Figure 1: Top Countries Ranked by Shares of Unicorn Population3. As shown in Figure 2, twenty-three regions have at least 1% share of the totalnumber of unicorns and only seven of those regions are in the US. That said, US has almostfive times the unicorn population of the next closest country, China. US-based unicorns arehighly clustered in certain regions. Indeed, within the US, unicorns, have a cluster pattern inSilicon Valley (39% of all unicorns) followed by New York (9%), Los Angeles (5%),Boston (4%), Provo (2%), Chicago (1%) and Jacksonville (1%). Other regions in thenumber-based ranking are: Beijing (6%), Shanghai (3%), London (2%), Singapore (2%),Stockholm (2%), Berlin (2%), Hangzhou (2%), New Delhi (1.7%), Seoul (1.5%),Shenzhen/Hong Kong (1.4%), Mumbai (1.4%), Guangzhou (1.1%), Bangalore (1.1%),Moscow (1%) and Prague (1%).4
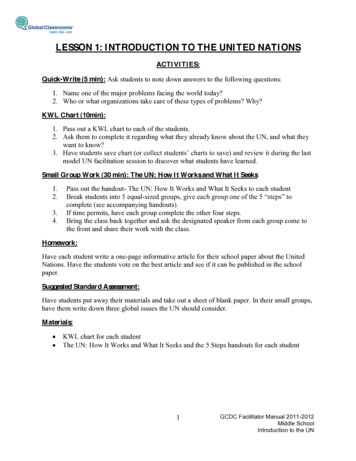
Silicon ValleyNew YorkBeijingLos , UTBerlinHangzhouNew DelhiSeoulShenzhen/Hong KongMumbaiGuangzhouChicagoJacksonville, 1%1%1%1%1%1%1%1%1%Figure 2: Top Regions Ranked by Shares of Unicorn Population4. Seven countries in the ranking and the US and China together cover 85% of thetotal unicorn valuation. In particular, US again tops the list with 63% of the total valuationof unicorns. It is followed by China (22%) and India (5%). Sweden (2%) rises to the fourthplace and Germany (1.5%) rise to the fifth, up from sixth and seventh in the number-basedrankings, respectively. Singapore (1.2%) and United Kingdom (1.1%) complete thevaluation-based rankings of unicorns. Canada, South Korea, Russia and Czech Republicdrop off the rankings, appearing among the threshold countries in the valuation-basedanalysis.5
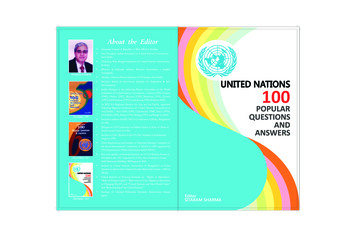
United 1%United Kingdom1%Figure 3: Top Countries Ranked by Share of Unicorn Valuation5. Silicon Valley is at the top of the rankings with 45% of the total unicorn valuationacross the globe over two years. Coming in second is Beijing (15%), followed by LosAngeles (8%), New York (5%), Bangalore (3%), Shanghai (3%), Stockholm (2%) andBoston (2%). While five of the top unicorn regions in the world are in the US, the rest ofthe world has several entries. Shenzhen/Hong Kong (2%), Berlin (2%), Singapore (1.2%),London (1.1%), Jacksonville (1%) and New Delhi (1%) round out the ranking. The studyidentifies 25 threshold regions, having smaller than 1% share in the total valuation ofunicorns: Sydney, Tel Aviv, Provo, Ogden, Seoul, Vancouver, Mumbai, Ottawa,Hangzhou, Jerusalem, Moscow, Seattle, Washington, San Diego, Sao Paolo, Dania,Chongqing, Guangzhou, Paris, Chicago, Atlanta, Luxembourg, Waterloo, Prague, Taichungand Amsterdam.6
Silicon Valley45%Beijing15%Los Angeles8%New zhen/Hong Kong2%Berlin2%Singapore1%London1%Jacksonville, FL1%New Delhi1%Figure 4: Top Regions Ranked by Share of Unicorn Valuation6. Censored regression analysis indicates that, while size is important, it explainsonly only 24% and 12% for the index of numbers and 26% and 11% of the variance for theindex of valuation, for countries and regions, respectively. Examples of small countries andregions doing well are Sweden (Stockholm), Israel, and Singapore. Besides size, economicand cultural factors may play an important role. Candidate variables in explaining thenumbers as well as valuations of unicorns in a region/country might be ease of starting anew business, ease of starting a competing enterprise, openness to new ideas, and welcometo new immigrants in those regions/countries.7
USACHNINDUKCANDEURUSPRKBRAFRAR² 0.24TZA IRNBGD PAKPOL KEN UKR COL THA COG ETH JPNDZAVNMPHL MEXIRQ ZAF SDN ITANGATUREGYMMRARG ESPIDNFigure 5: Large Countries Plotted by Unicorns and Population (Top 37 countries inpopulation; x-axis: log of population; y-axis: log of total number of eshBrazilCanadaChinaColombiaCongoCzech esPolandRussiaSaudi ArabiaTable 1: Country PHLPOLRUSSAUCountriesSingaporeSouth AfricaSouth landTurkeyUkraineUnited KingdomUnited ATURUKRGBRUSAVNM
Silicon ValleyNew YorkBeijingBostonProvo, UTOgden, UTLuxembourgLos ngalore Shenzhen/HongJacksonville, FLSydneyPragueGuangzhouKongOttawa Vancouver San DiagoChicagoMoscowTel Aviv Dania, FLSao looWashington, DCAtlantaLondonParisChongqingTaichungFigure 6: Regions Plotted by Unicorns and Population (Regions with at least oneunicorn; x-axis: log of population; y-axis: log of total number of unicorns; bubblesizes: total valuation of unicorns)9
USACHIINDSWEUKAUSPRKDEUR² 0.26RUSCANBRANLDFRACHESAUIDNMEX ESPITAJPNTURFigure 7: Large Countries Plotted by Valuation of Unicorns and GDP (Top 21Countries by GDP; x-axis: log of GDP; y-axis: log of total valuation of unicorns)10
Silicon ValleyBeijingLos AngelesNew YorkBangaloreProvo, UTPragueOgden, ndonNew Delhi SingaporeJacksonville, FLSydneyMumbaiSeoulHangzhouMoscowDania, FLLuxembourgSan Diago GuangzhouChicagoAmsterdamVancouverTel AvivJerusalemWaterlooChongqingOttawaSeattle Washington DCParisAtlantaSao PauloTaichungFigure 8: Large Countries Plotted by Valuation of Unicorns and GDP(Regions with at least one unicorn; x-axis: log of GDP; y-axis: log of totalvaluation of unicorns; bubble sizes: total number of unicorns)11
CB Insights (The Unicorn List) and Wall Street Journal (The Billion Dollar Startup Club). Startups that are missing in either list were verified from other sources, such as Zephyr, SDC Platinum, and news reports. If two sources indicate different valuations for a given startup