Transcription
Radiocarbon, Vol 62, Nr 4, 2020, p 1045–1078DOI:10.1017/RDC.2020.77 Crown Copyright. Published by Cambridge University Press on behalf of the University of Arizona.This is an Open Access article, distributed under the terms of the Creative Commons Attribution /), which permits unrestricted re-use, distribution, andreproduction in any medium, provided the original work is properly cited.INTCAL20 TREE RINGS: AN ARCHAEOLOGICAL SWOT ANALYSISAlex Bayliss1,2* Peter Marshall1 Michael W Dee3Timothy J Heaton5 Lukas Wacker6 Michael Friedrich4 1Historic England, 25 Dowgate Hill, London, EC4R 2YA, UKBiological & Environmental Sciences, University of Stirling, Stirling, FK9 4LA, UK3Centre for Isotope Research, University of Groningen, Nijenborgh 6, 9747 AG Groningen, The Netherlands4University of Hohenheim, Hohenheim Gardens (772), D-70599 Stuttgart, Germany5School of Mathematics and Statistics, University of Sheffield, Sheffield S3 7RH, UK6Laboratory of Ion Beam Physics, ETH Zürich, Otto-Stern-Weg 5, 8093 Zürich, Switzerland2ABSTRACT. We undertook a strengths, weaknesses, opportunities, and threats (SWOT) analysis of NorthernHemisphere tree-ring datasets included in IntCal20 in order to evaluate their strategic fit with the demands ofarchaeological users. Case studies on wiggle-matching single tree rings from timbers in historic buildings andBayesian modeling of series of results on archaeological samples from Neolithic long barrows in central-southernEngland exemplify the archaeological implications that arise when using IntCal20. The SWOT analysis providesan opportunity to think strategically about future radiocarbon (14C) calibration so as to maximize the utility of 14Cdating in archaeology and safeguard its reputation in the discipline.KEYWORDS: accuracy, calibration, dendrochronology, IntCal, precision, replication.INTRODUCTIONArchaeologists are making increasing demands of radiocarbon (14C) calibration. When the firstinternationally agreed high-precision 14C calibration curve was issued (Pearson and Stuiver1986; Stuiver and Pearson 1986), the median quoted error of 14C ages obtained byarchaeologists was ca. 80 BP (Bayliss 1998: figure 11.9) and calibration of single samples wasalmost all that was attempted (e.g. Pearson 1987). Over the intervening decades the advent ofaccelerator mass spectrometry (AMS) means that archaeologists have been able to adopt morerigorous sampling protocols and obtain an increased number of age determinations for theirsites (Ashmore 1999), quoted errors on 14C measurements from archaeological samples havesteadily reduced (e.g. Bayliss 2016: figure 1), and formal chronological modeling of series ofradiocarbon dates has become common practice (Bayliss 2015: figure 1).The SWOT framework (strengths, weaknesses, opportunities, and threats analysis) is astraightforward strategic planning technique that is of value in focusing attention on key issueswhich affect our ability to achieve stated goals (Sarsby 2016). In the case of the IntCal20calibration curve, our aim is to produce robust and accurate chronologies that are of sufficientprecision to address our archaeological questions, such as the timings of construction and useof a series of Neolithic long barrows in central-southern England. Calendrical accuracy is ofparticular importance in the portion of the curve which is based on tree rings as it is in thisperiod that 14C-based chronologies for archaeological remains are interpreted within historicalframeworks and those based on dendrochronology. A series of new measurements obtained onsingle tree rings from a post that had previously been dated by ring-width dendrochronologyfrom Lancaster Castle, UK, allow us to examine the precision and accuracy of wigglematching (Christen and Litton 1995) timbers from historic buildings.*Corresponding author. Email: alex.bayliss@historicengland.org.uk.Downloaded from https://www.cambridge.org/core. IP address: 86.158.108.208, on 28 Oct 2020 at 10:37:58, subject to the Cambridge Core terms ofuse, available at https://www.cambridge.org/core/terms. https://doi.org/10.1017/RDC.2020.77
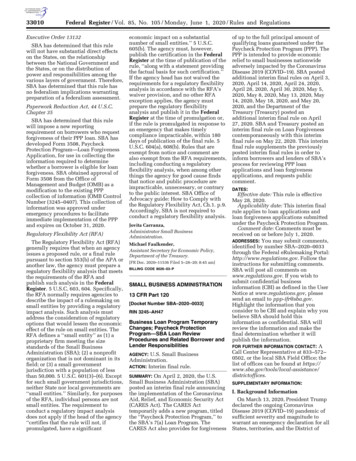
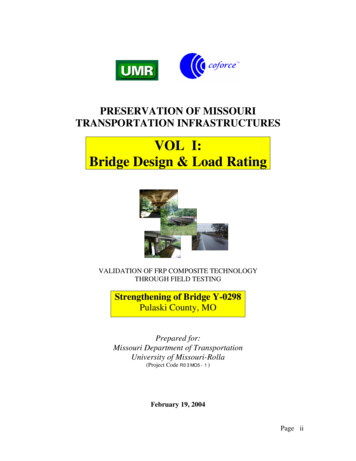
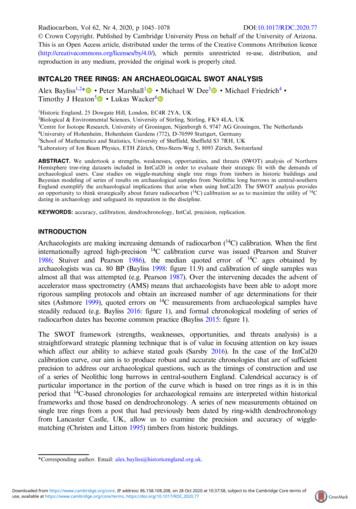
Data density (measurements per year)1046 A Bayliss et 000Calendar date (cal BP - AD 1950)Figure 1 Density of tree-ring data in IntCal20 (intra-laboratory replicates have been combined and multi-yearblocks spread proportionately across their bandwidth).Data Coverage, Density, and ResolutionIntCal20 includes 9211 measurements on tree-ring samples whose calendar dates are known bydendrochronology, and a further 1498 measurements on samples from trees that have been tiedto this sequence by radiocarbon wiggle-matching. Once intra-laboratory replicates have beencombined (see below), there are 7946 results on known-age tree-ring samples and 1299 onwiggle-matched samples (Reimer et al. 2020 in this issue). The comparable totals forIntCal13 were 3527 results on known-age samples and 232 results on wiggle-matchedsamples. This more than doubling of the quantity of data included in the new calibrationcurve is its first strength.The known-age tree rings in IntCal20 run from 0 cal BP (AD 1950)1 to 12,308 cal BP (10,359BC), and the wiggle-matched tree rings run from 12,293 4 cal BP (10,344 4 BC)2 to 14,194 4 cal BP (12,245 4 BC)3,4. These results are not spread evenly across this time period,however (Figure 1), with the density of data varying from an average of 2.7 measurementsper year in the most recent millennium to only 0.2 measurements per year in the millenniafrom 9000–10,999 cal BP (7051–9050 BC). Three quarters of the data are concentrated infive of the fourteen millennia covered by the tree-ring-based part of IntCal20 (i.e. the most1Ages cal BP are relative to the year AD 1950, with 0 cal BP equal to AD 1950. The relationship between AD/BC andcal BP ages is: cal BP 1950 – AD, and cal BP 1949 BC. The switch from 1950 to 1949 when converting BC ages iscaused by the absence of the year zero when progressing from 1 BC to 1 AD on the historical timescale (Pearson andStuiver 1986: 841).2Errors in this paper are cited at 1σ unless otherwise specified.3The oldest tree-ring determination that has been wiggle-matched to measurements from trees that have been dated bydendrochronology is a decadal block centered on 14,189.5 4 cal BP (Hd-25066; Kaiser et al. 2012). The oldest ring inthis decadal block therefore corresponds to 14,194 4 cal BP but, being a decadal block, we do not have directinformation on this year alone. Other papers within the IntCal20 special issue may refer to the central ring i.e.14,189 cal BP as the oldest determination. We also note that IntCal20 includes five older, entirely floating, tree-ringsequences for which no prior information on absolute calendar age is available (Turney et al. 2010, 2017; Adolphiet al. 2017). These five floating tree-ring sequences are not discussed here (98-1, 98-2, 98-3, 99-1, 99-2, and 99-3).4The IntCal20 curve has been created in two parts. From 0–13,913 cal BP the curve has been estimated based only uponthe tree-ring measurements discussed in this paper. All the measurements on known-age and wiggle-matched tree rings,from 0–14,194 cal BP, were used to create this part of the curve. The older part of the curve, from 13,913–55,000 cal BP,was then formed by extending this tree-ring only curve smoothly, based upon a combination of tree rings whereavailable and other material such as speleothems, foraminifera, corals, and macrofossils (see Heaton et al. 2020 inthis issue for precise details).Downloaded from https://www.cambridge.org/core. IP address: 86.158.108.208, on 28 Oct 2020 at 10:37:58, subject to the Cambridge Core terms of use, available athttps://www.cambridge.org/core/terms. https://doi.org/10.1017/RDC.2020.77
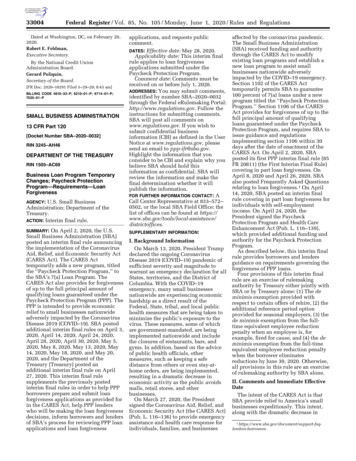
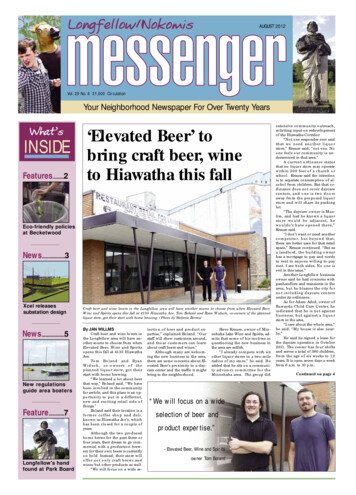
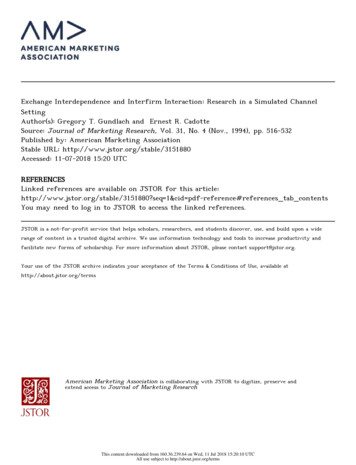
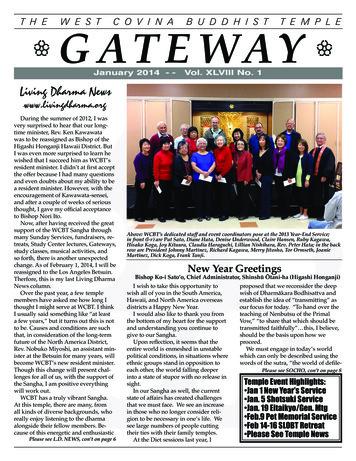
IntCal20 Tree Rings SWOT Analysis 10475000Wiggle-matchedKnown-ageNumber of datapoints400030002000100012345678910 11 12 13 14 15 16 17 18 19 20 20Block (number of annual rings)Figure 2 Resolution of tree-ring samples included in IntCal20 (intra-laboratory replicates have beencombined).recent four millennia, and 12,000–12,999 cal BP [10,051–11,050 BC]). In the 8000 yearsbetween 4000 and 12,000 cal BP (2051–10,051 BC), IntCal20 includes just 303 newmeasurements that were not included in IntCal13. This variability in the density of datacoverage is a weakness of the new calibration curve.Over half of the tree-ring samples included in IntCal20 comprised single growth-rings(Figure 2), with a further 18% being blocks containing 2–5 rings. Single-year measurementsare available for 2731 years (ca. 19% of the tree-ring-based part of IntCal20). Almosteverywhere where high-resolution data are available, additional structure in the calibrationcurve has been revealed (for example, Figure 3). On the basis of the three 21-year blocksselected for the recent annual tree-ring inter-comparison, this additional structure can beexpected usually to lie within, or very close to, the existing IntCal 1σ uncertainty envelope,although this may not always be the case (Wacker et al. 2020 in this issue: figure 1). Theproportion of decadal and bi-decadal blocks in IntCal20 has reduced to 20% and 6% of thedataset respectively, but these are still the only data available for the majority of the treering timescale.For archaeologists, striving to create prehistories on a generational timescale, these data can beworryingly sparse. For example, for two generations in the later part of the 53rd century BC(5261–5210 BC; 7210–7160 cal BP), a gap in the decadal dataset from Seattle (QL, set 1,division 14 in the IntCal20 database5 [hereafter e.g. 1-14]) means that the curve rests on5All data included in IntCal20 can be downloaded from http://intcal.org. The data are divided into sets (produced by asingle research group, usually a laboratory), and divisions (which may relate to measurements on a single tree by asingle laboratory, but may also denote a group of measurements on a single archive). Trees that have beenmeasured by more than one laboratory appear in multiple sets/divisions (e.g. Cott418 has been measured byMAMS (60-2) and ETH (69-19)). A full list of sets and divisions included in IntCal20 is provided by Reimer et al.(2020 in this issue: table S2).Downloaded from https://www.cambridge.org/core. IP address: 86.158.108.208, on 28 Oct 2020 at 10:37:58, subject to the Cambridge Core terms of use, available athttps://www.cambridge.org/core/terms. https://doi.org/10.1017/RDC.2020.77
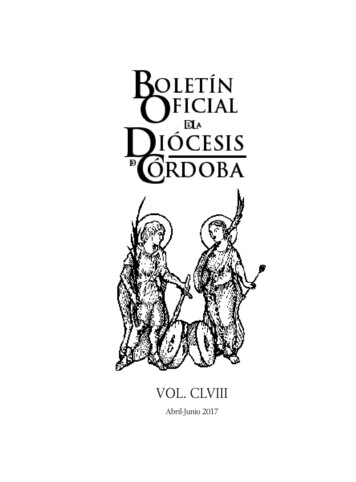
1048 A Bayliss et al.Calendar date (cal BP - AD 1950)7508008509009501000IntCal13Radiocarbon Age 010501000950Calendar date (AD)Figure 3 Comparison of IntCal20 (dark grey) and IntCal13 (red) for the 250-year period from AD 950 1200(1000–750 cal BP) showing the radiocarbon measurements from Lancaster Castle (LAN-C07), error bars andenvelopes at 1σ.just four measurements from Belfast on bi-decadal blocks (UB, 2-3 & 2-5) and twomeasurements from Heidelberg on a 4-year and a 5-year block (Hd, 5-5; Figure 4). This isan average data density of 0.1 measurements per year (the average density across the extentof the curve illustrated in Figure 4 is 0.2 measurements per year). This stands in contrast tosome of the sites which are modeled against this part of the curve. For example, if themodeling for the chronology of the settlement at Versend-Gilencsa, Hungary is to bebelieved (Jakucs et al. 2018: figures 5 and 8), the data density for this archaeologicalsettlement is at least double, and probably 20 times, that of the IntCal calibration curveagainst which it has been modeled. At a key juncture in European prehistory, as we try tounderstand the process by which Neolithic lifeways spread west and north out of theDanube corridor (e.g. Jakucs et al. 2016; Whittle et al. 2016; Denaire et al. 2017; Meadowset al. 2019), this is clearly unsatisfactory.The IntCal20 tree-ring data have been produced by 20 radiocarbon laboratories (Figure 5),with 60% produced by accelerator mass spectrometry (AMS), 31% by gas proportionalcounting (GPC), and the remaining 9% by liquid scintillation spectrometry (LSS). This is aDownloaded from https://www.cambridge.org/core. IP address: 86.158.108.208, on 28 Oct 2020 at 10:37:58, subject to the Cambridge Core terms of use, available athttps://www.cambridge.org/core/terms. https://doi.org/10.1017/RDC.2020.77
IntCal20 Tree Rings SWOT Analysis 1049Calendar date (cal BP - AD 6500QL- (1-14)UB- (2-3 & 2-5)6400Hd- (5-5)630046200361002Radiocarbon Age (BP)Data density (measurements per 0580054005350Calendar date (BC)Figure 4 Data density of IntCal20 between 5400 BC and 4900 BC (7349–6849 cal BP), showing paucity of data inthe mid- and late 53rd century BC), error bars at 1σ.3000Wiggle-matchedKnown-ageNumber of ry codeFigure 5 Number of tree-ring samples in IntCal20 dated by each laboratory.Downloaded from https://www.cambridge.org/core. IP address: 86.158.108.208, on 28 Oct 2020 at 10:37:58, subject to the Cambridge Core terms of use, available athttps://www.cambridge.org/core/terms. https://doi.org/10.1017/RDC.2020.77
1050 A Bayliss et al.marked change from the IntCal13 data, which was produced by eight laboratories with 80% ofmeasurements made by GPC and only 1% by AMS. After application of error multipliers forthe legacy data where appropriate (Stuiver et al. 1998a: 1044–1045), the mean quoted estimatesof total error produced by the three techniques in the IntCal20 dataset are equivalent: 19 6BP (AMS), 23 9 BP (GPC), and 23 6 BP (LSS).In principle more data from a larger number of laboratories should, on the basis of the“wisdom of crowds” (Galton 1907), more ac
The SWOT framework (strengths, weaknesses, opportunities, and threats analysis) is a straightforward strategic planning technique that is of value in focusing attention on key issues which affect our ability to achieve stated goals (Sarsby 2016). In the case of the IntCal20