Transcription
T H E PAT H T OEFFICIENT TRADEPROMOTIONSFEBRUARY 2015Copyright 2015 The Nielsen Company1
THE PATH TOEFFICIENT TRADEPROMOTIONSMuch like the media realm, the consumer product landscape isbecoming increasingly fragmented. Competition is rising, new channelsare developing and choice is rampant. The combination of these andmany other factors has retailers and manufacturers shuffling myriadpromotion options to best publicize their products and boost sales.The results, however, are largely ineffective and often lead to lossesrather than gains. To make matters worse, few folks have realized that ittakes more than offering additional deep discount programs to increasepromotion efficiency.From a business perspective, it’s critical that companies—manufacturersand retailers—get in front of this plight facing America’s consumerproduct goods (CPG) industry. That’s because they’re collectivelyspending millions of dollars to promote products and getting little—ornegative—in return.Is this a crisis for U.S. retail? The answer likely depends on yourdefinition of the word “crisis.” While the word is often used to describedisasters like famine or disease, it’s possible that manufacturers andretailers alike would describe their inability to at least break even ontheir massive trade expenditures as something of a crisis—especiallysince many seem ill-equipped to correct the problem.THE BIG PICTUREFirst, let’s talk about the big picture. Manufacturers and retailers acrossAmerica spend inordinate amounts of money on trade promotions—themarketing activities that these two partners use to entice customers tobuy their products. Price discounts are a common promotion tactic, butother efforts include feature and display, demonstrations, value-addedbonus programs and no-obligation gifts.2THE PATH TO EFFICIENT TRADE PROMOTIONS
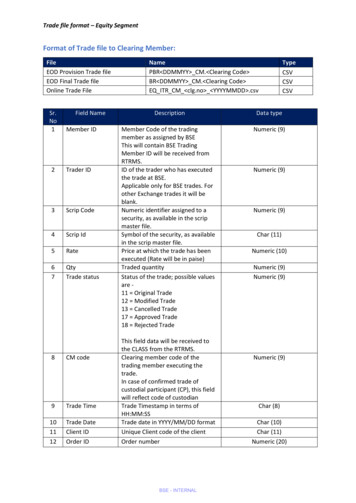
Over the past 10 years, companies around the globe have doubled theamount of money they spend on their trade promotions. Today, theyspend about 1 trillion annually, and they show no sign of pulling back,doing all they can to stay competitive in today’s challenging economy.While trade promotions can increase product visibility and brandawareness, they can also grow product categories, differentiate aproduct to take market share from a competitor and enlarge a specificproduct’s segment penetration. So what are the effects of these efforts?Today, more than one-fifth of the consumer products in the U.S. are soldunder one type of promotion or another.Now for the bad news. More than two-thirds of the trade promotionsthat happen each year in the U.S. don’t break even. And what’s evenmore telling is that eliminating 22% of trade promotions would actuallyhelp companies increase sales revenue. Overall, a minority of thepromotions taking place today actually make money.ASSESSING TRADE PROMOTION PERFORMANCE67%DON’T BREAK EVEN33%MAKE MONEYELIMINATING22%OF PROMOTIONSWOULD INCREASESALES REVENUESource: Nielsen Trade Promotion Landscape Analysis Database 2014 Q3Copyright 2015 The Nielsen Company3
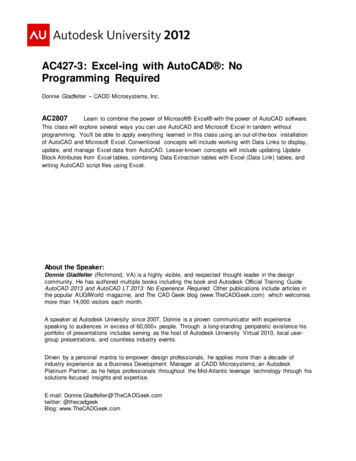
It’s true. America is pretty bad when it comes to trade promotions—orat least in terms of getting a positive return on that investment. Andwhat’s more, the problem is getting worse. That’s because in manycases, companies are simply trying to regain their footing by increasingthe frequency of their promotions, cutting prices lower or offeringdeep discounts more frequently. Unfortunately, these tactics, withoutclear insight into what will and won’t work, are going to create a biggerproblem than exists right now.PROMOTION INEFFICIENCY IS GETTING WORSE% OF WEEKS ON PROMOTION2014 3Q2014 2Q2014 1Q2013 4Q6.0%2013 3Q 0.602013 2Q6.5%2013 1Q 0.652012 4Q7.0%2012 3Q 0.702012 2Q7.5%2012 1Q 0.75% OF WEEKS ON PROMOTIONTRADE EFFICIENCYTRADE EFFICIENCYWhile the aggregate picture is very telling, a comparison with adspending sheds a different light on the overall subject of tradepromotions. When it comes to spending, CPG companies spend morethan twice on trade promotion than they do on advertising. In terms ofactual expenditures, brands and companies typically spend about 19%of their revenue on trade promotions, compared with about 7.5% onadvertising.The interesting thing about this scenario—especially given the lacklusterefficiency rate among trade promotions—is that it’s rare to find studiesanalyzing the return on trade spending. Comparatively, however,advertising effectiveness is a constant focal point for marketers andagencies around the globe.Perhaps this suggests that the industry perceives advertising as beingeasier to evaluate than trade promotions.4THE PATH TO EFFICIENT TRADE PROMOTIONS
IDENTIFYINGWHAT’SCAUSING THEINEFFICIENCIESIn looking at the significantly subpar performance of trade promotionsacross the U.S., it’s no wonder that only one in four Nielsen clients saysthey’re happy with their promotional program outcomes. So why is that?Based on learnings from our work with numerous CPG manufacturers,Nielsen has identified four fundamental issues that are hindering tradeefficiency.MEASUREMENT CHALLENGESMeasurement is no easy feat, and grappling with understanding theeffectiveness of trade promotions is something that plagues manyacross the CPG landscape. While manufacturers know what they spend,determining what they make on that spend is less clear-cut. For starters,the data they receive about what consumers buy comes from multiplesources. While manufacturers have access to retail sales data, they mustcope with a different set of product identifiers from each retail datasource, as well as differences in the unit of measure (such as case vs.consumer unit).Compound this problem with aligning the dates of the promotionbetween the manufacturer and the retailers across the tens of thousandsof promotions a big CPG company runs each year, and you get somesense of the scale of the challenge. Further, manufacturers have toseparate out sales that would have occurred anyway, if the product hadnot been promoted, from the incremental sales driven by the promotion,as well as adjusting for other drivers (including the weather).STRATEGIC PLANNING VS. TACTICAL REALITYIt’s not just about data and metrics. It’s also about the differencebetween a CPG company’s plan and what happens on the ground. MostCPG companies strategically plan for price and promotion once or twicea year. Many use sophisticated predictive analytic tools to figure out howalternative promotional programs would do in the market and decide onthe “best” course of action.Copyright 2015 The Nielsen Company5
Then, they relay these decisions as guidelines out to the accountteams, who work directly with the retailers. At that point, a thousandnegotiations begin—at which point the link between the view at thestrategic level and the key account level has already been broken. As theyear progresses, the sum of the thousand negotiations is likely to be verydifferent from the strategic plan sent down from headquarters at thebeginning of the year.Manufacturers need to integrate strategic planning tools at headquarterswith tactical negotiation processes at the key account level—so that eachretailer negotiation can be optimized while also remaining aligned withthe overarching intent of the strategic plan.PROMOTIONAL PLAN MANAGEMENT AND EXECUTIONGiven the large number of promotional programs that manufacturersexecute across categories, retailers and geographies, it’s critical thatthey use a consistent approach in order to ensure that the right productsare at the store at the right time—even if a retailer changes its mind atthe last minute and chooses to change the time, scope and support ofa promotion. Nielsen research has found that more than half of out-ofstocks are caused by poor price and promotion management.In short, promotional optimization and management tools have to linkreliably into the supply chain and financial management systems of themanufacturer.MANAGEMENT PROCESSMuch like anything, optimizing and managing promotional activityrelies on a dedicated, consistent process. CPG manufacturers will not beeffective or efficient in their trade promotions if they use them in an adhoc fashion or have a small group of analysts operate them in a silo.Truth be told, companies need powerful, integrated software applicationsthat enable a wide range of managers to optimize and executepromotional activities on an end-to-end basis so that a consistentprocess is used pervasively throughout the organization, for allcategories, retailers and geographies.6THE PATH TO EFFICIENT TRADE PROMOTIONS
A DEEPER DIVEINTO THE PROBLEMKnowing that the rubber meets the road when consumers start buyingand that trade promotion efficiency is lackluster, Nielsen recentlyconducted a widespread analysis of the retail landscape to betterunderstand the aggregate situation.At the onset, the benchmark analysis* covered 340 categories, 15departments, 1 million UPCs, 125 million event weeks and 1.6 trillionin retail sales. We then narrowed the analysis to eliminate some of theextreme skews. Specifically, we wanted to focus on the businesses thatwere promoting regularly and exclude promotional activity that wasminimal and infrequent. The analysis also excluded activities aroundtobacco, alcohol, and a few kitchen staples: eggs, milk and bread.The final analysis, which aimed to identify what drives performance,ultimately zeroed in on 92 million event weeks over nearly three yearsand totaling 213 billion in sales across 75 retail banners. To hone inon performance, the analysis identified the weeks where prices werelower than the everyday cost for an item and then isolated the expectedvolume from the actual volume sold during that period.We also used assumptions about the cost to execute and margins formanufacturers and retailers.211CATEGORIESCopyright 2015 The Nielsen Company13 811k 92MM 213BDEPARTMENTSUPCsEVENT WEEKSUS RETAIL SALES7
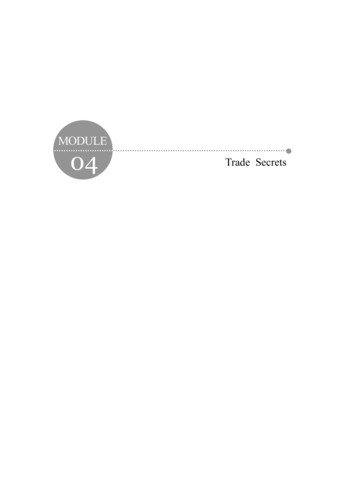
CATEGORYEFFICIENCY RATESAND AREAS OFOPPORTUNIT YWhile there are clear departments that would benefit from increasedpromotion efficiency more than others, the entire store is ripe withopportunity. That’s because the top effectiveness rate across the entirestore is only 50%. So even manufacturers and retailers that havemanaged to crack part of the trade promotion code by excelling to somedegree can improve their efforts and boost efficiency rates.EFFICIENCY OPPORTUNITIES EXIST THROUGHOUT THE STORETRADE PROMOTION EFFECTIVENESS RANGES FROM 25%-50%ACROSS DEPARTMENTS% OF WEEKS WHERE PROMOTIONS DON’T BREAK EVENBEAUT YCARE50%HEALTH59%PET CARE66%FROZEN ERSONAL50%DELI72%DAIRY75%HOUSEHOLD CARE50%MEAT62%BAKERY73%Read as: 74% of the promotion weeks for the produce category don’t break even.Source: Nielsen Trade Promotion Landscape Analysis 2014 Q38THE PATH TO EFFICIENT TRADE PROMOTIONS
The interesting thing about trade promotion efficiency is thateffectiveness can vary significantly within a single department. Forexample, 73% of the promotion weeks in the grocery department don’tbreak even, yet promotions for coffee are among the strongest in thestore. In fact, for every dollar spent on promoting coffee, retailers willget more than a dollar back in return 70% of the time.And some categories that are begging for proper trade promotionsaren’t delivering. Take the seasonal area, for example, which existssolely to feature items that will be promoted, is falling short, deliveringpositive returns only 24% of the time.PROMOTION EFFICIENCY VARIES SIGNIFICANTLY WITHIN CATEGORIESUNDERSTANDING WHERE YOUR EFFICIENCIES ARE IS VALUABLE CONTEXT100%TRADE EFFICIENCY 080%60%0 TRADE EFFICIENCY IGOCERATED MARIN OAADSANESHADWIR CISCHEAR OURSEACC CREAHEESSRBMORAND S PROIESPICDUCEESESHELF ASON DIPSTAIBLE NGMHOILKTCEREALPAP DIABETME ER NA ICXICAN PKINSAUFIR CEST AIDCRECOAMFFE DELIECTRAREAM YPANERSCAINSKECOESRIETICYRNIDEUTAN AL SA PDPUCESTEHOICIDUSEFOEOTHOCALDRECLEASUN AUTO NINGTANMFRO BAR APRO OTIVEZEN NDDBRE LIQU UCTSIADHADESOIR SDPRA DISPO CHIC APVITAM Y AND SABLE KENINSHABAGANISD S R STYLUPPLE INGMENTSFEMICECRINIENEHY AMGIEEYE NECASMRCOKING AT LIT ETERCESSATIONTRADE EFFICIENCY 100Read as: For every 1 spent on promotions for frozen toaster pastries, the promotions deliver more than 1 in returns 32% of the time.Source: Nielsen Trade Promotion Landscape Analysis 2014 Q3Copyright 2015 The Nielsen Company9
In addition to finding notable variances in efficiency across products,Nielsen’s benchmark study found that there is no relationship betweencategory size and promotion effectiveness. In short, category size doesnot dictate performance.For example, when we look across the store, it doesn’t get muchbigger than salty snacks—a 10.5 billion category. Despite consumers’immense love for their chips and pretzels, promotions in the categorydidn’t break even more than 75% of the time during the study period.On the flipside, the dips for salty snacks category is much smaller ( 331million), yet promotions for them broke even more than 70% of thetime.CATEGORY SIZE DOES NOT DICTATE PERFORMANCEPROMOTION EFFICIENCY CAN BE ACHIEVED THROUGHOUT THE STORE120% 10100% 880%60% 440% 220%SALTYSO SNACFTDR KSINKFR SCO UITOR YO FFEEALGHY URTICE GIENLASH UNCR EELDF S RY CO EAMDTDIWH ABL ETE OKIESPOSOL E VE RGE SABESLEO GE NTDI FRO ME TABLAHOPE ZEN SNA ERMEBCAN AR A AND SEAF KSODSNTCH D LI RAIN ODSH OO QUIID NGOSOHO RTE L ANUS NIN D O APEHFGOL AN FICEDC DOILEA LSFIR NINGRESTFRAIGBU IDERATHO TTEREDTDBAKE SU OGDG GBA OOARMEBDAT MAY Y FO SANOOD F NN DAISHADISEULST IN B AUCCO ABY ENT HBJASUINME CNTANAN D NCEDJPELROIP DELYAN DR DUC LICLEASH D PRIED F TSNIELNGES RUIM PIC F STA ERV ITPKESARE LEM LE A BLE M SUCAD EN NDEMILKYT TARIXEO ND LIGREASAVT D SUP HYMPAU ESSE LYIXAN TORTSMDREFR SALT SEAS OTIVIGEYOSERNAT NAC INGEDKSE S DIPAFOBL ODEAORCHWIEGR HIP NTA HONAIN PED L S EYAAN TO UCWA D D PPIN ETE RYR F BE GSINSEFR ILTRA ANSCTOZTREEN IONPEPICE LLEN PIE F ASTACR T P ILLINREAM ODU GTOPP CTDE INGDE LI T SPIL RAYATORY 6% OF CATEGORY EVENTSTHAT DON’T BREAK EVENCATEGORY SIZE ( BILLIONS) 12Read as: Soft drinks represent a 9.8 billion category, yet promotions in this space don’t break even 76% of the time.Source: Nielsen Trade Promotion Landscape Analysis 2014 Q310THE PATH TO EFFICIENT TRADE PROMOTIONS
EVENTFREQUENCY,DISCOUNTING ANDEFFICIENCYThe other important thing for companies to understand when they plantheir trade promotions: more events do not equate to more returns. Infact, the two are negatively correlated. According to Nielsen’s research,over-promoting actually dilutes efficiency.Over-using deep discounts is another way to kill promotion efficiency.According to Nielsen data, using deep discounts—those where the priceis 25% lower than normal—the effectiveness at driving sales significantlydegrades for 50% or more of the total promotional activity.SELECTIVELY USE DEEP DISCOUNTS TO MAXIMIZE PROMOTION EFFICIENCYAVERAGE CATEGORY TRADE %37.0%50-100%100%% OF TOTAL EVENTS PROMOTING DEEPER THAN 25% DEPTH OF DISCOUNTRead as: When 0-5% of promotions involve deep discounts, the average trade efficiency rate is 74.3%.Source: Nielsen Trade Promotion Benchmark Database 2014 Q3Copyright 2015 The Nielsen Company11
In addition to knowing how much to promote, it pays to know when topromote. For example, there’s an overabundance of promotional activitybetween Thanksgiving and Black Friday, but knowing how effective theyare can help retailers understand if they’re just spinning their wheels asthe holidays approach. Despite the findings about the diluting natureof deep discounts, a Nielsen study at the end of 2014 found that pricecuts of 30%-60% work better for U.S. retailers around Thanksgiving andBlack Friday than at other times of the year.In looking at the trends over the past two years, retailers have boostedtheir deep discount promotions by 3% around Thanksgiving, and themajority don’t fall victim to common promotional pitfalls. In fact,consumers have been so receptive to deep discounts around this timeof year that trade promotions can drive as much as a 22% higherthan-normal return, as has been the case in the general merchandisecategory, which includes small appliances, photo supplies, andtelephones and accessories.12THE PATH TO EFFICIENT TRADE PROMOTIONS
DEEP-DISCOUNT PROMOTION INCREASES ANDCHANGES IN PROMOTION EFFICIENCYTHANKSGIVING VS. YEAR-ROUND AVERAGEDEEP DISCOUNTVOLUME CHANGEDEEP DISCOUNT TRADEEFFICIENCY CHANGE12.6%GENERAL MERCHANDISE1.7%BEAUTY CARE1.1%PERSONAL CARE1.6%PRODUCEDAIRY-0.4%-0.8%PET CAREGROCERY4.4%4.2%8.4%2.1%1.8%0.9%DELI-1.1%HEALTH CAREHOUSEHOLD CARE7.2%3.9%BAKERYFROZEN 6.4%-1.2%Read as: Deep discounts for the general merchandise category have been nearly 22% more efficient during the holiday seasonover the last two years than during the rest of the year.Source: Nielsen Trade Promotion Landscape Analysis 2014 Q3Copyright 2015 The Nielsen Company13
STRATEGIESTO AVOID ANDSTRATEGIES TOEMBRACEWhen we look at the overall picture, it’s clear that the majority of theretail market needs to improve the efficiency of its promotions. Thereare, however, a handful of success stories—those that illustrate aneffective balance of promotion type, frequency and category to driveeffective performance.As we’ve detailed, some departments do better than others, andwe’ve seen notable variations even within a category. Contrary to whatmight be viewed as beneficial from a strategy perspective, Nielsen hasidentified several common misconceptions when it comes to programefficiency:CATEGORY SIZE DOES NOT DICTATE PERFORMANCEOpportunities exist across the store in all categories. A range ofcategories—ranging from 100 million to 10 billion in size—fall in the65%-75% inefficiency range, so size is a relative non-issue.CATEGORY HEALTH IS NOT DISCRIMINATINGInefficiency can plague both rising and falling stars. Nielsen researchhas found high degrees of performance variation among categories withincreasing and decreasing sales. Trade efficiencies among categorieswith declining sales of more than 5% ranges from - 0.41 to 1.76, andeffectiveness among categories growing by more than 5% ranges from- 0.12 to 1.50.OVER-PROMOTING ERODES EFFICIENCYAcross categories, every 5% in additional time on promotion isassociated with nearly 10% in decreased trade efficiency. Although it’snot a causal relationship, there’s little question that there is too much ofa good thing when it comes to promotions.On the flipside, of the strategies that have proven to be ineffective,three tactics have demonstrated the ability to drive positive results—regardless of category. The winners who have employed these tacticshave improved their trade efficiency by 3.6% and seen sales climbalmost 3%.14THE PATH TO EFFICIENT TRADE PROMOTIONS
MODERATION IS KEYThe selective use of deep discounts, along with shallow discountedevents, can be very effective. Specifically, less-frequent deep discountshave proven to be the most profitable. Nielsen has identified 13categories where this strategy has helped bring improvement whereinefficiency has been the norm. Among these categories, 73% of eventsdon’t break even, but a reduced use of deep discounts has provento improve efficiency by 3.6% over the past year. In aggregate, deepdiscount frequency was reduced by 39%. For example, deep discountsin the ice cream category were cut by 48% since last year, which boostedefficiency by 2%.CHANNEL-TO-PRODUCT MIX IS A CRITICAL CONSIDERATIONMatching promotional channels to promotional product mix has led togreater returns. In the hair-color category, for example, the opportunitylies in re-distributing the amount of promotion volume taking placeacross other channels. The ratio of inefficient-events-to-share-of-eventsin the drug category is 1.35x, meaning that the share of bad eventsis disproportionally high compared with the total number of events.As a channel, the drug category is over-indexing in terms of its badevents, which suggests that cutting back on promotions would boosttrade efficiency. To turn things around, retailers should transfer theirinvestment in the under-performing drug channel to a channel withbetter returns.PROMOTE WHERE PERFORMANCE IS HIGHManufacturers and retailers would be well served to promote more inthe segments that are strong performers. Segment performance is notstatic. It varies over time. So with that in mind, it’s critical to stay ontop of fluctuations in order to adjust investments and maintain positiveresults.In one category in the grocery channel, manufacturers spend the mostmoney promoting a specific segment that has the lowest promotionefficiency. This is most likely because the category is the most frequentlypromoted nationally. When we looked deeper into this segment, wefound that 1% of the promotions are still considered best-in-class withhigh efficiency. This presents an opportunity for manufacturers andcategory advisors to examine the planning and execution of these 1%events in order to identify ways to improve the rest of their promotions.Copyright 2015 The Nielsen Company15
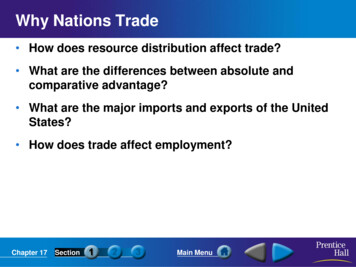
NEXT STEPSIn taking a step back from the granular details, we can re-focus on thelarger issue: the frequency of products being promoted in the U.S. isincreasing while the effectiveness of those promotions—which is alreadylow—is declining. The takeaway for the market? This is simply notsustainable for the packaged goods industry. It’s not sustainable for theretailers or the brands that operate in this space. No one is immune tothis.All is not lost, however. The first step in turning efficiency trendsaround is recognizing that a majority of the promotional efforts takingplace don’t break even. And what’s more, 22% of promotions could beeliminated and actually improve sales results.The next step is knowing where to start, which means understandingwhere your current efforts are netting out. If you don’t know where youare right now, there’s no way to create an effective strategy to moveforward.For example, if you know your events are delivering less than 1 in returnfor every 1 you spend, predictive analytics can help differentiate howto best promote by category, channel, event type and account. If you’rein the middle of the road—meaning you’ve experienced some successbut could gain additional efficiencies—identifying gaps where yourefforts are missing will help drive additional success. For example, theillustration here shows how three manufacturers agree on the right timesto promote a specific category, as illustrated by the three solid lines. Thedotted line, however, highlights how sales also peak in late winter andearly spring—times when consumers are buying but promotions are atbay.16THE PATH TO EFFICIENT TRADE PROMOTIONS
SEIZING OPPORTUNITIESCATEGORY TRADE EFFCIENCYMFR B % ON PROMOTIONMFR A % ON PROMOTIONMFR C % ON 60%TIME ON PROMOTIONCATEGORY TRADE EFFICIENCYALIGN YOUR PROMOTION PL AN WHEN SALES PEAK TOMAXIMIZE EFFECTIVENESS20%40%10%20%thonMr y n ul g pr ay n ul g p tr ay n ul g p tv c n b arv c n b arb arFe M Ap M Ju 7 J Au Se Oc No De 1 Ja Fe M Ap M Ju 7 J Au Se Oc No De 1 Ja Fe M Ap Ma Ju 7 J Au Se02 03 04 05 2 06 12 0 08 09 2 10 12 11 2 12 3 0 02 03 04 05 3 06 13 0 08 09 3 10 13 11 3 12 4 0 02 03 04 05 06 14 0 08 091 01 13 13 13 13 1 0 13 13 1 01 01 14 14 14 14 14 0 14 1412 12 12 12 1 0 12 12 1 020 20 20 20 20 2 20 20 20 2 20 2 20 20 20 20 20 2 20 20 20 2 20 2 20 20 20 20 20 2 20 20If your promotional activities fall into the elite category where every 1 dollar spent is delivering more than 1 in return, there’s stillroom to improve. That’s because even the beauty and personal caredepartments—the two most efficient areas of the store—are only turningin trade efficiency rates of 50%. The key to better trade efforts lies inlearning which consumer segments are driving differential performance.With that knowledge, you’ll be in a much stronger position to shift yourstrategy in a complementary way.Copyright 2015 The Nielsen Company17
18THE PATH TO EFFICIENT TRADE PROMOTIONS
*ABOUT THE NIELSEN TRADEPROMOTION L ANDSCAPE ANALYSISThe findings from this report were derived from 2012 through thirdquarter 2014 data from Nielsen’s Trade Promotion Landscape Analysis.This analysis examined trade promotion events where prices werediscounted at least 10% across 75 banners from food, drug and massmerchandise retail. The analysis included categories with sales of morethan 100 million and promotion frequency of at least 5%. The analysisexcluded tobacco, alcohol, eggs, milk and bread. The analysis alsoexcludes Walmart.ABOUT NIELSENNielsen N.V. (NYSE: NLSN) is a global performance managementcompany that provides a comprehensive understanding of whatconsumers Watch and Buy. Nielsen’s Watch segment provides media andadvertising clients with Total Audience measurement services across alldevices where content — video, audio and text — is consumed. The Buysegment offers consumer packaged goods manufacturers and retailersthe industry’s only global view of retail performance measurement. Byintegrating information from its Watch and Buy segments and other datasources, Nielsen provides its clients with both world-class measurementas well as analytics that help improve performance. Nielsen, an S&P 500company, has operations in over 100 countries that cover more than 90percent of the world’s population.For more information, visit www.nielsen.com.Copyright 2015 The Nielsen Company. All rights reserved. Nielsen andthe Nielsen logo are trademarks or registered trademarks of CZT/ACNTrademarks, L.L.C. Other product and service names are trademarks orregistered trademarks of their respective companies.15/8455Copyright 2015 The Nielsen Company19
20THE PATH TO EFFICIENT TRADE PROMOTIONS
easier to evaluate than trade promotions. PROMOTION INEFFICIENCY IS GETTING WORSE 6.0% 6.5% 7.0% 7.5% 0.60 0.65 0.70 0.75 2012 1Q 2012 2Q 2012 3Q 2012 4Q 2013 1Q 2013 2Q 2013 3Q 2013 4Q 2014 1Q 2014 2Q 2014 3Q TRADE EFFICIENCY % OF WEEKS ON PROMOTION TRADE EFFICIENC Y % OF WEEKS ON PROMOTION