Transcription
Farm Income Statement AnalysisAAE 320Paul D. MitchellAgricultural & Applied Economics
Learning Goals How to read an accounting Income Statement as itpertains to agricultural operations How to calculate several key measures of income andrates of return Typical income and rates of return in agriculture Common accounting software packages used byWisconsin farms
Income Statement Income Statement: Record of revenues and expenses over aperiod of time Remember: Balance Sheet is statement of assets,liabilities and equity at a point in time Other names for an income statement Operating Statement Profit and Loss Statement (P & L) Income Revenue minus Costs Question it answers: Did you make money last year?
Income Statement Income Revenue minus Costs Account for all business revenue earned and costs during theperiod, both cash and non-cash Revenue consists of Cash Revenue and Non-Cash Revenue Costs consist of Cash Expenses and Non-Cash Expenses
Cash Revenue Crop sales Feeder livestock sales Crop and Livestock product sales Government program payments, including crop insuranceand disaster payments Basically anything you sell! Will generally have a record for checks received
Non-Cash Revenue Will not always have records for these revenues Inventory Changes for commodities ready for sale Grain, feeder livestock Value of ending inventory minus value of beginning inventory Accounts Receivable: ending balance minus beginning balance Miscellaneous: Non-cash payments in kind, trades, custom harvest arrangements
Revenue: Special Agricultural Cases Gain/Loss from sale of culled breeding livestock or milk cows Treat as Cash Revenue, a normal part of production process Typically do not treat it as gain/loss from sale of a capital asset Change in value of raised breeding livestock or milk cows (a calf thatbecomes a heifer, a heifer that becomes a cow) Treat the increase in value of raised livestock as an increase inNon-Cash revenue Practical way: Treat it like an inventory change for the herd Use a book value for each animal type, then calculate theending value minus the beginning value for the herd
Revenue: Special Cases: Sale of Capital Assets Treat gains or losses on the Sale of Capital Assets as Cash Revenue Land: Selling Price minus Selling Costs Revenue changes only due to price changes Selling costs: often there are deferred taxes due Depreciable Assets: Selling Price minus “Book” Value” (the valueaccording to your depreciation schedule) Revenue changes due to price changes and errors in estimatingdepreciation This adjusts revenue for “errors” in depreciation, which are verycommon
Cash Expenses Purchased inputs: fertilizer, seed, fuel, chemicals, feeder livestock,feed, etc. Labor and services Repairs and maintenance Property taxes, insurance, etc. Everything you buy for the farm!!! Will generally have records for checks written
Non-Cash Expenses Will not always have records for these expenses Depreciation All capital assets (buildings, tractors, etc.) Breeding livestock, milk cows, perennial crops A cost of production to account for, even if you don’t pay cash Accounts Payable Ending accounts payable balance minus beginning accountspayable balance
Prepaid Expenses Expenses paid in previous tax period for production during thecurrent tax period Common examples: fertilizer, seed, feed etc. bought in previous taxyear for this crop year Goal: to put expenses into the year they were used to producecrops/livestock Expenses for This Year Prepaid Expense Last Year – Prepaid ExpenseThis Year Same thing for large feed, fuel and other infrequent purchases Main idea: put expenses into the year the inputs are used for
Accrued Expenses Cash interest paid Add accrued interest owed Subtract interest prepaid Property taxes paid Add accrued taxes owed Subtract taxes prepaid Income taxes owed Should estimate, but that very difficult Do Income Statement as pre-tax income Do after-tax Income Statement later after pay taxes
Income Statement Main Idea: Income Revenue - Costs Revenue – Expenses Net Farm Income from Operations Include Unpaid Labor & Management & Net Gains from Sale ofCapital Assets Net Farm Income Trying to separate income from production activities versusincome from investment activities This is the general idea, many variations due to differences inthe non-cash costs and non-cash revenues included
Cash Accounting and Accrual Adjustments Most farms use cash accounting, especially for taxes Common problems cash accounting creates1. Prepaid expenses: Buy inputs (seed, fertilizer, chemicals, feed,fuel) in one year, but use them the next year2. Output sales in year different than production year: Harvestcrops and livestock born/raised in one year, but sell in next year3. Buy inputs and make sales to reduce taxable income Often cannot use costs and revenue from taxes to calculate profits byenterprise, only profits by year Accrual Adjustments: Put costs and revenues into the right year todetermine profits by enterprise
Accrual Adjustment of Cash Income Statement Accrual accounting: the business standard: GAAP Accrual accounting: more accurate and useful for decision making:puts costs and revenue in the right years Cash accounting simple and has tax advantages Farms end up with two sets of accounting records if do it “right”: cashaccounting for taxes and accrual accounting for decisions Farms create cash accounting records for tax purposes, then doan accrual adjusted cash basis income statement from them What was my income in 2019? Cash accounting for taxes What was my 2019 income from growing corn? Accrual adjusted Farm accountants work out the details
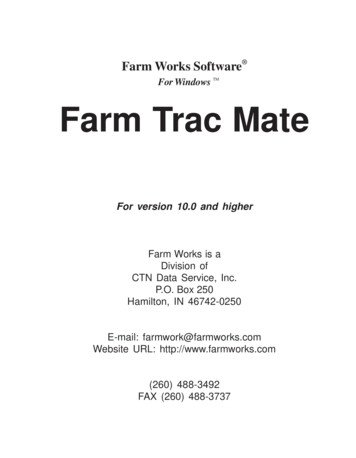
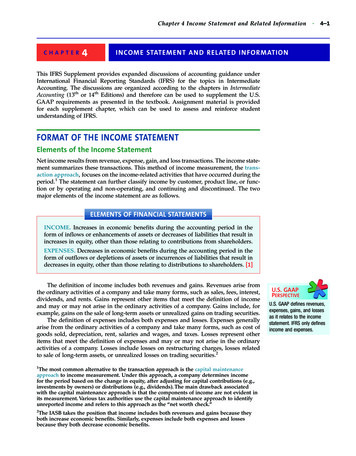
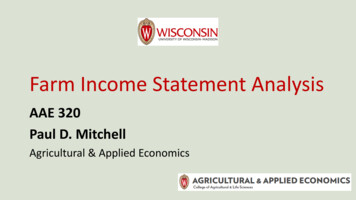
Simple Example to Illustrate Cash versusAccrual Accounting If 2020 is a high revenue year, to lower 2020 taxes, farmers often Increase prepaid expenses: Buy more than usual inputs in 2020 for the 2021crop or herd use (feed, fertilizer, seed, fuel) Sell 2020 grain after Dec 31, 2020 so less 2020 income Just “kicks the can down the road” but eventually a low-income year happensand you can “catch up” To calculate profits from growing corn in 2020 Do not include revenue from corn grown in 2019 and sold in 2020, but do includerevenue from corn sold in 2021 that was grown in 2020 Include costs paid in 2019 for inputs used in 2020, but not costs paid in 2020 forinputs used in 2021
Illustration of Accrual AdjustmentWhat was my profit from growing corn in 2020?Jan 1, 2020Revenue on 2019income statementBuy seed cornfor 2020 cropDeduct as costfor 2019 taxes2020 Crop YearSell some ofyour 2019 cropDeclare asincome for2020 taxesCost on 2020income statementJan 1, 2021Revenue on 2020income statementBuy seed cornfor 2020 cropDeduct as costfor 2020 taxesSell some ofyour 2020 cropDeclare asincome for2021 taxesCost on 2021income statement
Uses for Income Statement See if made a business had a profit or a loss, but really wantto know profitability Profitability: normalize for size to see if there is efficient useof resources to produce income Five Measures commonly used Net Farm Income from OperationsShould be Accrual Adjusted Net Farm Income Rate of Return on Assets Rate of Return on Equity Operating Profit Ratio
Calculating Farm Income: Revenue You decide which non-cash sources to include and whether itis accrual adjusted or not Selling Things: self explanatory Capital Gains: Selling of capital (non-current) assets for pricesdifferent than their basis Sell land for different price than original cost Depreciable assets: selling for price different thanremaining basis Are you going to do accrual adjustments?
Calculating Farm Income: Cost Operating Costs: You decide what non-cash costs to includeand whether to use accrual adjustments Interest: separate it out as an operating expense Need to account for interest in some measures Unpaid Labor and Management: How much you “payyourself” for labor and management: you decide Need to account for it in some measures Are you going to do accrual adjustments?
Net Farm Income from Operations (NFIfO) NFIfO Revenue – Operating Costs – Interest NFIfO Income made by the farm operation Does not include investment income from sale of capitalasset sales: depreciation should already be included as anon-cash expense Does not include paying the operator/manager for time andlabor
Net Farm Income (NFI) NFI Revenue – Operating Costs – Interest – Unpaid Labor& Management Capital Gains Income generated by all farm business activities after payingall expenses (operation & investment activities) Includes net gain from sale of capital assets (investmentactivities) Includes paying for owner/operator’s time and management(as though busines hired a manager) NFI NFIfO – Unpaid Labor & Management Capital Gains
NFIfO vs NFI A farm is a mix of different activities: labor, management, investment,financing, etc. NFIfO: trying to get at the crop growing and livestock part of theoperation, not investment or management NFI: tries to get at all the farm business earning (including investmentactivities) and after paying for the manager
Return on Assets (ROA) ROA Revenue – Operating Costs – Unpaid Labor & Mngmt Capital Gains ROA NFI Interest Income generated by all Farm Assets, including investment income Do not Subtract Interest Interest cost of using someone else’s money so your farm canhave more assets than just what you can own with your equity ROA wants to calculate income generated by all assets, yours andother people’s Other terms: Return to Capital
Return on Assets (ROA) Estimate cost of Unpaid Labor and Management What would it cost to hire someone to do all the currently unpaidlabor and management? What would you/your family make at your next best alternatives(opportunity costs)? Removing Unpaid Labor and Management arbitrary, but important Whatever value you choose changes estimated ROA If ignore unpaid labor and management (which many do), will gethigher ROA Know these issues before you compare with other businesses andwith market returns
Rate of Return on Assets (ROROA) ROA compared to size of business How much income is the farm generating relative to the amount ofassets used? ROROA (ROA/Average Assets) x 100 Average Assets average of assets over the time period of theIncome Statement Go to Balance sheet and use average of total assets (current andnon-current) at start and end of period Rates of return are why Balance Sheet and Income Statement gotogether
Rate of Return on Assets (ROROA) ROROA (ROA/Average Assets) x 100 Average Assets “size” of business during the accounting period Which basis for asset valuation: Cost or Market? Use Market Basis to compare farms and to compare to liquidatingand getting market rates of return on financial investments Use Cost Basis to look at your trend over years Compare ROROA only if done in same way, especially asset valuation Do not include non-farm assets and income
Return on Equity (ROE) ROE Revenue – Operating Costs – Interest – Unpaid Labor andManagement Capital Gains ROE ROA – Interest ROE NFI Of all the income generated by the Farm Assets, ROE is the part thatgoes to you as holder of equity in the business Return on your equity invested in the farm
Rate of Return on Equity (ROROE) ROROE (ROE/Average Equity) x 100 Average Equity average of equity at the beginning and end of theperiod Obtain from Balance Sheet Like ROROA, except use ROE, not ROA ROE removes Interest from ROA Interest is farm income to pay for debt equity Interest is the “ROE” for the bank, and the Interest Rate is roughlythe bank’s “ROROE”
ROROA, ROROE and Interest Rate Interest the only difference between ROE and ROA If Rate of Return on Assets Interest Rate,Rate of Return on Equity Rate of Return on Assets If Rate of Return on Assets Interest Rate,Rate of Return on Equity Rate of Return on Assets If ROROA Interest Rate, then extra generated from use of externalfunds goes to increase ROROE
Operating Profit Margin Ratio (“Profit Margin”) Operating profit as percent of Revenue Operating Profit Return on Assets Operating Profit Margin Ratio ROA/Total Revenue Of all revenue generated by the business, how much does thebusiness keep? Low Profit Margin: improve ratio first (by lowering costs) beforeexpansion High Profit Margin: expansion may make sense
Summary of Farm Income Definitions Net Farm Income from Operations (NFIfO) Revenue – Operating Costs – Interest Net Farm Income (NFI) Revenue – OperatingCosts – Interest – UnpaidLabrMngmt CapGains NFI NFIfO – UnpaidLabrMngmt CapGains Return on Assets (ROA) Revenue – OperatingCosts – UnpaidLabrMngmt CapGains ROA NFIfO Interest – UnpaidLabrMngmt CapGains ROA NFI Interest Return on Equity (ROE) Revenue – OperatingCosts – Interest – UnpaidLabrMngmt CapGains ROE ROA – Interest NFI Profit Margin ROA/Total Revenue
Farm Income: Final Comment When a small business or farm does their accounting (or pays someone to do it) and they calculate farm income They decide how they want to deal with non-cash costs, non-cashrevenues, depreciation, inventory changes, accrued expenses,prepaid expenses, accrual adjustments and unpaid labor andmanagement costs for themselves and their family When comparing farms to one another, for an accurate comparison,must use the same assumptions for non-cash costs, non-cashrevenues, depreciation, inventory changes, accrued expenses,prepaid expenses, accrual adjustments and unpaid labor andmanagement
Summary How to develop an Income Statement Accrual Accounting vs Cash Accounting Accrual Adjusted Cash Accounting How to calculate and interpret measures from Income Statement Net Farm Income Net Farm Income from Operations Return on Assets and Rate of Return on Assets Return on Equity and Rate of Return on Equity Profit Margin Look at example rates and margins Look at example income statement
Rates of Return in Dairy UW Center for Dairy tp://cdp.wisc.edu/Financial%20Benchmarks.htm Two methods Assets at Cost Basis with Tax Depreciation Assets at Market Basis with Economic Depreciation Does NOT include cost of unpaid labor and management oropportunity cost of owner equity
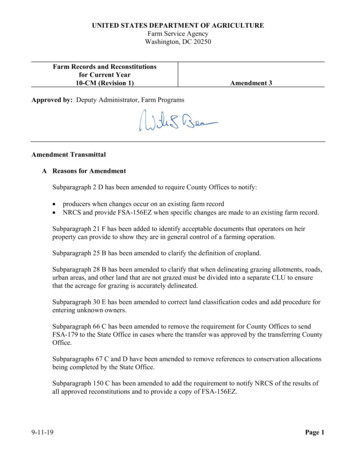
Average Profitability in WI DairyCost Basis and Tax -1.69%16.15%9.07%4.99%12.38%10.25%Profit MarginMarket Value and Economic .05%4.82%2.34%Profit Margin5.79%13.31%10.52%
ROROA in WI Dairy: AgFA 0720082009ROROA6.77%3.25%8.39%6.49%-1.65%* Assets at Market Value and Economic Depreciation2002 Range of ROROARange% Farms 0%35.5%0% - 2.5%20.1%2.5% - 5%16.3%5% - 7.5%14.0%7.5% - 10%7.1% 10%7.1%
2009: A Bad Year for DairyNFIROROA ROROETop 40% 77,098 3.32% 2.63%The Rest - 23,794 -7.84% -2.83%473 Farms in AgFA database for 2009Even in bad years, somefarms make money
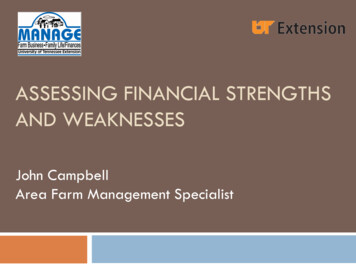
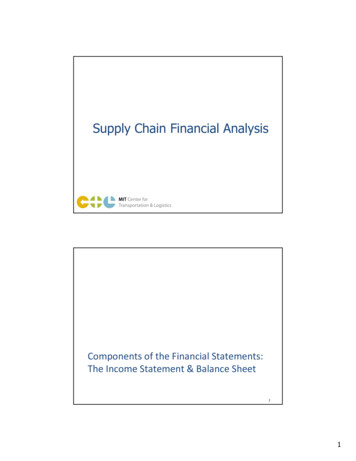
More Recent WI Dairy Data250 famers for 2014-2016 Larger farms have higherROA, but more leveraged, sothey don’t keep as much ofthe ROA as ROE Write-up does not explainasset valuation method, noncash costs used and unpaidlabor and managementassumptionsProfit Debt toHerd Size ROA Margin Asset Ratio 50 0.5% 3.5%15.6%50-99 1.6% 8.9%25.5%100-199 2.4% 8.7%45.6%200-499 4.0% 10.6%59.1%500-999 4.9% 12.4%62.0% 1,000 6.8% 13.3%62.2%All2.2% 9.0%Source: ity-14 15 16-C-1.pdf
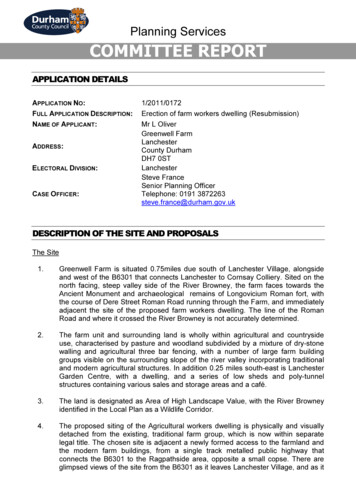
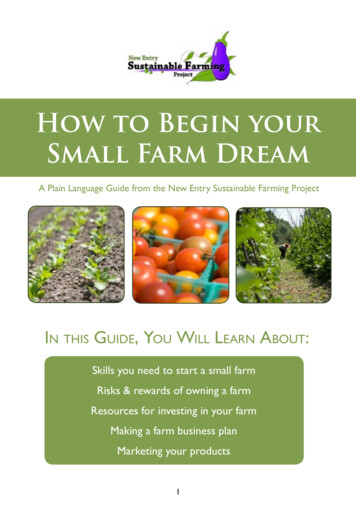
More Recent WI Dairy DataDistribution of ROA by Herd Size250 famers for 2014-2016 Even in good years,Herd Sizesome farms lose 50money50-99 Even in bad years,100-199some farms make200-499moneyTop TopBottom Bottom10% 25% Median 25%10%4.6% 1.9% 0.5% -1.5% -3.8%9.1% 4.2% 1.6% -0.6% -3.2%9.6% 5.7% 2.4%0.1% -2.5%12.3% 8.1% 4.0%1.2% -2.0%500-999 14.1% 9.6% 4.9%2.0% -0.9% 1,000 15.4% 9.0% 6.8%2.4% 0.4%Source: ity-14 15 16-C-1.pdf
IA 1990-1998 by Type and 2000-2006IA 1990-1998 ROROA ROROEGrain7.3%6.0%Hog7.4%6.3%Fed Beef6.0%4.6%Cow-Calf4.5%2.6%Dairy7.6%7.5%Profit Margin22.3%20.9%23.1%16.0%21.1%IA 2000-2006 ROROA ROROE Profit Margin Current Ratio Debt to AssetTop 20%12.8% 15.1%22.9%3.450.41Upper 20-40% 11.4% 12.7%20.1%3.440.37Middle 20%7.9%8.1%17.0%2.500.37Lower 20-40%9.2%11.5%16.7%1.870.36Lowest 20%4.4%2.9%9.0%1.620.44Source: 83.pdf
IL and MN 2004IL 2004GrainHogBeefDairyROROA6.2%13.4%2.9%9.6%MN 2004AverageTop 20%Btm 10.9%20.8%-18.0%Profit Margin17.6%26.0%-8.0%
Source: -performance-of-illinois-grain-farms.html
Farm Accounting Programs(from Jenny Vanderlin, UW CDP) AAIMS: Agricultural Accounting & Redwing sells CenterPoint andManagement Information SystemPerception CDP developed and supports, More expensive, used by agcheap ( 150) for dairy onlyaccounting firms CenterPoint is newer, more for AgManager by AgriSolutionsfarmers General farm accounting, Farm Others: Farm Fund , PeachTree,Credit Services useQuickBooks, Quicken, MoneyWorks CDP & UWEX presentations & workshops for farmers to learn more Heart of the Farm, Annie’s Project, plus as requested
WI Farm Management Associations Fox Valley Farm Management http://fvfma.com/ in Appleton, WI with about 700 members Lakeshore Farm Management http://www.lakeshorefarmmanagement.com/ in Valders, WI with about 1,000members Services provided to members1.2.3.4.Tax preparation, management and planningComputerized and hand record-keeping systemsScheduled "on the farm" consultationsYearly farm business summary and analysis Ag Lenders, UW Extension and CDP
More Information UWEX Center for Dairy Profitability (CDP) FarmDOC IL Extension Center for Farm Financial Management MN Extension AgDecision Maker IA Extension Farm Financial Standards Council UW CDP soon to release FARMBENCH to replace AgricultureFinancial Advisor (AgFA)
Learning Goals How to prepare and read an accounting Income Statementas it pertains to agricultural operations How and why to do accrual adjustments to income statement How to calculate key measures of income and rates of return NFIfO, NFI, ROA, ROROA, ROE, ROROE, Profit Margin Typical income and rates of return in agriculture Common accounting software used by WI farms
ROA NFI Interest Income generated by all Farm Assets, including investment income Do not Subtract Interest Interest cost of using someone else's money so your farm can have more assets than just what you can own with your equity ROA wants to calculate income generated by all assets, yours and other people's