Transcription
ASSESSING FINANCIAL STRENGTHSAND WEAKNESSESJohn CampbellArea Farm Management Specialist
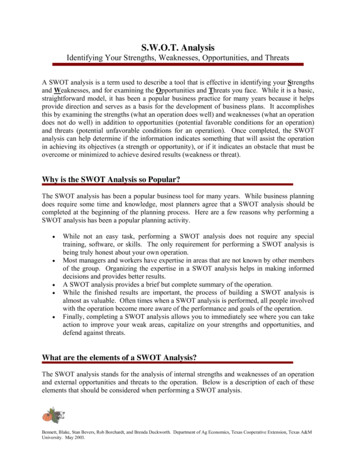
“Keeping records and preparingbudgets is about as exciting aswatching paint dry.”Rosemary Harter, Illinois farm wife who helped savethe farm by improving records and developingmarketing plans.
Financial Statements Balance Sheet Statement of financial condition at a specific timeIncome Statement Summaryof income and expenses that occurred duringa specified accounting period (usually calendar year) Cash flow statement Howcash has entered and left during the year
Farm Finance ScorecardLooks at 16 financial management measuresDeveloped by:K. Becker, D. Kauppila, G. Rogers, R. ParsonsUniversity of VermontD. Nordquist, R. CravenCenter for Farm Financial ManagementUniversity of Minnesota
Liquidity Current Ratio TotalCurrent Farm Assets /Total Current Farm Liabilities Measures extent to which current farm assets wouldpay of current farm liabilitiesVulnerable 1.11.7StrongWorking CapitalTotal Current Farm Assets - Total Current Farm Liabilities Tells the operating capital available in the short term
Solvency Farm Debt-to-Asset Ratio TotalFarm Liabilities / Total Farm Assets Compares total farm debt to total farm assets Higher ratio indicates greater financial risk and lowerborrowing capacityVulnerable60%30%Strong
Solvency Farm Equity-to-Asset Ratio FarmNet Worth / Total Farm Assets Owners share of businessVulnerable40%70%Strong
Solvency Farm Debt-to-Equity Ratio TotalFarm Liabilities / Farm Net Worth Compares lender’s share to owner’s shareVulnerable150%43%Strong
Profitability Net Farm Income Grosscash farm income – total cash farm expenses inventory changes - depreciation and other capitaladjustments Represents returns to owner’s labor, management, andequity
Profitability Rate of Return on Farm Assets (NetFarm Income Farm Interest – Value of operator’slabor and management) / Average Farm Assets Average interest rate being earned on all (owner andlender) investments in the farmVulnerable4%8%Strong
Profitability Rate of Return on Farm Equity (NetFarm Income Farm Interest – Value of operator’slabor and management) / Average Farm Net Worth Average interest rate being earned by owner’sinvestment in farmVulnerable3%10%Strong
Profitability Operating Profit Margin Returnon Farm Assets / Value of Farm Production Shows operating efficiency of business Ifexpenses are low relative to value of farm production,operating profit margin will be good Low profit margin caused by low product prices, highexpenses, or inefficient productionVulnerable15%25%Strong
Repayment Capacity Term-debt Coverage Ratio (Netfarm operating income net non-farm income scheduled interest on term debt – family living – incometaxes) / Scheduled principal & interest payments onterm debt Shows ability to repay term debts (farm and non-farm)on timeVulnerable110%140%Strong
Repayment Capacity Capital-replacement Margin Netfarm operating income net non-farm income –family living – income taxes - Scheduled principal &interest payments on term debt Amount left after all operating expenses, taxes, familyliving, and scheduled debt payments have been made Money available for purchasing or financing newmachinery, equipment, land, or livestock
Financial Efficiency Asset-turnover rate Valueof farm production / Average farm assets Measures efficiency in using capital High level of production with a low level of capitalinvestment gives high asset-turnover rate Reverse gives low asset-turnover rateVulnerable30%45%Strong
Financial Efficiency Operating Expense Ratio (Totalfarm operating expense – Farm Interest) / GrossFarm Income Proportion of farm income used to pay operatingexpenses, not including principal and interestVulnerable80%60%Strong
Financial Efficiency Depreciation Expense Ratio Depreciation& other capital adjustments / Gross FarmIncome Tells what proportion of farm income needed tomaintain capital used by the business Not 1040F depreciationVulnerable15%5%Strong
Financial Efficiency Interest Expense Ratio Farminterest / Gross farm income Shows how much of gross farm income is used to payfor borrowed capitalVulnerable10%5%Strong
Financial Efficiency Net Farm Income Ratio NetFarm Income / Gross Farm Income Compares profit to gross farm income Left after all farm expenses, except for unpaid laborand management, are paidVulnerable10%20%Strong
Cost of Production
Why, What, How? To adequately evaluate value-added opportunities,answer this question: Whatis your cost per hundredweight of producingmilk? Not as simple as it soundsWhat do you include?There are different definitions of cost of production Economiccost may include value of total investment Cash cost may include family living and income taxes
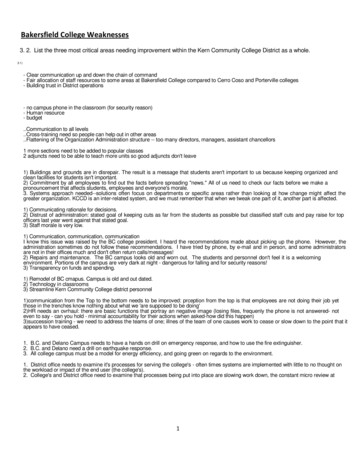
Minnesota Dairy Farm Data2011 – 468 FarmsAll 468 FarmsAverage Herd SizeMilk Per CowCulling PercentageCow Death Loss %Feed Cost/Cwt. MilkAverage Milk Price158.122,07127.77.6 8.86 19.96114 Farms,100-200 Cows139.219,95826.77.2 9.47 20.49Source: www.finbin.umn.edu/output/222761.htm
DefinitionsDirect Expenses FeedBreedingVetSuppliesFuelRepairsCustom HireHired LaborUtilitiesTruckingMarketingBeddingOverhead Expenses Hired LaborBuilding LeasesUtilitiesInterestDepreciationMiscellaneous
DefinitionsOther Revenue Adjustments Costof replacements Cull income Bull calves Inventory changeLabor & Management Value of operatorsunpaid labor andmanagementRelate to family livingand income taxes
Minnesota Dairy Farm Data - 2011Cost of Production Per Cwt. of wsOver 500CowsDirect13.6914.5413.9113.7713.6313.50Direct Overhead16.3116.9016.5516.7716.2915.90 .98 Labor &Mgmt.18.4420.1819.4919.3118.2017.51Milk Price19.9620.2920.1420.4919.7619.71
Minnesota Dairy Farm Data - 2011Cost of Production 00CowsOver 201.191.331.331.201.08Owner’sLabor 19.3118.2017.51Milk 10.651.181.562.20
Cash Cost of Production - CowIncluding all demands on cash.The following data isfor example purposesonly and should notbe viewed as theexpected outcome ofany dairy operation.
Example Farm 125 cows @ 19,000 lbs. milk/cow90 acres corn silage100 acres grass/clover hay115 acres grass/clover pasture 25,000 equipment loan balance 100,000 farm loan 20,000 family living from dairy, rest from offfarm incomeFarm share of income taxes
Cash ExpensesWhole FarmPer CowPer hemicals4,46035.680.19Hay Twine2001.600.01Cow Feed162,5001,300.006.84Heifer 585.000.45Dairy 5022.000.12Milk Hauling26,125209.001.10
Cash ExpensesWhole FarmPer CowPer Cwt.Dairy Check-off3,56328.500.15Coop Dues2,37519.000.10Equipment Interest1,0008.000.04Farm Interest3,19125.530.13Fuel & Oil18,000144.000.76Repairs23,000184.000.97Hired Labor35,000280.001.47Property Taxes2,00016.000.08Farm 4.000.025,00040.000.21 414,339 3,314.71 17.45Dues/FeesMiscellaneousTotal Cash Expenses
Cash Requirement SummaryWhole FarmPer CowPer Cwt.Equipment Replacement15,000120.000.63Principal Payments23,979191.831.01Family Living (Farm Share)20,000160.000.84Income Tax/Social Security6,76354.100.28 480,081 3,840.65 20.21Total Cash Required
IncomeFarmPer CowPer Cwt. 451,250 3,610.00 19.00Cull Cows26,325210.601.11Bull Calves3,50028.000.15 481,075 3,848.60 20.26MilkGross Farm Income
Summary Assess current financial condition before investing ina value-added ventureLook for areas that could improve current situation Increaserevenue Reduce expenses Modify debt structure Calculate your cost of productionAnalyze likely consequences of adding a valueadded venture
MANAGE Program Review current financial situationCapitalize on strengths and reduce weaknesses inthe farm businessDevelop individualized farm and financial plansExplore alternativesEvaluate capital investment opportunitiesAnalyze likely consequences of changing the scopeof enterprises (including new operations)
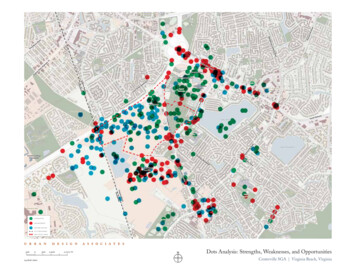
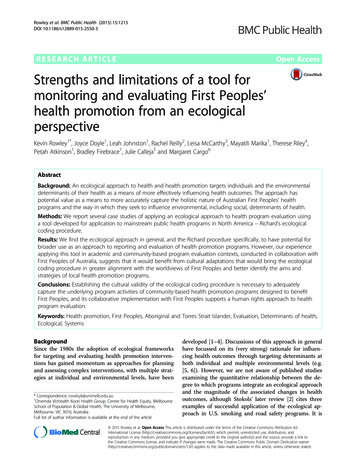
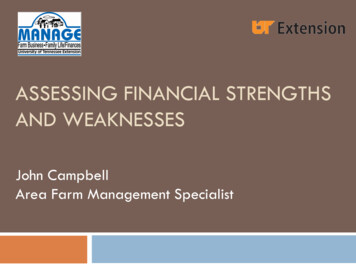
Area Specialists – Farm Management TerritoriesJune, 2012ObionDyerMaconStewartWeakley backFergusonSullivanClaiborne
Figures don’t lie, but liars figure.Mrs. Ruth Barnes, Algebra I Teacher, 1967
Questions
K. Becker, D. Kauppila, G. Rogers, R. Parsons . University of Vermont . D. Nordquist, R. Craven . Center for Farm Financial Management . University of Minnesota . Farm Finance Scorecard . Liquidity Current Ratio Total Current Farm Assets /Total Current Farm Liabilities Measures extent to which current farm assets would pay of current farm liabilities Working Capital Total Current Farm Assets .