Transcription
Online NationFive Years of Growth in Online LearningI. Elaine Allen and Jeff Seaman
Online NationFive Years of Growth in Online LearningI. Elaine Allen, Ph.D.Associate Professor of Statistics & EntrepreneurshipCo-Director, Babson Survey Research GroupBabson CollegeJeff Seaman, Ph.D.Chief Information Officer, Survey DirectorThe Sloan ConsortiumOlin and Babson CollegesCo-Director, Babson Survey Research GroupBabson CollegeOctober 2007
Neither this book nor any part maybe reproduced or transmitted in any form or by any means,electronic or mechanical, including photocopying, microfilming, and recording, or by anyinformation storage or retrieval system, without prior permission in writing from the publisher.The consent of the Sloan Consortium (Sloan-C) does not extend to copying for generaldistribution, for promotion, for creating new works, or for resale. Specific permission must beobtained in writing from Sloan-C for such copying. Direct all inquiries to Sloan-C, at Olin Way,Needham, MA 02492-1200, or to publisher@sloan-c.org.Copyright 2007 by Sloan-C All rights reserved. Published 2007Printed in the United States of America987654321
ContentsExecutive Summary . 1How Many Students are Learning Online? . 1Where has the Growth in Online Learning Occurred? . 1Why do Institutions Provide Online Offerings? . 2What are the Prospects for Future Online Enrollment Growth? . 2What are the Barriers to Widespread Adoption of Online Education? . 3What is Online Learning? . 4Detailed Survey Findings . 5How Many Students are Learning Online? .5Online Enrollment Growth – The Big Picture . 6Online Enrollments – The Details . 7The Online Learning Landscape: Online Learning Framework . 8Online Learning Framework Compared to Previous Results . 11Patterns of Enrollment Growth . 12Future Online Enrollment Growth . 15In for the Long term? . 16Why Online? . 17Barriers to Widespread Adoption of Online Learning . 18Survey Methodology . 22Appendix – Additional Tables and Charts . 23Partner Organizations . 25
Executive SummaryOnline Nation: Five Years of Growth in Online Learning represents the fifth annual report onthe state of online learning in U.S. higher education. This year’s study, like those for theprevious four years, is aimed at answering some of the fundamental questions about thenature and extent of online education. Supported by the Alfred P. Sloan Foundation andbased on responses from more than 2,500 colleges and universities, the study addresses thefollowing key questions:How Many Students are Learning Online?Background: For the past several years, online enrollments have been growing substantially fasterthan overall higher education enrollments. The expectation of academic leaders has been that theseenrollments would continue their substantial growth for at least another year. Do the measuredenrollments match these lofty expectations?The evidence: Online enrollments have continued to grow at rates far in excess of the total highereducation student population, albeit at slower rates than for previous years. Almost 3.5 million students were taking at least one online course during the fall2006 term; a nearly 10 percent increase over the number reported the previous year. The 9.7 percent growth rate for online enrollments far exceeds the 1.5 percent growthof the overall higher education student population. Nearly twenty percent of all U.S. higher education students were taking at least oneonline course in the fall of 2006.Where has the Growth in Online Learning Occurred?Background: Earlier studies in this series have demonstrated that not all institutions of highereducation are equally enthusiastic about online education. It can be expected, therefore, that the long-termgrowth rates for online enrollments will differ by type of institution.The evidence: Virtually all types of institutions of higher education have shown substantial growth,but with some clear leaders. Two-year associate’s institutions have the highest growth rates and account for overone-half of all online enrollments for the last five years. Baccalaureate institutions began the period with the fewest online enrollments andhave had the lowest rates of growth.1
Why do Institutions Provide Online Offerings?Background: The growth of online enrollments has been abundantly clear. Less clear, however, iswhy colleges and universities are moving to online. What specific objectives do they hope to achievethrough their online courses and programs?The evidence: Improving student access is the most often cited objective for online courses andprograms. Cost reduction is not seen as important. All types of institutions cite improved student access as their top reason for offeringonline courses and programs. Institutions that are the most engaged in online education cite increasing the rate ofdegree completion as a very important objective; this is not as important forinstitutions that are not as engaged in online learning. Online is not seen as a way to lower costs; reduced or contained costs are among theleast-cited objectives for online education. The appeal of online instruction to non-traditional students is indicated by the highnumber of institutions which cite growth in continuing and/or professional educationas an objective for their online offerings.What are the Prospects for Future Online Enrollment Growth?Background: Compound annual enrollment growth rates of over twenty percent are not sustainable.The demand for online among potential students is finite, as is the ability of institutions to growexisting offerings or add new ones. Where can we expect the additional growth to occur?The evidence: Approximately one-third of higher education institutions account for three-quarters ofall online enrolments. Future growth will come predominately from these and similar institutions asthey add new programs and grow existing ones. Much of the past growth in online enrollments has been fueled by new institutionsentering the online learning arena. This transition is now nearing its end; mostinstitutions that plan to offer online education are already doing so. A large majority (69 percent) of academic leaders believe that student demand foronline learning is still growing. Virtually all (83 percent) institutions with online offerings expect their onlineenrollments to increase over the coming year. Future growth in online enrollments will most likely come from those institutions thatare currently the most engaged; they enroll the most online learning students andhave the highest expectations for growth.2
What are the Barriers to Widespread Adoption of OnlineEducation?Background: Previous studies in this series have shown that academic leaders have consistentlycommented that their faculty often do not accept the value of online learning and that it takes more timeand effort to teach an online course. To what extent do these leaders see these and other issues ascritical barriers to the widespread adoption of online learning?The evidence: Identification of the most important barriers differs widely between those with onlineofferings and those who do not offer any. Current results replicate our previous studies in identifyingfaculty acceptance and the need for more discipline on the part of students as the most commonconcerns. Academic leaders cite the need for more discipline on the part of online students asthe most critical barrier, matching the results of last year’s survey. Faculty acceptance of online instruction remains a key issue. Those institutions mostengaged in online do not believe it is a concern for their own campus, but do see it asa barrier to more wide-spread adoption of online education. Higher costs for online development and delivery are seen as barriers among thosewho are planning online offerings, but not among those who have online offerings. Academic leaders do not believe that there is a lack of acceptance of online degreesby potential employers.3
What is Online Learning?The focus of this report is online education. To maintain consistency with previous work,we have applied the same definitions used in our four prior annual reports. Thesedefinitions were presented to the respondents at the beginning of the survey, and thenrepeated in the body of individual questions where appropriate.Online courses, the primary focus of this report, are those in which at least 80 percent of thecourse content is delivered online. Face-to-face instruction includes those courses in whichzero to 29 percent of the content is delivered online; this category includes both traditionaland Web facilitated courses. The remaining alternative, blended (sometimes called hybrid)instruction is defined as having between 30 percent and 80 percent of the course contentdelivered online. While the survey asked respondents for information on all types ofcourses, the current report is devoted to online learning only.While there is a great deal of diversity among course delivery methods used by individualinstructors, the following is presented to illustrate the prototypical course classificationsused in this study.Proportionof ContentDelivered OnlineType of CourseTypical Description0%TraditionalCourse with no online technology used —content is delivered in writing or orally.Web FacilitatedCourse that uses web-based technology tofacilitate what is essentially a face-to-facecourse. Uses a course management system(CMS) or web pages to post the syllabus andassignments, for example.30 to 79%Blended/HybridCourse that blends online and face-to-facedelivery. Substantial proportion of the contentis delivered online, typically uses onlinediscussions, and typically has some face-toface meetings.80 %OnlineA course where most or all of the content isdelivered online. Typically have noface-to-face meetings.1 to 29%Schools may offer online learning in a variety of ways. The survey asked respondents tocharacterize their face-to-face, blended, and online learning by the level of the course(undergraduate, graduate, non-credit, etc.). Likewise, respondents were asked tocharacterize their face-to-face, blended, and online program offerings.4
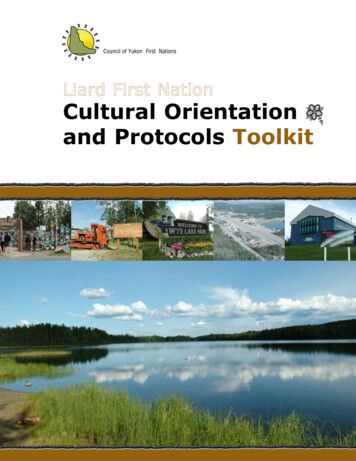
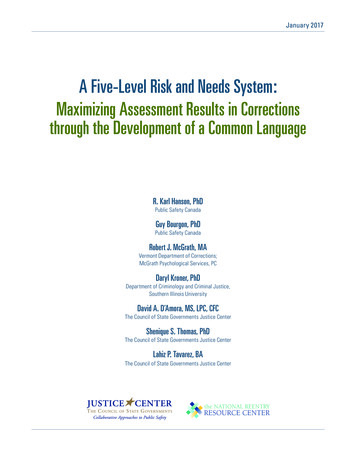
Detailed Survey FindingsHow Many Students are Learning Online?The number of students taking at least one online course continues to expand at a rate farin excess of the growth of overall higher education enrollments. The most recent estimate,for fall 2006, places this number at 3.48 million online students, an increase of 9.7 percentover the previous year. The number of online students has more than doubled in the fouryears since the first Sloan survey on online learning. The growth from 1.6 million studentstaking at least one online course in fall 2002 to the 3.48 million for fall 2006 represents acompound annual growth rate of 21.5 percent. The size of the entire higher educationstudent body has grown at an annual rate of around 1.5 percent during this same period(from 16.6 million in fall 2002 to 17.6 million for fall 2006 - Projections of EducationStatistics to 2015, National Center for Education Statistics). As the following tableillustrates, students taking at least one online course now represent almost 20 percent oftotal enrollments in higher education.Total and Online Enrollment in Degree-granting Postsecondary Institutions – Fall 2002through Fall 2006TotalEnrollmentAnnualGrowth RateTotalEnrollmentStudents Taking atLeast One OnlineCourseAnnual GrowthRate OnlineEnrollmentOnlineEnrollment as aPercent of TotalEnrollmentFall 200216,611,710NA1,602,970NA9.7%Fall 200316,900,4791.7%1,971,39723.0%11.7%Fall 200417,272,0432.2%2,329,78318.2%13.5%Fall 200517,428,5000.9%3,180,05036.5%18.2%Fall 200617,647,7201.3%3,488,3819.7%19.8%More than two-thirds of all higher educationinstitutions now have some form of onlineofferings, with the majority of these providingprograms that are fully online. The distribution ofinstitutions offering online programs and coursesor only courses has not changed significantlyover the past year. The percentage of institutionsoffering fully online programs grew from 31percent to 35 percent, those with no onlineofferings dropped from 37 percent to 34 percent,while those offering online courses but no onlineprograms remained constant at 31 percent. Thenumber of new institutions entering the onlinelearning arena had definitely slowed; mostinstitutions that plan to offer online education arenow doing so.Online Course and Program Offerings Fall 2005 and Fall rogramsOnlineCourses OnlyNo OnlineOfferings5
Online Enrollment Growth – The Big PictureOver the five year period of the survey, the number of students taking at least one onlinecourse has more than doubled. Where has this growth occurred? Are all types ofinstitutions equally represented among those with growing online enrollments, or are thegains concentrated in a few types of institutions?Our previous reportshave consistentlyshown that theOnlineOnlineIncreaseCompoundlargest institutionsEnrollmentEnrollmentFall 2002 toAnnualcommand theFall 2002Fall 2006Fall 2006Growth Rategreatest numbers ofUnder 1500100,984217,445116,46121.1%online enrollments.Beginning in fall1500 to 2999135,715332,840197,12525.1%2002, where nearly600,000 of the 1.63000 to 7499385,812742,415356,60217.8%million online7500 to 14999394,337807,700413,36319.6%students were at thelargest (over 15,00015000 586,1221,387,982801,86024.1%total enrollment)colleges and universities, the pattern has been repeated each year. The most recent datashows no exception; the largest institutions now have nearly 1.4 million online students,representing a compound annual growth rate of 24.1 percent for the four-year period.Interestingly, however, this growth rate is matched by the smaller schools; they began theperiod with smaller numbers, but grew at the same overall rate as the largest institutions.Only the mid-sized schools (3000 to 7499 total enrollments) have lagged in growthcompared to the largest institutions, and even these institutions have posted substantialcompound annual growth rates.Four-year Growth in Students Taking at Least One Online Course –Fall TermWe do not observethe sameconsistently highgrowth rates ntFall 2002 toAnnualwe examine theFall 2002Fall 2006Fall 2006Growth Rateresults by type ofinstitution. institutions providethe largest share ofBaccalaureate130,677170,75440,0776.9%online 24.0%with more onlinestudents at ns than allother typescombined. This pattern has remained consistent over the entire four year period. Growthrates for these associate’s institutions have exceeded those of all the other institutiontypes, and they now command over 54 percent of all online enrollments in U.S. highereducation. Baccalaureate institutions, on the other hand, present a very different picture.In 2002 they included only a small portion (8 percent) of online enrollments and havegrown at the slowest rate. These institutions now enroll less than five percent of the onlinestudent population. All other institution types have displayed growth rates that are onlyFour-year Growth in Students Taking at Least One Online Course –Fall Term6
slightly below those of the associate’s institutions, maintaining a relatively steadyproportion of online enrollments.Mean Number of Students Takingat Least One Online Course – Fall2002 and Fall 2006Fall 2002Fall 2006Public8611,371Private, nonprofit179267Private, for-profit108472Public institutions have consistently led the way in onlineenrollments for every survey year. Each public institutionwith online offerings teaches, on average, close to 1,400online students — a number which far outpaces that forprivate, for-profit and private, nonprofit institutions. Forprofit institutions with online offerings have begun to closethis gap, increasing nearly five-fold in the average number ofstudents enrolled at each institution over the four years.Among all institutions with online offerings, however, theaverage online enrollment at a public institution is still nearlythree times that of a for-profit online enrollment.Online Enrollments – The DetailsOur survey indicates that more than 86 percent of those studying online areundergraduates, which exactly matches the proportion of undergraduates in the overallhigher education student body (Digest of EducationStudents Taking at Least One OnlineStatistics: 2006, National Center for Education Statistics).Course – Fall 2006Over 62 percent of these undergraduates are takingcourses at associate’s institutions, who teach close to 55Doctoral/Research566,725percent of online students at all levels (both numbers areMaster’s686,337well above the 37 percent of the overall higher educationenrollment that these institutions represent — Digest ofBaccalaureate170,754Education Statistics: 2006, National Center for EducationAssociate’s1,904,296Statistics). Traditional baccalaureate institutionscontribute a very small proportion to the onlineSpecialized160,268undergraduate population.The largest institutions teach the greatest number of online students, as they haveconsistently for each survey year. This is due not only to their size, but also because theseinstitutions were early adopters of online education and have continued to expand over alonger period of time.Students Taking at Least One Online Course – Fall 00 Graduate24,05132,73871,93676,368206,803Other For-Credit15,82718,43014,2751,63719,3627
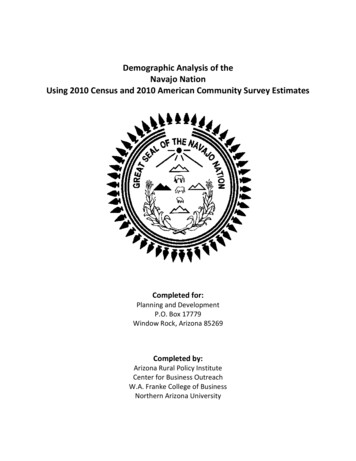
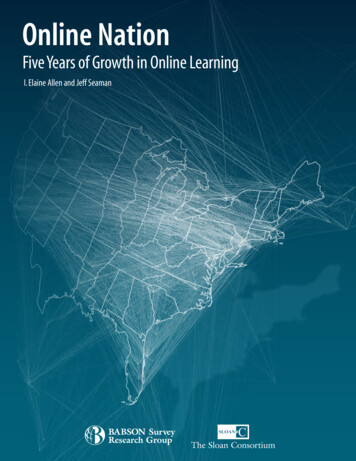
When online enrollments are examined by student type and institutional size, it is clearthat undergraduate students at large institutions are by far the most numerous group.Each of the largest institutions teaches, on average, considerably more online studentsthan institutions of any other size. The average number of online students per institutionshows the expected very strong positive correlation to the size of the institution. While thepattern is true for both undergraduate and graduate-level online enrollments, the slope ofthe lines in the accompanying figure demonstrates that the relationship is much strongeramong the undergraduate population.Mean Online Enrollment by Size of Institution - Fall 20063,000Undergraduate2,500Graduate2,000Other For-Credit1,5001,0005000Under 15001500 – 29993000 – 74997500 – 1499915000 The Online Learning Landscape: Online Learning FrameworkThe survey reports in this series have provided ample evidence that not all institutions seeonline education in the same way. Some believe it to be critical for their long-termsurvival, others see it as a short-term means of boosting current enrollments, and stillothers as something that goes against the very nature of what they are trying to achieve attheir institution. Examining the patterns over time of opinions, practice, and enrollmentsby the control (public/private) of the school, the size of the institution, and the Carnegieclassification has allowed us to obtain a better understanding of the macro-level trends.This approach still misses many of the important determinants of the variability ininstitutional approaches towards online education. We see, for example, that some smallschools are very positive towards online learning while many others are not. Publicschools continue to be in the lead among those embracing online education, but not allpublic institutions are equally positive. In an effort to probe these issues, this year wehave classified all higher education institutions into a five-category online learningframework based on their adoption of, and strategic view towards, online education.8
The online learning framework categories are: Not Interested. Institutions which do not have any online offerings and do notbelieve that online is important to their long-term strategy. As a group they have themost negative view towards online. Non-Strategic Online. Institutions which have some online offerings, but do notbelieve that online education is an important part of their long-term strategy. Theironline offerings tend to be outside of core areas (e.g., a few courses in theircontinuing education program). Not Yet Engaged. Institutions which do not yet have any online offerings but citeonline as a critical long-term strategy for their institution. It can be expected from theirview of online that they intend to provide some form of online offering in the future. Engaged. Institutions which currently have online offerings and believe that online iscritical to the long-term strategy of their organization. These institutions, however,have not yet included online education in their formal strategic plan. Fully Engaged. Institutions which have online offerings that they state are strategicfor their institution and which have fully incorporated online education into theirformal long-term plan.Institutions in each of these categories have very different attitudes towards onlinelearning, utilize different approaches to the possible provision of online offerings, and canbe expected to provide very different components of the future growth in onlineenrollments. By tracking the behavior and attitudes of institutions in each of these groups,and marking transitions as institutions move from one online framework category toanother, we hope to get a better idea about the future directions for online learning in U.S.higher education.Examining each of the categories in turn:Not Interested. These institutions represent about 18 percent of all U.S. degree-grantingpostsecondary institutions (800), but are mostly smaller institutions, providing only 5.5percent of all higher education enrollments. They do not have any online offerings and donot believe that online learning is important to their long-term strategy. As a group, theyhave the most negative view towards online instruction, with only 3.7 percent saying thattheir faculty accept the value and legitimacy of online education and 44 percentdisagreeing with the statement that online degrees have the same level of respect as faceto-face degrees.Non-Strategic Online. About 1,000 institutions (or 23 percent of all higher educationalinstitutions) have online offerings but do not believe that online education is important totheir long-term strategy. They enroll slightly more than 5 million total students (27 percentof higher education enrollments). In contrast, their online enrollments of 350,000represent only 10 percent of all online students for fall 2006.Non-Strategic online institutions are less likely to have a fully online program (32 percentcompared to 54 percent for all institutions with online offerings), and they are also morelikely to report negative faculty attitudes. Only 8 percent report that their faculty acceptthe value and legitimacy of online education compared to a rate of 27 percent for all ofhigher education and 39 percent among those with any online offerings. About one-half of9
these institutions expect their online enrollment to grow in the coming year (compared tothree-quarters of all those with online), and they are the only group containing anymembers who expect their online enrollments to decrease (9 percent, compared tovirtually none among other institutions with online offerings). They are also the least likelyto believe that overall online demand is growing (44 percent versus 70 percent among allschools and 77 percent among those with any online offerings).Not Yet Engaged. This is a small group of institutions (5 percent, or around 250 totalinstitutions) which do not yet have any online offerings, but cite online as a critical longterm strategy for their institution. Most of these institutions are small and their totalenrollments account for only slightly more than one percent of all higher educationenrollments. These institutions are twice as likely to be concerned about the costs ofonline as other institutions with 31 percent citing costs to develop online and 42 percentciting cost to deliver online as barriers. Concern with online retention is also much higherin this group than in any other group of institutions. They are, however, much more likelyto believe that their faculty accept online education (44 percent) than either those with noonline or those with non-strategic online.Engaged. A sizable set of institutions (around 800, or 18 percent of all higher educationinstitutions) currently have online offerings and believe that online is critical to the longterm strategy of their organization. However, these institutions have not yet includedonline education in their formal strategic plan. They represent about 23 percent of allhigher education enrollments (about 4.5 million students) with 17 percent of onlineenrollments for fall 2006. These institutions hold opinions towards online that mirrorthose of the overall higher education universe on such aspects as faculty acceptance (33percent agreeing for both this group and all institutions) and equal level of respect foronline versus face-to-face degrees (27 percent agreement for both this group and allinstitutions). Nearly one-half (46 percent) of these institutions have at least one fullyonline program, 89 percent believe that overall demand for online is growing, and 86percent believe that their own online enrollments will grow over the next year.Fully Engaged. Slightly more than one-third (35 percent) of all higher educationinstitutions (around 1,500 total) are fully engaged in online education. They believe thattheir online offerings are strategic for their institution and they have fully incorporatedonline into their formal long-term plan. Not surprisingly, they also have the most extensiveonline offerings. Fully 69 percent have at least one completely online program. Theseschools enroll 43 percent of all higher education students but represent nearly threequarters (73 percent) of all online students in fall 2006. As a group, these institutions arethe most positive towards online, with far more favorable opinions on such topics asfaculty acceptance of the value and legitimacy of online education (62 percent agreementcompared to 33 percent nationally), equivalent level of respect for online versus face-toface degrees (53 percent compared to 27 percent nationally) and belief in the growth ofstudent demand for online learning (94 percent compared to 70 percent nationally). Theyalso have the highest expectations of their own online enrollment growth, with 87 percentexpecting their online enrollment to increase over the coming year. As a group, theseinstitutions are larger, have positive opinions of online, provide extensive online offerings,and have very high expectations for growth in their online enrollments.10
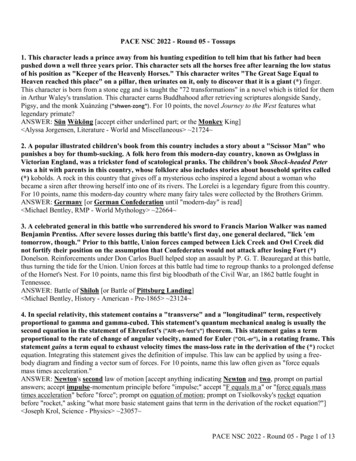
Institutional Characteristics by Stage of the Online Learning FrameworkNumber and Size of InstitutionsFullyEngaged1,539Number of InstitutionsEngagedNonStrategicOnlineNot 897979,858Overall Enrollment 7,574,376 4,067,493Online OfferingsFall 2006 Students Taking at Least One Online Course2,540,315595,683350,99800Percent Students Taking at Least One Online Course33.5%14.6%7.3%0.0%0.0%Percent of Institutions with Fully Online Programs68.8%45.6%32.5%0.0%0.0%Demand for Online Learning is Growing (% Agreeing)93.5%87.9%44.0%86.0%33.5%Percent Expecting Their Online Enrollments to Grow90.4%89.0%54.7%NANAMean Expected Rate of Online Enrollment Growth30.0%24.8%13.8%NANAIncrease Student Access75.7%63.8%41.3%NANAIncrease Rate of Degree Completion43.7%32.0%17.8%NANAEnhance Value of College/University Brand38.8%22.5%16.4%NANAProvide Pedagogic Improvements39.1%21.7%15.2%NANAHigher Costs to Deliver than Face-to-face Courses15.4%14.4%13.9%42.1%16.9%Faculty at my School Accept the Value and Legitimacyof Online Education (% Agreeing)62.1%32.8%8.3%44.0%3.7%Online Degrees have the Same Level of Respect asFace-to-face Degrees (% Disagree
The Sloan Consortium Olin and Babson Colleges Co-Director, Babson Survey Research Group Babson College October 2007 . Neither this book nor any part maybe reproduced or transmitted in any form or by any means, electronic or mechanical, including photocopying, microfilming, and recording, or by any