Transcription
2018 OUTLOOKThrough theLooking GlassTrends in the Capital Markets
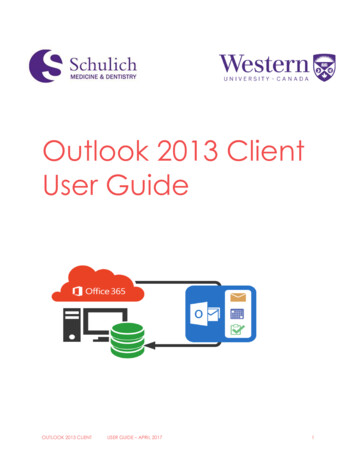
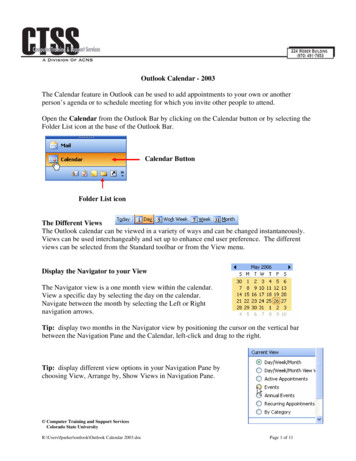
Securities Industry Employees by State0–9991,000–10,00010,001-50,00050,001 Note: As of 2016Source: Bureau of Economic Analysis,Bureau of Labor Statistics2SIFMA 2018 Outlook
WelcomeSIFMA is the voice of the U.S. securities industry. We are a member-driven organization thatadvocates for effective and efficient capital markets.We represent the broker-dealers, banks and asset managers whose nearly 1 million employeesprovide access to the capital markets, raising over 2.5 trillion for businesses and municipalitiesin the U.S., serving clients with over 18.5 trillion in assets and managing more than 67 trillionin assets for individual and institutional clients including mutual funds and retirement plans.Our members represent 75% of the U.S. broker-dealer sector by revenue and 50% of the assetmanagement sector by assets under management. We convene more than 13,000 financialprofessionals on approximately 100 committees and societies, as well as countless task forcesand working groups. Together, we are invested in America.This report contains our insights into the markets, the industry’s viewpoints on critical policy issuesand several helpful resources.With best regards,TIMOTHY C. SCHEVELISA KIDD HUNTKENNETH E. BENTSEN, JR.President and CEOExecutive Vice President,President and CEOJanney Montgomery ScottBusiness InitiativesSIFMA2017 ChairCharles Schwab & Co., Inc.SIFMA Board of Directors2018 ChairSIFMA Board of Directors3
Market InsightsThe capital markets fuel the U.S. economy, providing 65% of funding foreconomic activity. Today, GDP growth is slowly starting to pick up and thefinancial system is strong.And yet, the U.S. economy has experienced the slowest economic recoveryof the post-war period. Real gross domestic product stands at only 112% ofthe 2007 level, and the economy has been stuck in low gear.The financial system has absorbed hundreds of new regulations in the decadesince the financial crisis. While many of those regulations have made thefinancial system safer and more resilient, they are not without cost. To meetthese requirements, financial institutions have built up excess capital andliquidity. Liquidity1 is up 4x for the CCAR2 banks since 2006. This is exaggeratedfor the G-SIBs3, those exposed to a longer list of regulations given theirincreased complexity and size, with liquidity up almost 5x. This is excessliquidity that remains trapped in the system. We wonder how much stronger theeconomy could be if financial institutions had the flexibility to release more ofthis excess capital and liquidity into the economy.1Liquidity (cash deposits at banks) / total assets.Comprehensive Capital Analysis and Review (CCAR) essreleases/fles/bcreg20170203a4.pdf2Global Systemically Important Banks 1117-1.pdf3
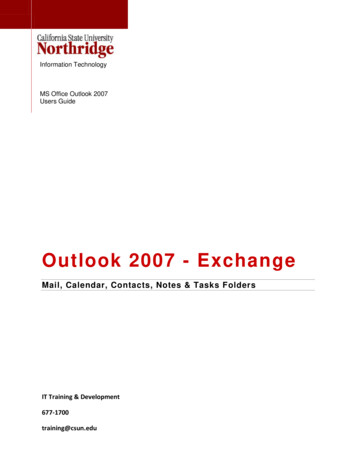
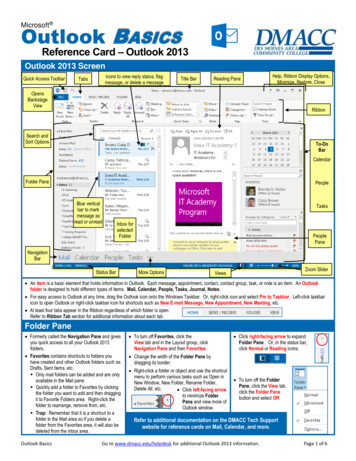
MARKET INSIGHTSUS Capital Markets are the Largest in the WorldThe U.S. equities market is 2.4x and the U.S. bond markets are 1.6x the size of the EU, the #2 playerglobally for each segment. U.S. capital markets enable debt issuance – a more efficient, stable andless restrictive form of borrowing for corporations – to fuel growth, while bank lending is moreprevalent in other regions (80%/20% in the U.S., reversed in other markets). U.S. capital marketsprovide 65% of total funding for economic activity and are multiples of U.S. GDP, thereby drivingeconomic growth for the country (Japan’s GDP is around one-fourth that of the U.S., skewing itsresult in the chart on the next page).EquityMarkets( 70T)GlobalGlobalEquityMarkets( 70T)Other DMs, 0.5%Singapore,1%EMs, 17%Australia,2%US, 39%Canada, 3%HK, 5%Japan, 7%China, 10%EU, 16%Global Bond Markets ( 92T)Global Bond Markets ( 92T)Canada,2%Australia, Singapore,0.4%2%HK, 0.2%EMs, 2%Other DMs,0.5%Japan, 13%US, 43%China, 10%EU, 27%6SIFMA 2018 OutlookNote: As of 2016; DM DevelopedMarkets; EM Emerging Markets;HK Hong KongSource: World Federation ofExchanges, Bank of InternationalSettlements
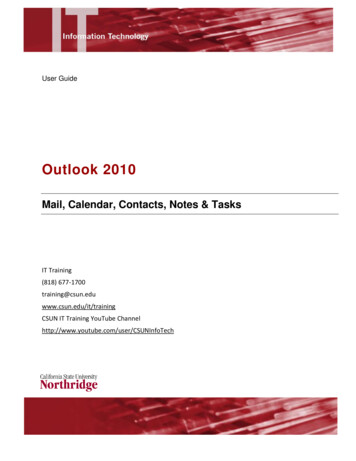
Debt Capital Markets Dominate Over Bank Lending in the USDCM Dominates Over Bank Lending in the EUJapan80%USDCMNote: As of 2016;DCM Debt Capital MarketsSource: Federal Reserve,ECB, Bank of JapanBank LendingCapital Markets Fund 65% of US Economic ActivityCapital Markets Fund 65% of US Economic 13%10%55%5%20%26%4%4%53%50%71%Note: As of 2016; China2014. ECM Equity CapitalMarkets17%6%USEuro AreaECMDCMJapanBank LendingSource: OECD, ECB, Bankof Japan, National Bureauof Statistics of ChinaChinaOtherUS Capital Markets Multiples of GDPUS Capital Markets Multiples of %Note: As of 20160%USEUECM/GDPJapanDCM/GDPChinaSource: World Federationof Exchanges, Bank ofInternational Settlements,Bureau of Economic Analysis7
MARKET INSIGHTSIntersection of Financial Technologies &Traditional Business ModelsNew financial technologies (fintech) present both opportunities and threats to financialinstitutions. Some fintech firms are becoming new competitors, while others present collaborativeopportunities. Fintech also provides the ability to increase efficiencies and decrease costs.A recent EY survey1 asked about the key disruptive forces impacting their sector.27% noted digital technology and 26% indicated changing customer behaviors,which we view as going hand-in-hand with fintech decisions.Whatever the use case or challenge to solve may be, financial institutions across the spectrum –banks, broker-dealers, asset managers, etc. – are reviewing and analyzing fintech options intheir strategic planning decisions. These discussions include using fintech to: update legacysystems, adopt new technologies, invest in cybersecurity and improve the client experience.A Confluence survey2 indicated 49% of asset managers surveyed identifiedtechnology innovation as a factor that will cause fundamental change in theiroperating model over the next 24 months.While financial institutions cannot ignore what is happening in fintech, adoption of newtechnologies may not be as simple as strategic funding and implementation decisions.New technologies may face regulatory constraints. As many fintech offerings are newto the firms looking to utilize them, they are new to regulators as well. Regulators are assessingpotential risks arising from usage of fintech contributions.1The 2017 EY Global Capital Confidence Barometer surveyed 3,000 executives in 43 countries across14 sectors, including financial services.2The 4Q17 Confluence Trend Survey included 125 online interviews with asset managers and third-partyadministrators.8SIFMA 2018 Outlook
ecurityAs financial institutions make strategic decisions, IT expenditures are considered to:1.Update legacy systems: Many financial institutions maintain legacy technology which is notas cost efficient as modern platforms, and opportunities exist to update back office systems.For example, moving to automated systems and away from reliance on manual processes canreduce errors and minimize risks.2.Adopt new technologies: As firms look to upgrade systems, it is natural to assess new fintechoptions. For example, regulatory technology (regtech) offerings can help firms keep up withnew reporting requirements in a more efficient manner. Distributed ledger technology canhelp automate bookkeeping processes. Or, artificial intelligence and big data applications canbe used to improve customer service and monitor portfolios. Accenture estimates investmentbanks could save 8 billion per annum by utilizing blockchain technology, on a 30 billion costbase (27% of total).3.Invest in cybersecurity: Firms are also increasing investments in cybersecurity. A 2017 Duff &Phelps survey (of 183 senior financial service professionals) indicated 86% of financial servicesfirms plan to increase spending and resources on cybersecurity this year, up from 60% lastyear. This is essentially not an optional spend bucket – companies must protect their clientsfrom system breaches, which present serious reputational risks (and potential regulatory orlegal action).4.Improve client experience: Please see the case study on the next page.9
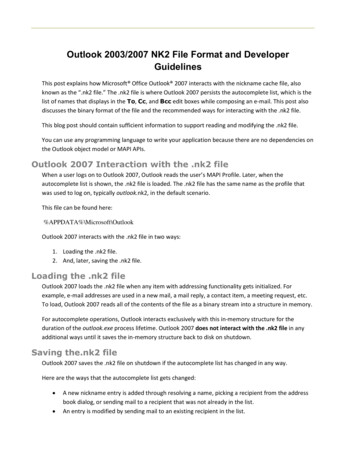
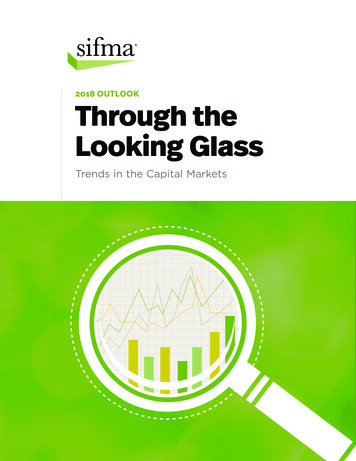
MARKET INSIGHTSCase Study: Improving the Customer ExperienceAs new technologies emerge, client behavior changes. Many clients now prefer to do simpletransactions – deposit checks, monitor 401K balances or even trade stocks – on mobile devices. Wenote that branches remain to serve the big decisions, such as advanced financial planning aroundmajor life events, where clients still prefer the human touch.77% of Americans now own a smart phone, and mobile usage for financial transactions, whilelagging, is moving directionally in line (53% in 2015, 10 pps since 2011). One area firms areadopting technology to meet shifting client behavior is robo advising, where the top five firmsrepresent around 95% of AUM (based on a July 2017 report by Barron’s).Mobile Usage is on the RiseMobile Usage Is on the 0%77%20112012Smart Phones43%33%29%22%53%20132014Usage on Smart Phones2015Usage on All PhonesSource: Federal ReserveRobo AdvisingRobo AdvisingAUMAUMFirm F, 0.6%Firm G,0.3%Firm H,0.1%Other, 5%Firm E, 3.3%Firm D, 5.2%Firm C, 7.0%Firm B,14.9%Firm A, 63.9%Source: Barron’s, BackendBenchmarking,SIFMA estimates10SIFMA 2018 Outlook
Robo advising, which allows wealth managers to expand their services to a broader client-base, isprojected to grow in the U.S. to 2.2T by 2020 from 300B in 2016, a 49% CAGR. Many firms haveinvested to varying degrees in robo advice platforms to enhance their customers’ financial adviceexperience, blending technology enhancements with their firm’s investment portfolio managementexpertise. AUM in Intelligent Portfolios, Schwab's robo segment, now represents 8.6% of totalAdvice Solutions AUM, up 8.4 pps since its start in 2015.Solid Growth Forecasted for Robo Advice in the USSolid Growth Forecasted for Robo Advice in the 0001.85008900425003000020162017E2018EAUM ( B, LHS)2019E(2)2020ESource: Aite, Statista,SIFMA estimates# Clients (M, RHS)Schwab Intelligent Portfolios AUM Growing as a % of Total25Schwab Intelligent AUM Growing as a % of %0%0.401Q15 2Q15 3Q15 4Q15 1Q16 2Q16 3Q16 4Q16 1Q17 2Q17 3Q17Avg. Intelligent AUM ( B)% Total Advice Solutions AUM-2%Source: Company reports,SIFMA estimates11
MARKET INSIGHTSTotal Fixed Income Outstanding 3.4% YOY,Total Issuance 11.8% YOYAround 80% of total fixed income markets outstanding consists of UST, Mortgage and Corporates(35%, 23% and 22% of total outstanding respectively). Mortgage issuance was 13.5% YOY, andMunis, representing 9.7% of the market, saw a 10.6% increase in issuance. UST and Corporatesissuances were up only 2.2% and 2.4% respectively, as market structure issues continue to weighon these segments (discussed later in this report).US Fixed Income Markets Outstanding ( B)US Fixed Income Markets Outstanding ( 2007UST20082009Mort gage2010Corporat es2011Munis20122013Agency2014ABS20152016 Market sUS Fixed Income Markets Issuance ( B)US Fixed Income Markets Issuance ( 8UST12SIFMA 2018 2014Agency2015ABS2016Note: Issuance is longterm instruments onlySource: SIFMA
Total Listed Equities Market Cap 9.1% YOY,Total Issuance -23.0% YOYTotal listed equities market capitalization continues to climb ( 10.0% CAGR since the 2008bottom) as markets move higher: market cap 136% vs. Dow Jones 125%, S&P500 148% andNasdaq 241% since 2008. Yet, issuance is not keeping pace: -1.0% CAGR since 2008, decreasingon average 20% each year for the last two years. We discuss the negative impact of regulatoryburdens on IPOs and the corresponding costs to public companies later in this report.US Equity Market Capitalization ( B)US Equity Market Capitalization ( 07200820092010201120122013201420152016US Equity Market Issuance ( B)350US Equity Market Issuance ( 2011Secondary OfferingsPreferred Stock17418620142015IPOs21231542016Source: SIFMA13
MARKET INSIGHTSRegulatory Environment Leads to Decline in IPO Deal Value and # of DealsRegulatory Environment Leads to Decline in IPO Market Value and # of Deals492110469100807045040436390350330192237605079 6640164 1671851316724234169972501301048350121503020(50)US Firms ( B)Non-US Firms ( 150)# Deals (RHS)Number of Small Cap IPOs (as aNumber% of Total)DeclinedPostof SmallCap IPOs(asCrisisa % of Total) Declined Post mall Cap (RHS)Note: As of November 2017; Large cap 10B; mid cap 2B - 10B; small cap 2BSource: Dealogic14SIFMA 2018 20102009200720062005200420032002200120002008Mid Cap90%87%0%Large 1%YTD40%98%95%78%76%
Regulations Hindering Capital FormationThe increased regulatory burden and corresponding costs of becoming and remaining a publiccompany are a few of the factors that continue to hinder capital formation in the U.S. Looking atthe number of IPOs (number as opposed to value prevents skewing of results for large deals, suchas Alibaba in 2014), while averaging 177 per annum from 2004 to 2007, the IPO count is only 111 onaverage over the last three years. The IPO count recovered somewhat YTD to 121, yet remains 48%below the recent 2014 peak. 2014 saw 234 IPOs, as companies rushed to list to take advantage of along-awaited surge in investor confidence (after the crisis) and capture the benefits of rising stockmarkets.The U.S. represented only 14% of total global IPOs in 2016, despite averaging 62% in the late 1990s(dropping to 35% in the early 2000s). Also on the decline is the number of small cap IPOs as apercent of total U.S. IPOs. This figure remains in the mid- to high-80% range since the financialcrisis, down from the low- to mid-90% range pre-crisis.Small cap IPOs represent the dream made possible by the capital markets. An individual orfamily creates a product or company, works hard to develop the concept and then monetizestheir investment. The decline in the number of small cap IPOs implies fewer innovative Americancompanies see the benefit of going public in today’s regulatory environment.The JOBS Act Five Years LaterWhile it is difficult to separate market factors from the passing of the JOBS Act in 2012 asthe driver of IPOs, the number of IPOs did increase from 2012 to 2014. According to the U.S.Treasury’s report on capital markets, 87% of IPO filings since 2012 filed under the JOBS Actas EGCs (emerging growth companies with 1B annual revenue and publicly traded shares 700M). A SEC staff report noted small IPOs (firms seeking proceeds up to 30M) were 22% ofall IPOs from 2012-2016, up from 17% from 2007-2011.However, IPO activity has been relatively muted since 2014, and additional regulatory changesmay be needed to improve capital formation.15
MARKET INSIGHTSNumber of US Public Companies -46%Since 1996 LevelsDespite the significant market runup since 2013, IPOs are not keeping pace. The number of publiccompanies also continues to decline as regulatory costs climb. Companies instead are remaining in(or returning to) the private markets.IPOs Not Keeping Pace with Stock Market 7350%300%250%2119201415910554 4 51 11312837 6 66 65911200%1411113675679 Q173Q17QTD-51/2/16IPOs ( B, LHS)Nasdaq Performance (RHS)S&P 500 Performance (RHS)3001/2/15IPOs Not Keeping Pace with Stock Market Run-100%-50%Note: As of November2017; Performance indexedto 1Q09; Large dealsremoved to normalize data:4Q09 7.5B Santander;4Q10 18.1B GM; 2Q12 16.0B Facebook; 3Q14 25.0B AlibabaSource: Bloomberg,Dealogic# Public Companies -46% Since 1996, a -3% CAGR# Public Companies -46% Since 1996, a -3% CAGR9,0008,0007,000-3% CAGR6,0005,0004,0003,0002,0001,00016SIFMA 2018 620052004200320022001200019991998199719960Note: Listed domesticcompanies in the U.S.Source: World Bank
Case Study: Private Market AccessAs discussed, smaller companies continue to face difficulties accessing the public listing markets.An IPO, however, provides an opportunity for employees to monetize vested shares. As companieschoose to stay private longer, they can find it difficult to continue to incentivize employees withoutliquidity opportunities. In March 2013, to bridge this gap, Nasdaq and SharesPost announced theNasdaq Private Market (NPM) joint venture to establish a marketplace providing liquidity programsfrom institutional sources to private growth companies. NPM has grown to 6.1 billion in totalvolume since its inception.Unfortunately, private markets are generally only available to institutional and accreditedinvestors, meaning the vast majority of retail investors continue to be blocked from investing inthese companies. Many of the companies utilizing NPM programs are technology companies, theinnovators in today’s society, often representing the future way of doing business in many sectors.Yet, most retail investors remain barred from this avenue of wealth creation.NPMVolumeNPM VolumeNPMShareholdersNPM Shareholders11%NPMCompanyValuationValuationNPM Company16%11%34%29%37%17%44%23%26% 10M 10M- 25M 50M- 100M 100M27%24% 25M- 50M 100100-250250-500 500 1B 1B- 3B 3BNote: Cumulative since 2013Source: Company reports17
MARKET INSIGHTSNumber of Dealers DeclinesThe number of registered U.S. broker-dealers is down 31% from the 1997 peak to 3,835, afteraveraging 5,449 in the 1990s. The number of primary dealers – vital market participants inmaintaining efficient UST markets – has also declined. While averaging 38 in the 1990s, this numbersettled in the low 20s after rebounding from only 17 in 2008.While some of the pre-crisis decline in the number of broker-dealers can be attributed to normalindustry consolidation to gain scale, the current number of firms is down 23% since 2007 (-3%CAGR). We infer the recent decrease in numbers is at least partially attributable to an increase incompliance costs from the hundreds of new post-crisis regulations to which financial institutionsare now subject.The increase in compliance costs, which potentially forced some broker-dealers out of the business,can also divert the focus and resources of active broker-dealers. Firms, particularly smaller oneswhose overall compliance costs represent a larger percentage of total expenses, may have to shiftor delay spending on innovation, enhancing the customer experience or improving technologiesfor cybersecurity to compliance resources. This leaves investors with fewer choices of firms andpotentially less (or slower to market) innovation.Number of Dealers 1520165# Broker-Dealers (LHS)18SIFMA 2018 Outlook# Primary Dealers (RHS)0Note: FINRA-registeredbroker-dealers onlySource: Federal Reserve,FINRA
Excess Capital and Balance Sheet LiquidityRemain Trapped in the SystemDespite the increased health of the U.S. financial system – CCAR banks 550 bps above the 7%CET1 capital requirement, G-SIB banks 400 bps above the international SLR (leverage) standard –the regulatory burden on financial institutions remains. Adherence to all of the new requirements,some of which are duplicative and force firms to hold double the reserve for the same riskmitigant, has created a buildup of excess capital and balance sheet liquidity (CCAR firms’ liquidity 9.6 pps since 2007, G-SIBs 11.7 pps). This is preventing investment in new plant, equipment andsoftware. Additionally, loan growth is not keeping pace with GDP growth, despite loan growthhistorically being multiples of GDP growth (2x greater on average from 2000-2007, barely keepingpace since 2010).Excess Liquidity Trapped in the SystemExcess Liquidity Trapped in the System17CCAR15Non 3.07.7FY1615.413.57.8Note: Liquidity (cash deposits atbanks) / total assets3Q17Source: Companyreports, CreditSights,Bloomberg, SIFMAestimatesCCAR Banks Loan Growth Less Than US GDP GrowthCCAR Banks Loan Growth Less Than US GDP 3.8% 2.6%-5%-10%4.1%4.0%3.3%4.4%2.4%2.1%CCAR Loan Growt h4.0%4.0%5.0%2.8%3.5%2.6%US GDP Growt Source: Companyreports, CreditSights,Bloomberg, Bureauof Economic Analysis,SIFMA estimates19
Industry ViewpointsThe U.S. capital markets are deep and mature, and the financial industry thatprovides access to them is subject to robust and ever-growing regulatoryoversight. In response to the Presidential Executive Order on Core Principlesfor Regulating the United States Financial System, the U.S. Department of theTreasury has undertaken a comprehensive review of this complex regulatoryinfrastructure - including prudential and capital markets frameworks - to ensurepolicies promote growth, job creation, investment and financial stability.With over a 100-year history of substantive contributions to the policymakingand regulatory process, SIFMA works on issues critical to the industry’s abilityto facilitate the development of and access to the capital markets. TheseIndustry Viewpoints are the consensus views of more than 13,000 on-theground personnel from several hundred SIFMA member firms. In 2017, our workhas included over 130 comment letters to federal, state and industry regulators;9 testimonies before federal and state legislatures; 16 amicus briefs in courtcases addressing key legal issues facing our industry; nearly 100 conferencesand events; and countless roundtables to exchange industry best practices.SIFMA also led several initiatives related to critical industry operations includingthe successful conversion to the shortened T 2 settlement cycle and multipleefforts around cybersecurity and business continuity planning.
INDUSTRY "There is likely no greater threat to financial stabilitythan a large-scale cyber event.”Kenneth E. Bentsen, Jr., President and CEO, SIFMATestimony before the House Financial Services Committee Subcommittee on FinancialInstitutions and Consumer Credit, November 2017Cybersecurity is a top priority in the financial industry to ensure the security of customer assetsand information and the efficient, reliable execution of transactions within markets.The financial industry is committed to furthering the development of industry-wide cybersecurityinitiatives that protect our clients and critical business infrastructure, improve data sharingbetween public and private entities and safeguard customer information. An effective and efficientcybersecurity policy is achieved most easily through harmonized, risk-based global standards thatleverage extensive investments already made. The NIST Cybersecurity Framework represents apotential global standard.SIFMA is actively engaged in coordinating the effort to support a safe, secure informationinfrastructure, which provides security of customer information and efficient, reliable executionof transactions. We continually work with industry and government leaders to identify andcommunicate cybersecurity best practices for firms of all sizes and capabilities, and educate theindustry on evolving threats and appropriate responses.SIFMA Completes Quantum Dawn IVCybersecurity Exercisewww.sifma.org/cybersecurity-resourcesOn November 7–8, more than 900 participants from over 50 financial institutions, governmentagencies and regulators participated in an industry-wide simulation of a large-scale cyberattack onthe financial markets. "A clear takeaway from the exercise is the importance of a robust partnershipbetween the industry and government grounded in information sharing. No single actor – not thefederal government, nor any individual firm – has the resources to protect markets from cyberthreats on their own," said Kenneth E. Bentsen, Jr.22SIFMA 2018 Outlook
PERSONAL DATA “As we continue to grow this digital economy, it’s becomeapparent that the most important currency is an individual’spersonal information. As an industry we have an obligationand a responsibility to protect it.”Lisa Kidd Hunt, Executive Vice President, International Services and Special Business Development,Charles Schwab & Co., Inc. and Chair, 2017-2018 SIFMA Board of Directors2017 SIFMA Annual Meeting, October 2017The ability to gain data through technology has created opportunities for financial firms to betterengage with clients and build environments where investors can access the information they needto make informed decisions. An individual’s personal information is invaluable, and its protection isof paramount importance.The financial industry is committed to ensuring the safety of the clients we serve at every turn.SIFMA is coordinating a broad-based industry effort to protect a customer’s financial information,with a focus on investors' right to access their own data. We are creating a set of industry-wideprinciples for protecting, sharing and aggregating customer financial information. We will look atstandard contracts and other ways that we may promote transparency, efficiency and trust in themarketplace.With the financial services industry a top target, facing tens of thousands of cyberattacks eachday, the exercise underscored the critical need for an effective allocation of cybersecurityresources at financial institutions. Large financial institutions report that approximately 40 percentof corporate cybersecurity activities are compliance-oriented rather than security-oriented.Enhanced harmonization of regulatory standards and supervision to reduce the amount ofduplicative or redundant rules would help enable firms to devote more resources to security andbetter protect investors.2323
INDUSTRY VIEWPOINTSCONSOLIDATED AUDIT TRAIL (CAT)www.sifma.org/consolidated-audit-trail“The CAT would be the world’s largest data repository forsecurities transactions. In light of increasing cyber risk, weurge regulators to study the costs and benefits to determineif the collection, storage, and use of personally-identifiableinformation (PII) is necessary.”Randy Snook, Executive Vice President, SIFMAPress Release: SIFMA Requests Delay in CAT in Light of Ongoing Concerns, November 2017In response to the “flash crash” in 2010, the Securities and Exchange Commission (SEC) has directedself-regulatory organizations (SROs), comprising securities exchanges and the Financial IndustryRegulatory Authority (FINRA), to develop and implement a Consolidated Audit Trail (CAT) that willenable regulators to efficiently and accurately track all activity throughout the U.S. for equities andlisted options. Thesys Technologies LLC was selected by the SROs in January 2017 to build the CAT.The design of this system will allow regulators to link every order through its entire life cycle,including cancellations, modifications and executions. When developed, the CAT will be a singlecomprehensive database that will link all orders with the account holder or person who has tradingdiscretion over the account, thereby enabling regulators to conduct cross-market analysis whileobtaining and merging together large volumes of disparate data from different entities.SIFMA advocates for a secure CAT system that expedites the retirement of duplicative systems,while promoting an inclusive governance structure and equitable funding model. As developmentcontinues to support this major initiative, SIFMA is engaged with the SEC, the SROs and Thesys ondata security and implementation issues.Industry Shortens Settlement wing a multi-year broad-based industry initiative, on September 5, 2017 the financial servicesindustry successfully transitioned to a shortened standard settlement time frame of trade date plustwo days (T 2) for in-scope securities. A fundamental change to settlement practices and the mostsignificant operation change in two decades, the new two-day settlement cycle reduces risk andenhances U.S. market structure while improving market safety and providing efficiency for investors.24SIFMA 2018 Outlook
MARKET STRUCTUREwww.sifma.org/market-structure“Reg NMS has also contributed to a highly complex stockmarket with a significant focus on the speed of execution.”T.R. Lazo, Managing Director and Associate General Counsel, SIFMAFuture of Reg NMS is a Top Issue, June 2017The structure of our financial markets must be continually evaluated to ensure regulation evolveswith the dynamic marketplace. It’s important to recognize the clear distinctions between the equityand fixed income markets; while there is an optimal market structure for each, there is no one-sizefits-all solution.The adoption of Regulation NMS in 2005 has had
invested to varying degrees in robo advice platforms to enhance their customers' financial advice experience, blending technology enhancements with their firm's investment portfolio management expertise. AUM in Intelligent Portfolios, Schwab's robo segment, now represents 8.6% of total Advice Solutions AUM, up 8.4 pps since its start in 2015.