Transcription
Level 6 Spreadsheet 6N4089Section 1 –Spreadsheet DesignContents1.Assess the suitability of using a spreadsheet to achieve a given requirement from a givenspecification . 1Advantages of using Spreadsheet Software. 1Disadvantages of using Spreadsheet Software . 2What are the differences between Spreadsheet Software and Database Software? . 32.Recognise the importance of the main stages of spreadsheet design. 3Input . 4Processing . 5Output . 73.Implement the Design . 8Worksheet Layout . 84.Evaluate Spreadsheet after Implementation . 10RMN
Section 1: Spreadsheet Design1. ASSESS THE SUITABILITY OF USING A SPREADSHEET TO ACHIEVE A GIVENREQUIREMENT FROM A GIVEN SPECIFICATIONWhen faced with a set of requirements or a task it is important to decide how the task would bebest completed. Should the task be completed using a manual method with pen and paper orshould software be used. If software is the most suitable method then it is important to decideon the correct software type to complete the task. Should a spreadsheet software, databasesoftware or word processing software be used?To get the correct answer to this question it is important to first consider what functions andactions are required from the spreadsheet?Collating results, research and figures or collecting numerical information can prompt the use ofa spreadsheet. Spreadsheets may not be required for storage of all data but it is a great way toorganise, sort, tabulate and calculate data. Spreadsheets can also generate graphs, filters, pivottables and calculations (with the correct answer!).If the data is very detailed and too involved to manage on paper, a spreadsheet can be the mostsuitable option. Although the data input can be a lengthy process for large documents, theorganised storage and searching capabilities will make the information easy to manage, back upand store.ADVANTAGES OF USING SPREADSHEET SOFTWARE INCLUDE THE FOLLOWING: Storage of information in a spreadsheet is clear orgainsed, easy to access and savesphysical space. Calculation of data using formula and functions is immediate, accurate and reduces therisk of human error. Information can be easily updated, amended and reprinted therefore it is very flexible. Data can be quickly sorted, searched by comparison to manually searching throughpaper. Spreadsheet software (Microsoft Excel) is usually integrated with other software packageand the data stored in them are easily transferable. Formula and functions within spreadsheet software can allow the user to create aspreadsheet based on a very particular set of needs or requirements.Page 1These notes have been compiled by Rynagh McNally for students of Monaghan Institute.
DISADVANTAGES OF USING SPREADSHEET SOFTWARE INCLUDE THE FOLLOWING: When a spreadsheet is scaled to a larger volume of data spreadsheet software can oftenfail or give errors. Spreadsheets are susceptible to human error. If the user makes an error in a formula every calculation based on that formula will bewrong. Spreadsheet cannot create reports like databases. Spreadsheet are not designed for collaborative work sharing violations can occurbetween users who access the same document on a network at the same time, causingcreating different copies of one spreadsheet to be created. Poor ability to scale. To use spreadsheets a computer is necessary and to access the information away fromthe computer, printing facilities are required. Spreadsheets are restricted to a finite number of records (1,048,576 rows by 16,384columns).WHAT ARE THE MAIN USES OF SPREADSHEET SOFTWARE?1.Modeling and Planning8.Calculations e.g.Adding, Subtracting,2.Household Finance Planning3.Business Accounts and Budgeting9.4.Invoices10. Collect data from different sources e.g.5.Wages6.Predictions / Simulations7.Statistical analysisBreak even analysis.Creating Graphs e.g. bar chart, pie chart.phone number, prices.11. Explore and interpret data in order todraw conclusions for businessPage 2
Section 1: Spreadsheet DesignWHAT ARE THE DIFFERENCES BETWEEN SPREADSHEET SOFTWARE AND DATABASESOFTWARE?DATABASESWhen working with large repositories of information databases are more preferable tospreadsheet software.Database software can allow many users to access the information at one time whilespreadsheet software cannot.The features of databases include the creation of tables, relationships, forms, reports andqueries among others.SPREADSHEETSSpreadsheet software allows the use of a different set of features for example graphs, formula,functions, conditional formatting and others.Spreadsheet software is much more user friendly than databases, users with limited knowledgeof the software can use it effectively this is not always the case with database software.2. RECOGNISE THE IMPORTANCE OF THE MAIN STAGES OF SPREADSHEET DESIGNInputProcessOutput Data Type Data Collection End Users Formula & Functions Formatting Validation and Verification Displayed Data Printing & Reports Reediting and AccuracyPage 3These notes have been compiled by Rynagh McNally for students of Monaghan Institute.
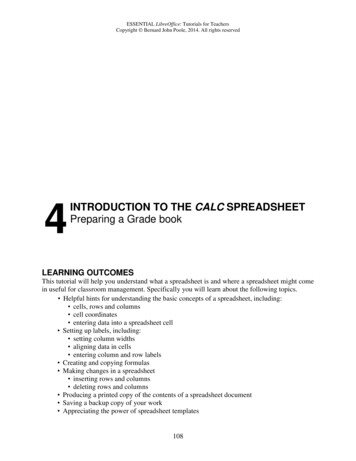
INPUT DATA REQUIREDWhen creating a spreadsheet is it important to carefully plan the spreadsheet to ensure it isreadable and has a clear lay out. Consider the following factors about the information and anyother that may be relevant:1. DATA TYPE: What type of data is being included? Will it be text, numeric, date, time orpercentage, etc.?2. DATA COLLECTION: How will the data be collected? Will it be inputted manually? Is there aneed for a data capture form?Will the data be inputted from another data sourceautomatically?3. END USER: Who will use the spreadsheet and input the data? Will they need to have adetailed knowledge of formula? Should data validation be put in place for the end user?Should the spreadsheet be protected from accidental damage by the end user?DATA CAPTURE FORMData is usually collected through adata capture form and it is veryimportant to ensure that all datarequired for the spreadsheet isrequested by the data captureform. For example when collectdata for the college in MonaghanInstitute the following is some ofthe information that is requested.Using this form a comprehensivespreadsheet regarding the detailsof every student in the collegecould be created. From the datacollected it would be possible todetermine data types, validationrequired, etc.Page 4
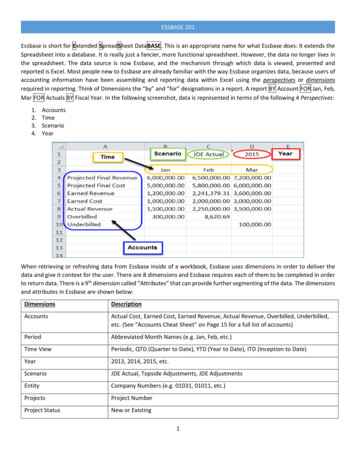
Section 1: Spreadsheet DesignThe following are two examples of data capture forms for a wages spreadsheet.Page 5These notes have been compiled by Rynagh McNally for students of Monaghan Institute.
PROCESSING REQUIRED FOLLOWING DATA INPUTWhen the data has been input into the spreadsheet it needs to be processed. The designer of thespreadsheet should consider the following processing for the document among other details:1. FORMATTING: How should it be formatted consider fonts - how many font styles have beenused and are the fonts san serif and easy to read on screen and on paper? What colour, size,orientation, italics, bold, alignment, borders should be used? Should the company logo orappropriate images be added to the spreadsheet to help the design?2. ORGANISED DATA: How will it be organised - will the information need to be filtered orsorted, have key input and output areas been highlighted clearly? Has the information beenlaid out across the top from the left and down the side to the right? Have ranges beenappropriately named for selection and use in formula?Page 6
Section 1: Spreadsheet Design3. FUNCTIONS, FORMULA AND PROCESSING: How will the data which is inputted into thedatabase be processed? What functions or formulas have been applied? Do they give therequired output? Have graphs been applied to allow the end to see the data clearly? Is therea need for conditional formatting and has it been applied appropriately?4. END USER CONSIDERATIONS: Does the database complete the requirements of the user?Can validation tools used to limit data entry and ensure it is entered correctly? Shouldcomments be added to help the end user understand the database?OUTPUT – EXPECTED RESULTSAfter the input and processing have been decided the output of the spreadsheet is usually thenext consideration. There are two main considerations here:HOW WILL THE OUTPUT BE DISPLAYED AND DOES THE OUTPUT MEET THEEXPECTATIONS OF THE END USER?The data is usually presented either printed on paper or in another file format. The designershould consider what printing features and formatting should be implemented:1. PRINTING: For example have suitable borders been applied? Can the end user print adocument to one page by scaling? Is there a page header on the document? Have columnheadings been repeated for every page of the report? Has the information been alignedcorrectly on the page? What margins have been used? How is the page orientated? Are thecolumn and row headers showing? Are the gridlines turned on? Is the page number or filepath of the document show in the header or footer? If the document is a report or receipthas it been formatted professionally with the company logo?2. ON SCREEN: What file format has the document been saved in? Have the company’s profitmargins and calculations been hidden from the customer? Is the information clearly labelledand of a professional design standard? Have comments and labels been efficiently applied toself-document the spreadsheet?Page 7These notes have been compiled by Rynagh McNally for students of Monaghan Institute.
3. IMPLEMENT THE DESIGNFor this module we will be using Microsoft Excel spreadsheet software. Excel is a programmewhich allows the storage of financial information and lists, such as Household Finance Planning,Business Accounts and Budgeting, Invoices and Wages.The assignment brief asks the learner to implement a design according to the assessmentcriteria. In the production of this assignment (and any other spreadsheet you design) ensure youconsider EACH of the points and questions raised, under the three main stages of SpreadsheetDesign – Input, Processing and Output as outlined above.WORKSHEET LAYOUTThe layout of the data on a worksheet is a very important consideration in the design process.This should be decided before the data is inputted into the worksheet, in the format of a screenlayout design.Details included in this design should relate to the position of the information on thespreadsheet including details on any formatting that will be included. Specification of formattingcould include: worksheet name, alignment, cell formats, column height and widths, font style,font size, font colour, location of borders (including the colour, style and weight), shading, pageorientation, text direction, merged or wrapped cells, positions of images and macros.Notes:Page 8
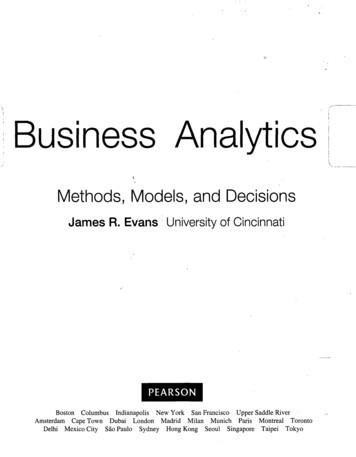
Section 1: Spreadsheet DesignThe following are two examples of worksheet layouts, one for a payroll spreadsheet and thesecond from a home page.Page 9These notes have been compiled by Rynagh McNally for students of Monaghan Institute.
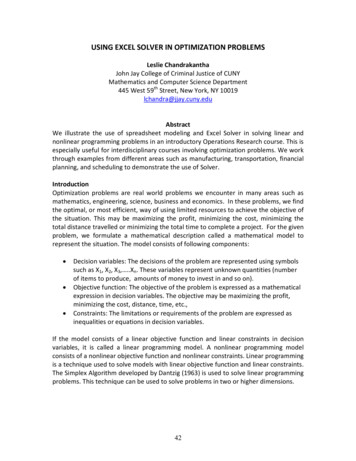
Home Page Layout4. EVALUATE SPREADSHEET AFTER IMPLEMENTATIONAfter any spread has been created it is vital to input test data from a data source. Criticallyanalyse the spreadsheet from the point of view of an end user who has not seen the spreadsheetbefore.Try to break the program. It is important to consider that every program ever written has errors,therefore you should be the first person to find the errors in yours and then debug those errors.For the evaluation of your assignment it will be essential to create test data for an end user toenter, and then complete the testing by asking other users to enter the test data. Watch howthey input the data and consider any improvements you could include helping their usage andunderstanding of the software. Ask them to evaluate the software by giving feedback on thestrengths and weakness of the spreadsheet and asking for any suggested improvements.Page10
Level 6 Spreadsheet 6N4089 Section 1 Contents 1. Assess the suitability of using a spreadsheet to achieve a given requirement from a given . Break even analysis. 9. Creating Graphs e.g. bar chart, pie chart. 10. Collect data from different sources e.g. . The following are two examples of worksheet layouts, one for a payroll spreadsheet and .