Transcription
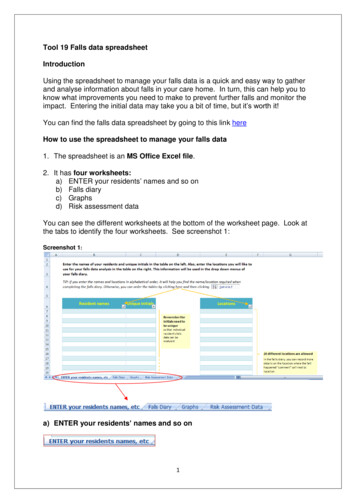
Tool 19 Falls data spreadsheetIntroductionUsing the spreadsheet to manage your falls data is a quick and easy way to gatherand analyse information about falls in your care home. In turn, this can help you toknow what improvements you need to make to prevent further falls and monitor theimpact. Entering the initial data may take you a bit of time, but it’s worth it!You can find the falls data spreadsheet by going to this link hereHow to use the spreadsheet to manage your falls data1. The spreadsheet is an MS Office Excel file.2. It has four worksheets:a) ENTER your residents’ names and so onb) Falls diaryc) Graphsd) Risk assessment dataYou can see the different worksheets at the bottom of the worksheet page. Look atthe tabs to identify the four worksheets. See screenshot 1:Screenshot 1:a) ENTER your residents’ names and so on1
Click on the tab ‘ENTER your residents’ names and so on’ on thespreadsheet to access the worksheet. First, enter the names and unique initials of all your residents in the first twocolumns. Unique means two or more residents cannot have the same initials. In the next column, enter locations in your care home you want to use toanalyse your falls patterns. The locations are areas in your care home whereresidents fall. Examples of locations you may wish to use are lounge,bedroom, shower room, hall. You can enter up to 20 locations. The information you have entered will be used in the drop-down menus inyour falls diary. Screenshot 2 explains it further.*REMEMBER* Make sure that your residents’ initials are unique to allow you to analyseindividual’s falls. Use upper and lower case consistently. The information you enter will appear in the drop-down menus in the sameorder automatically, so you do not enter anything yourself.b) Falls diary Click on the tab ‘Falls diary’ on the spreadsheet to access the worksheet. You can enter all the information related to your falls in this worksheet.Screenshot 2 Each horizontal row represents a fall. You should complete all theinformation required (please scroll to the right to see all columns by pressingthe right arrow of the scrolling bar at the bottom of the page (circled in red): The last column you will see is2
Some columns have drop-down menus:a) When you click in a cell that has a drop-down menu, to the right of the cell abox with an arrow will appear.Click on the arrow and a list of options will appear. If you don’t see the listimmediately, scroll up.b) Select the option that suits your situation best.c) There is a comment column next to many of the columns with drop-downmenus. This is for you to insert any other relevant information. Forexample, you may select “hip fracture” but you also want to note the residenthas some bruising. This more detailed information on the fall should beincluded in the comments column.d) An error message will appear if you enter a response different from theoptions given. In this case, please delete your response and select one ofthe options available. Some columns are shaded orange. This is to highlight that no data should beentered in these columns as it will be automatically generated once you enterinformation, such as the date or time the resident fell.*REMEMBER*Entering date and time Date should be entered in the dd/mm/yy format, using forward slash /, notfull stops (for example 22/04/16). If not entered using this format the formulato calculate the week day, week commencing and month will not work. Time should be entered in 24-hour format (for example 14:50 rather than2:50pm) and use colons.Otherwise the formula to calculate the time interval will not work. See thedifference below.Do not use am / pm – only use a 24-hour format3
Do not use full stop (.), semicolons (;) but USECOLONS (:)If the time interval shows “0” please re-enter the time using the right format. Sometimes the resident may have suffered more than one injury. Wheninputting the injury type, please select the most severe one. Apart from using the worksheet for entering and reporting falls data, you can useit for your own analysis and management of residents’ falls. You may want tosee the information on all falls that a specific resident has had. You can usethe filters of the column headings. Untick the option “Select All” and tick theperson you are interested in finding out more about, for example IL on the right inscreenshot 3 below. Remember to “Select All” to return to the normal view.FiltersScreenshot 34
You can use the filters to look at specific information about falls in your carehome. This will allow you to analyse patterns such as time of day, location andreason for fall.c) Graph worksheetThis worksheet contains graphs that can summarise the analysis of any data youhave entered in the falls diary worksheet. The graphs can give you insight into thefall trends in your care home so you can consider improvements. It is also veryuseful to generate discussion and to evidence improvements have taken place. Click on the ‘Graphs’ tab to access this worksheet.Remember to use the dd/mm/yy format when you enter the dates.d) Risk assessment data worksheetThis worksheet can be used for a) updating falls care plans, b) looking at residents’changing situations by using the filters and c) comparing the risk assessment datawith the falls diary to analyse the reasons for falls. Click on the tab ‘Risk assessment data’ to access this worksheet.Here you can enter all information related to your residents’ risk assessments. Each row represents a resident. You should include ALL your residents in thisworksheet. Use the drop-down menu to help you do this. The admission date and the reason for being in the care home should berecorded. The data should be entered on admission and on a monthly basis, by scrollingto the right (notice the headings of the columns to identify the point in time). Youshould review this monthly and record changes to the residents’ situation,multifactorial falls risk screen and falls care plan. Similarly to the falls diary worksheet, some cells contain drop-down menus,which provide you with options to enter. Some columns are shaded yellowto indicate they are automatically calculated. Notice that cells may automatically change colour depending on the valueentered. This is to help the reader to identify key pieces of information. Please remember to complete all the relevant cells, even if the response is“no”. This is necessary for the automatic values to be calculated and to haveassurance that the question has not been overlooked. If the resident is discharged, the date and the reason for discharge should berecorded. The spreadsheet includes five separate worksheets to cover five years of data.5
impact. Entering the initial data may take you a bit of time, but it's worth it! You can find the falls data spreadsheet by going to this link here How to use the spreadsheet to manage your falls data 1. The spreadsheet is an MS Office Excel file. 2. It has four worksheets: a) ENTER your residents' names and so on b) Falls diary c) Graphs