Transcription
Assessment of Water Quality Trendsfor the North Bosque River through2019Jimmy Millican and Todd AdamsGreen Creek Station 13486 (BO083) near Clairette, TX (April 8, 2019)TR2002June 2020
Assessment of Water Quality Trends for the North BosqueRiver through 2019Report toTotal Maximum Daily Load ProgramOffice of Water, Planning and Implementation SectionTexas Commission on Environmental QualityAustin, TexasContract No. 582-19-95554 Work Order No. 02Prepared byJimmy Millican and Todd AdamsTexas Institute for Applied Environmental ResearchTarleton State UniversityStephenville, TexasTR2002June 2020
Assessment of Water Quality Trends for the North Bosque River through 2019AcknowledgementsThe Texas Commission on Environmental Quality (TCEQ) Total Maximum Daily LoadProgram (Contract No. 582-19-95554 Work Order No. 02) provided financial support forpreparation of this report.The Texas Institute for Applied Environmental Research (TIAER) collected and analyzedall historical water quality monitoring data presented herein. Past support includes CleanWater Act (CWA) §319(h) projects Evaluating Effectiveness of Total Maximum DailyLoad Implementation Plan Activities within the North Bosque River Watershed, NorthBosque River Watershed Water Quality Assessment, and Evaluating Effectiveness ofImplementation Plan Activities within the North Bosque River Watershed funded throughthe TCEQ Nonpoint Source Program by the Environmental Protection Agency (EPA).Other major projects that supported historical monitoring include Livestock and theEnvironment: A National Pilot Project sponsored by EPA, the Bosque River WatershedPilot Project funded through the TCEQ Clean Rivers Program in cooperation with theBrazos River Authority, and the Lake Waco-Bosque River Initiative, funded through theUnited States Department of Agriculture.TIAER initially developed the historical information regarding spatial distribution ofanimal waste application fields in the watershed under the TCEQ project, Monitoring toSupport North Bosque River Model Refinement, with the Total Maximum Daily LoadProgram. Updates to these spatial data occurred under the Clean Water Act §319(h)project, Evaluating Effectiveness of Implementation Plan Activities within the NorthBosque River Watershed, and this current project.The United States Geological Survey provided flow and rating curve information forthree gauging stations they maintain along the North Bosque River.The authors would also like to acknowledge the dedicated work of the many fieldpersonnel and laboratory chemists who aided in the collection and analysis of samples,particularly since nonpoint source water quality monitoring often requires personnel to beon-call seven days a week.Mention of trade names or commercial products does not constitute their endorsement.ii
Assessment of Water Quality Trends for the North Bosque River through 2019Table of ContentsAcknowledgements . iiTable of Contents . iiiList of Tables . ivList of Figures . vIntroduction . 1Background and Station Descriptions . 7North Bosque River Watershed . 7Sampling Stations . 10Sample Collection and Laboratory Analysis Methods . 12Quality Assurance Procedures . 12Collection Methods for Routine Grab Samples . 14Collection Methods for Storm Samples . 15Monitoring Conditions . 16Laboratory Analysis Methods . 18Data Set Construction and Statistical Methods for Trend Analysis . 19Censored Data . 20Monitoring History . 21Exploratory Data Analysis . 22Adjustment for Stream Flow. 23Trend Testing . 24Trend Analysis Results . 25Routine Grab Data . 25Volume-Weighted Data . 31Evaluation of Stream Water Quality Goal Attainment . 31Regression Relationships . 31Annual Average TMDL Goal . 43Probability Distribution Curves . 47Summary and Discussion. 50References . 62Appendix A. Storm Conditions 2008-2018 . 69Appendix B. Estimated Loading Relationships for Storms in 2019 . 75Appendix C. Annual Box-and-Whisker Plots for Bacteria . 82iii
Assessment of Water Quality Trends for the North Bosque River through 2019List of TablesTable 1Table 2Table 3Table 4Table 5Table 6Table 7Table 8Table 9Table 10Table 11Table 12Table 13Table 14Table 15Table 16Table 17Table 18Table 19Table 20Table 21Phosphorus WLA for wastewater discharges within the North BosqueRiver watershed. . 6Estimated populations and growth for municipalities within the NorthBosque River watershed. . 8Estimated land use and drainage area above sampling sites. . 11Parameters and methods of analysis for water quality samples used intrend analysis. . 19Years of available sampling data for trend analysis by station andparameter type for routine grab samples. . 22Years of available sampling data for trend analysis by station andparameter type for storm samples. . 22Trend results for routine grab data for station 17226 (BO020). . 26Trend results for routine grab data for station 11963 (BO040). . 26Trend results for routine grab data for station 11961 (BO070). . 27Trend results for routine grab data for station 11956 (BO090). . 27Trend results for routine grab data for station 11954 (BO095). . 28Trend results for routine grab data for station 18003 (BO083). . 30Trend results for routine grab data for major tributary station 13486(GC100). . 30Trend results for monthly volume-weighted data for station 17226(BO020). . 32Trend results for monthly volume-weighted data for station 11963(BO040). . 32Trend results for monthly volume-weighted data for station 11961(BO070). . 33Trend results for monthly volume-weighted data for station 11956(BO090). . 33Trend results for monthly volume-weighted data for station 11954(BO095). . 34Trend results for monthly volume-weighted data for major tributarystation 13486 (GC100). . 34Comparison over time of active and historical WAFs in the North BosqueRiver watershed. . 57Summary of active and historical WAF information for CAFOs and AFOsin the North Bosque River watershed as of fall 2019. . 58iv
Assessment of Water Quality Trends for the North Bosque River through 2019List of FiguresFigure 1Figure 2Figure 3Figure 4Figure 5Figure 6Figure 7Figure 8Figure 9Figure 10Figure 11Figure 12Figure 13Figure 14Figure 15Figure 16Figure 17Figure 18Figure 19North Bosque River watershed trend analysis monitoring stations andUSGS gauge locations. Sample station identifier – TCEQ (TIAER). . 2Annual variation in the number of dairy producers and milk production forErath County. . 9Average Monthly normal precipitation for Stephenville, Texas (19902019). . 10Estimated average daily flow at station 11954 (BO090) for 2019 a) normalscale and b) log scale. . 18Relationship of the natural log of flow to annual average PO4-Pconcentration of routine grab samples for station 17226 (BO020). 36Relationship of the natural log of flow to annual average PO4-Pconcentration of routine grab samples for station 11963 (BO040). 37Relationship of the natural log of flow to annual average PO4-Pconcentration of routine grab samples for station 11961 (BO070). 38Relationship of the natural log of flow to annual average PO4-Pconcentration of routine grab samples for station 11958/18003(BO085/BO083). . 39Relationship of the natural log of flow to annual average PO4-Pconcentration of routine grab samples for station 11956 (BO090). 40Relationship of the natural log of flow to annual average PO4-Pconcentration of routine grab samples for station 17605/11954(BO100/BO095). . 41Annual average PO4-P from routine grab data for stations 17226 (BO020)and 11963 (BO040) compared to the long-term predicted concentrationwithout TMDL implementation and the TMDL goal. . 45Annual average PO4-P from routine grab data for stations 11958/18003(BO085/BO083), 11956 (BO090), and 17605/11954 (BO100/BO095)compared to the long-term predicted concentration without TMDLimplementation and the TMDL goal. 46TMDL goal probability curve for index site above Stephenville (17226[BO020]) compared to monitored data curve. . 47TMDL goal probability curve for index site below Stephenville (11963[BO040]) compared to monitored data curve. . 48TMDL goal probability curve for index site above Meridian (18003[BO083]) compared to monitored data curve. . 48TMDL goal probability curve for index site at Clifton (11956 [BO090])compared to monitored data curve. . 49TMDL goal probability curve for index site at Valley Mills (11954[BO095]) compared to monitored data curve. . 49Annual box and whisker plots of monthly volume-weighted PO4-P grabdata for station 17226 (BO020). . 51Annual box and whisker plots of monthly volume-weighted PO4-P grabdata for station 11963 (BO040). . 52v
Assessment of Water Quality Trends for the North Bosque River through 2019Figure 20Figure 21Figure 22Figure 23Figure 24Figure 25Figure 26Figure 27Annual box and whisker plots of monthly volume-weighted PO4-P grabdata for station 11961 (BO070). . 52Annual box and whisker plots of monthly volume-weighted PO4-P grabdata for station 13486 (GC100). . 53Annual box and whisker plots of monthly volume-weighted PO4-P data forstation 11956 (BO090). . 53Annual box and whisker plots of monthly volume-weighted PO4-P data forstation 11954 (BO095). . 54Map of CAFOs, AFOs, and associated WAFs (active and historical)within the North Bosque River watershed, representing conditions as offall 2019. . 55Temporal variability in measured annual precipitation for Stephenville andWaco, Texas. 59Monthly difference from normal precipitation from January 2010 throughDecember 2019 for Stephenville, Texas. . 60Annual runoff in millimeters for gauged stations along the North BosqueRiver. 60vi
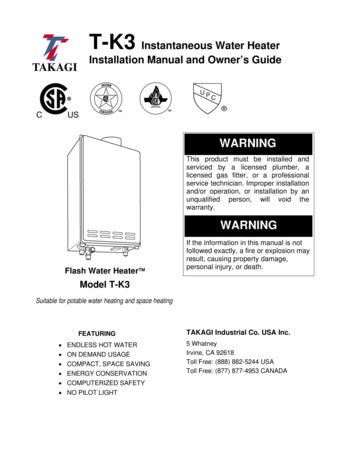
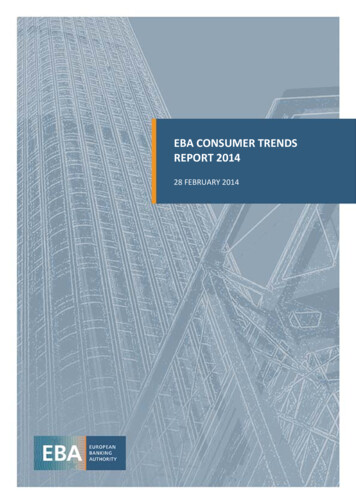
Assessment of Water Quality Trends for the North Bosque River through 2019IntroductionThis report presents an update of water quality trends in the North Bosque Riverwatershed, assessing effectiveness of nonpoint source (NPS) and point source controlmeasures associated with the North Bosque River Total Maximum Daily Loads (TMDLs)Implementation Plan (I-Plan). This report largely follows the format of previous trendreports for the North Bosque River (e.g., McFarland and Millican, 2011 and 2012;McFarland and Adams, 2013; 2014a; 2015; 2016; 2017; 2018; and Millican, Adams, andMcFarland 2019). Trend analyses focus on seven monitoring stations, five of which areindex stations (17226 [BO020], 11963 [BO040], 18003 [BO083], 11956 [BO090], and11954 [BO095]) 1 for the phosphorus TMDLs along the North Bosque River (Figure 1).Other stations include station 11961 (BO070), a long-term monitoring station locatedalong the North Bosque River between index stations 11963 (BO040) and 18003(BO083), and station 13486 (GC100), located on a major tributary to the North BosqueRiver. Spatial information on regulated concentrated animal feeding operations(CAFOs), unregulated animal feeding operations (AFOs), and the land area associatedwith waste application fields (WAFs) is also updated within this report to aid inevaluating implementation practices within the watershed.The TCEQ adopted two TMDLs for soluble reactive phosphorus 2 (SRP) for NorthBosque River Segments 1226 and 1255 in February 2001, which USEPA approved inDecember 2001 (TNRCC, 2001). Jointly, these two segments represent the full length ofthe North Bosque River from its headwaters just north of Stephenville, where the NorthFork and South Fork of the Upper North Bosque River merge, to its confluence withLake Waco in McLennan County. The goal of these TMDLs is an overall reduction ofabout 50 percent in SRP loadings and concentrations within the North Bosque River, withspecific reduction goals varying by the river reach. The I-Plan for these TMDLs wasapproved by TCEQ in late 2002 and by the Texas State Soil and Water ConservationBoard (TSSWCB) in early 2003 (TCEQ and TSSWCB, 2002).The I-Plan outlines a number of programs to reduce SRP in the North Bosque River.These programs include four basic elements for phosphorus control:1. Use of phosphorus application rates for land application of dairy manure,2. Use of reduced phosphorus diets for dairy cows to decrease manurephosphorus,3. Removal of about half the dairy-generated manure from the watershed, and4. Implementation of phosphorus effluent limits on municipal wastewatertreatment facilities (WWTFs).Throughout this report, stations are identified with both the TCEQ station identification number and theTIAER identification to allow easy referencing to earlier reports where only one or the other may havebeen used to identify stream sampling locations.2Soluble reactive phosphorus is commonly referred to as orthophosphate phosphorus (PO4-P).11
Assessment of Water Quality Trends for the North Bosque River through 2019Figure 1North Bosque River watershed trend analysis monitoring stations and USGSgauge locations. Sample station identifier – TCEQ (TIAER).2
Assessment of Water Quality Trends for the North Bosque River through 2019To address phosphorus application rates on dairy WAFs, the TSSWCB initiated theComprehensive Nutrient Management Plan (CNMP) Program. The TSSWCB supportsthe voluntary implementation of CNMPs by dairy producers as part of their water qualitymanagement plans (WQMPs) for AFOs. In addition to voluntary compliance, the TCEQamended rules 3 for CAFOs in 2004 to require regulated dairies in the North Bosque toimplement Nutrient Management Plans (NMPs). On July 2, 2014, the TCEQ adopted arevised CAFO rule to incorporate changes to federal regulations. These rule changesimposed additional requirements regarding NMPs for CAFOs in the watershed.An NMP addresses nutrient management guidance for cropping systems as part of aconservation plan for producers and landowners. A CNMP encompasses most aspects ofan NMP, but additionally may include specifications for feed management, manure andwastewater handling and storage, nutrient management, land treatment practices, andother manure and wastewater utilization options addressing the overall agronomic andenvironmental aspects of an animal feeding operation (TCEQ and TSSWCB, 2002). Thedevelopment and adoption of CNMPs and NMPs has occurred over several years. InFY2006, 8 CNMPs were certified, 34 were certified in FY2007, and another 7 certified inFY2008 (TCEQ, 2009). In FY2009, TSSWCB indicated that two more CNMPs werecertified. By the end of 2010, all 55 dairy CAFOs that were operating in the watershed in2004 had certified CNMPs, adding substantive nutrient management practices to theiroperations (TCEQ, 2012a). The TSSWCB continues to review and certify, asappropriate, new or amended plans.Anecdotal evidence from dairy producers supported by local feed specialists and TexasAgriLife Extension Service (formerly Texas Cooperative Extension) indicates that lowerphosphorus diets are being fed. In the mid to late 1990s, a survey of dairy dietformulations including dairies in the North Bosque River watershed indicated that cowdiets averaged 0.52 percent phosphorus (Sansinena et al., 1999). Revisedrecommendations by the National Research Council (NRC) indicate optimal levels ofabout 0.38 percent phosphorus for high producing dairy cattle (NRC, 2001), which hasbeen supported in studies focused on reducing excess phosphorus in manure (e.g., Powelland Satter, 2005; Miller et al., 2010; Kebreab, et al., 2013).In dealing with the export of manure from the watershed, the two most visible projectsassociated with the I-Plan were the Dairy Manure Export Support (DMES) project andthe Composted Manure Incentive Project (CMIP). The TSSWCB sponsored the DMESproject to provide incentives to haulers to transport manure from dairies to compostingfacilities. Through the CMIP, TCEQ provided oversight of composting facilities andrebates to Texas state agencies that used manure compost associated with the DMESproject. The TCEQ and TSSWCB initiated these manure composting projects inSeptember 2000 as a way to export dairy manure from the North Bosque Riverwatershed, while providing a beneficial soil amendment. The Texas Department ofTransportation (TxDOT) was the major user of dairy manure compost for roadsiderevegetation. Through August 2006, over 650,000 tons of dairy manure were hauled toSubchapter B Concentrated Animal Feeding Operations, Chapter 321, Texas Administrative Code Title30, §321.31 – §321.27.33
Assessment of Water Quality Trends for the North Bosque River through 2019composting facilities and about 329,000 cubic yards of compost were exported from thewatershed (TCEQ, 2009).Funding for the CMIP continued through August 2006, while the DMES projectcontinued to pay incentives to haulers through February 2007. The idea behind these twoprojects was to establish a manure composting industry that would be self-sufficient afterthese two incentive programs ended. Seven composting facilities were active duringthese projects, and as of March 2008, six were still active and receiving manure fromdairy operations within the watershed. A follow up review in May and June 2009indicated that five of these six composting facilities were still active, but as of early 2012,TCEQ reported that only two composting facilities were still operational, and one otheronly sporadically received manure (TCEQ, 2012a). As of 2019, there are still two activecommercial composting facilities, Erath Earth and Green Cow Compost, both located inDublin, Texas, just on the western edge of the watershed. There are also dairy operationswithin the watershed that compost their own manure, but the number is not readilyavailable. CAFOs in the North Bosque watershed are currently required under theirpermits to either export manure outside the watershed, send it to an approved compostingfacility, or apply it to either their own or third-party WAFs within the watershed atspecific rates. Soil must be tested for phosphorus levels at a WAF annually and before thefirst time waste is applied; waste cannot be applied if phosphorus levels in soil exceedcertain criteria.Another measure that has had a notable impact on water quality, particularly under lowflow conditions, is the implementation of phosphorus-removal treatments by municipalWWTFs. There are seven municipal WWTFs that discharge within the North BosqueRiver watershed (Stephenville, Hico, Meridian, Iredell, Cranfills Gap, Clifton, and ValleyMills). An initial waste load allocation (WLA) was set for all seven municipal WWTFsand phosphorus reporting implemented in as part of Phase I in the I-Plan. The twolargest facilities, in Clifton and Stephenville, had their permits amended in 2003 torequire phosphorus limits that necessitate advanced treatment processes. In the fall of2005, Stephenville began using biological treatment in conjunction with alum andpolymers for phosphorus removal, with the goal of meeting a daily average dischargelimit of 1 mg/L. The Clifton WWTF started using alum as a chemical treatment toremove phosphorus in the spring of 2005.As Phase II of the wastewater treatment facilities measures, existing municipal permitteesand other wastewater dischargers have had their permits amended to require phosphorusload limits in pounds per day and/or a 1 mg/L total-P effluent concentration limit. As ofAugust 31, 2010, TCEQ reported that all seven municipal WWTFs within the NorthBosque River watershed have compliance schedules consistent with the WLAs in theTMDL and I-Plan (TCEQ, 2011). Besides the seven municipal WWTFs, there are threeother dischargers within the watershed that also have phosphorus limits (Table 1 andFigure 1).With implementation of all these activities, it is important to monitor and statisticallyevaluate improvements in water quality. Changes in water quality may be gradual andlag actual implementation on the land, particularly with regard to reducing nonpoint4
Assessment of Water Quality Trends for the North Bosque River through 2019source pollutants (e.g., Meals, et al., 2010). There has also been temporal and spatialvariability in the implementation of I-Plan activities, so it may take several years afterimplementation occurs before instream improvements become apparent throughout thewatershed.5
Assessment of Water Quality Trends for the North Bosque River through 2019Table 1Phosphorus WLA for wastewater discharges within the North Bosque River watershed.Permitted DischargePermit IDTCEQ (EPA)LatitudeLongitudeTotal PhosphorusDaily Avg. (mg/L)Total PhosphorusDaily Avg. (lbs/day)Permitted MonthlyDischarge (MGD)aDischarge LocationCity of 762129.2b3.5bNorth Bosque RiverCity of eport7.00.65North Bosque RiverCity of eport5.90.45North Bosque RiverCity of Valley ort3.0c0.36North Bosque RiverCity of 0.25Jacks Hollow Branch of theNorth Bosque RiverCity of Iredell (TownPlant rt1.70.049North Bosque RiverCity of Cranfills t0.40.04Austin Branch of MeridianCreek, which flows into theNorth Bosque RiverNorthside SubdivisionWater 944Report0.280.033Unnamed tributary of theNorth Fork of the NorthBosque RiverStephenville MobileHome Park (ShadyOaks ort0.200.024Unnamed tributary of PoleHollow BranchWestern DairyTransportWQ0004314000(Not Applicable)NotapplicableNotapplicableNot applicableNot applicableNot applicableNo dischargea.b.c.Source: Permit files obtained online through TCEQ Central Registry Query (https://www15.tceq.texas.gov/crpub/).Total phosphorus and permitted discharge include both outfalls for Stephenville. Outfall 001 discharges below Stephenville, while outfall 002discharges within the Stephenville City Park.Source: North Bosque River I-Plan (TCEQ and TSSWCB, 2002). Also, noted in permit for the City of Valley Mills under Other Requirements.6
Assessment of Water Quality Trends for the North Bosque River through 2019Direct point source discharges occur to the North Bosque River from each community’sWWTF, with the exception of Cranfills Gap and Hico (Table 1). The Cranfills GapWWTF discharges into the Austin Branch of Meridian Creek, a major tributary to theNorth Bosque River, and the Hico WWTF discharges into Jacks Hollow Branch a fewhundred feet before its confluence with the North Bosque River. Three additionalwastewater dischargers are as follows: Northside Subdivision WWTF for the Northside Subdivision Water Plant andDistribution Corporation located about 0.75 miles east of North State Highway (Hwy)108 and 0.75 miles south of County Road 433, north of Stephenville, The Shady Oaks WWTF owned by the Stephenville Mobile Home Park located at theintersection of US Hwy 377 and Business US Hwy 377 northeast of Stephenville, and Western Dairy Transport, which has a no-discharge permit, is located at 771 CountyRoad 176 (Smith Spring Road) north of Stephenville. Western Dairy Transportirrigates treated process wastewaters from tank and vehicle cleaning from a milktransport fleet to fields within the Indian Camp Creek drainage basin. Recycled washwater is routed through a sand trap and settling basin prior to discharge into a linedirrigation pond.To evaluate improvements in water quality, TIAER has sampled stream stations all alongthe North Bosque River since late 1995. Prior to 1995, TIAER's monitoring focused onstream stations and tributaries within the upper third of the watershed, providing asampling history at some stations dating back to 1991. While soluble phosphorus is thefocus of the North Bosque River TMDLs, excessive nutrients, based on a variety ofnitrogen and phosphorus constituents, elevated chlorophyll-α (CHLA) concentrations,and elevated bacteria levels, have been a concern in the North Bosque River watershedfor quite some time. To more fully assess overall water quality improvements in theNorth Bosque River, trends are presented for nitrogen, phosphorus, CHLA, totalsuspended solids (TSS), specific conductance (conductivity), and bacteria concentrations.Field parameters (e.g., dissolved oxygen and pH), while routinely monitored asinstantaneous measurements, were not included in this trends analysis due to thedifficulty in correcting for diurnal fluctuations. Besides trends analysis, data were alsoevaluated in comparison to water quality g
Tarleton State University . Stephenville, Texas . TR2002 . June 2020. Assessment of Water Quality Trends for the North Bosque River through 2019 . ii . . approved by TCEQ in late 2002 and by the Texas State Soil and Water Conservation Board (TSSWCB) in early 2003 (TCEQ and TSSWCB, 2002).