Transcription
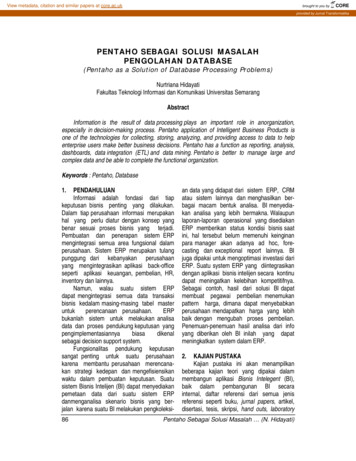
Integrating Outlier Detection into Pentaho Data IntegrationMárcio SantosInstituto Superior Técnico - Universidade de LisboaLisboa, Portugalmarcio.santos@tecnico.ulisboa.ptABSTRACTIn recent years data has become a valuable asset to many organizations. Several problems, such as missing values and outliers,can have a negative impact on data quality. Poor data quality negatively affects the quality of results obtained from analyzing thedata, which in turn negatively impacts the quality of decisions madeby organizations. Data profiling, the set of processes to examinedata sets and produce metadata, can help in the discovery of suchdata quality problems. Data profiling is also useful for discoveringdependencies on the data, such as functional and inclusion dependencies. Metadata produced by data profiling is of special interestfor data integration, in which the data sets to be integrated are oftenunfamiliar. Pentaho Data Integration (PDI) is a well-known dataintegration tool with an open source version, open to additions bythe community. PDI currently lacks many data profiling functionalities. One of the missing data profiling functionalities that hasbeen deemed relevant by PDI users is outlier detection. The presentwork is intended to address this flaw by adding the outlier detection functionality to PDI. The system consists of 2 modules: one fordetecting outliers and one for visualizing outliers. The detection ofoutliers is done using four well-know algorithms from the outlierdetection literature: DB(p, d)-Outliers, LOF, DBSCAN, and ABOD.A simple outlier ensemble, for adding robustness to the results ofindividual algorithms, is also included. The visualization of outliersis done with the help of two suitable data visualizations: Scatterplotand Parallel Coordinates. The outlier detection module is completelyindependent from the visualization module, but the opposite is nottrue; the visualization module works on the output of the outlierdetection module. The results from usability tests show that thesystem is easy to use and was well accepted by frequent users ofPDI. However, users revealed some difficulty in completing a taskthat integrated our work within a normal PDI workflow.social and economical impacts [9]. Data quality problems include,among others, missing attribute values, incorrect attribute values,and different representations of the same data, such as dates represented in different formats. Data quality problems typically arisefrom human data entry error, data inconsistencies existing betweenintegrated data sets, and noise interference in sensor readings[5].Data profiling may help revealing such errors and inconsistencies.Data profiling encompasses a vast array of methods to examinedata sets and produce metadata, i.e., data that provides informationabout data. Typical metadata includes the number of records ina data set, the number of null and unique values of an attribute,and basic column statistics. Other metadata, typically more difficultto obtain, includes outliers and dependencies in the data. Dataprofiling produces critical insights into data that companies canthen leverage to their advantage. Use cases for data profiling includedata exploration, data cleansing, and also data integration.Data integration is the problem of combining data residing atdifferent sources and providing the user with a unified view ofthose data [10]. In data integration the data sets to be integratedare often unfamiliar, and the integration expert typically wantsto know more details about the data sets before integrating them.Those details may be obtained by profiling the data sets.PDI1 is a well-known data integration tool with an open sourceversion, open to additions by the community. It allows users to loaddata from multiple sources, transform it, and load the transformeddata to multiple sources. Data flows in PDI are built using steps,joined by hops, which pass data from one step to the next. A transformation in PDI is essentially one of those data flows. A simpleexample of a PDI transformation is illustrated in Figure 1.KEYWORDSOutlier Detection, Anomaly Detection, Data Profiling, Data Integration, Pentaho Data Integration1INTRODUCTIONWith vast amounts of data currently available, organizations are focused on exploiting data for competitive advantage [11]. In additionto that, computers have become more powerful, storage capacityhas increased dramatically, and many data analysis algorithms havebeen developed. Together, all these factors boosted the use of dataanalytics for effective decision making. However, decisions basedon results from data analytics are only effective if data quality canbe guaranteed.Many evidences exist that data quality problems affect organizations and result in different types of impact, including substantialFigure 1: A PDI transformation that reads data from a CSVfile, filters the data, sorts it, and loads it to a relational database table.PDI currently lacks many data profiling functionalities. Otherdata integration tools currently in the market have support for awider range of data profiling tasks. To address this weakness, PDImakes use of plug-ins or third-party product integration. HitachiVantara2 , the company that develops and maintains PDI, has produced several internal studies that summarize the data profiling1 n.html2 https://www.hitachivantara.com/en-us/home.html
functionalities their clients wish would be available (natively) onPDI. One of the most pressing needs of clients is outlier detection.The main objective of the present work is to add the outlierdetection functionality to PDI. This has been done by designingand developing a new PDI step. The new step, appropriately namedOutlier Detection, offers four well-know outlier detection algorithmsfrom the literature, and a simple outlier ensemble, for performingunsupervised outlier detection on multivariate data, i.e., data inwhich records have several attributes (variables). The Outlier Detection step is accompanied by two data visualizations - Scatterplotand Parallel Coordinates -, since these data visualizations can be avaluable tool for assessing the quality of outlier detection results.The following functional requirements have been identified:2.1.2 Step Output. The output of the Outlier Detection step is atable that consists of: the input fields that were selected for the detection; the outlier labels (and optionally the outlier scores) for eachselected algorithm; the outlier labels (and optionally the outlier scores) for theoutlier ensemble, if selected;The outlier scores for the selected algorithms are optional. In casethe outlier ensemble is selected, there is an option for omittingthe individual algorithm results from the output, showing only theensemble results.The outlier scores assigned by each algorithm are normalized andregularized [7]. This means that all scores are in the interval [0, 1];inliers will have scores close to 0, while outliers will have scoresclose to 1. Having normalized and regularized scores not only allowsus to combine them in an outlier ensemble, but also facilitates thecomparison between methods and the interpretability of the results.We find this very beneficial for users without background on outlierdetection, since they will not have to learn how to interpret thescores of the different algorithms, which may differ widely in theirscale, their range, and their meaning. The step should support outlier detection on multivariatedata, with both numerical and categorical attributes; Users without background on outlier detection should beable to understand the concepts used in the step withoutspending time on prior training.Usability was identified as a quality requirement: It should be easy for users to select attributes from the datagiven as input to the step, configure the available algorithmsin the step, and analyze the results returned by the step;2.1.3 Algorithms. The Outlier Detection step includes four algorithms from four different techniques:To assess compliance with the usability requirement, we have conducted tests with users.This document is organized as follows. In Section 2 we describethe functionality and implementation of the Outlier Detection step.The same is done for the companion data visualizations in Section 3.Section 4 details the methodology and results of the usability tests,and Section 5 provides a conclusion to this document.2(1) DB(p, d)-Outliers [6] is a distance-based algorithm; an object is a DB(p,d)-Outlier if at least a fraction p of the objectsin the data set lies greater than distance d from the object. Inaddition to parameters p and d, a distance function, such asthe Euclidean distance, is also required to calculate distancesbetween data points. Although this is originally a labelingalgorithm, some authors transform it in a scoring algorithmby eliminating parameter p and keeping only parameter d[12]. In this work we use the scoring version.(2) LOF (Local Outlier Factor) [1] is a density-based algorithm; each object in the data set will be awarded a LOFscore, which takes in consideration not only the density ofthe object itself, but also the densities of its nearest neighbors.An object lying in a dense region will have a local densitysimilar to that of its neighbors, whereas an object not lyingin a dense region will have a local density lower than that ofits neighbors. The former will be considered an inlier, whilethe latter will be considered an outlier. In addition to a distance function, the algorithm takes as parameter the numberof nearest neighbors to consider (originally named MinPts).(3) DBSCAN (Density Based Spatial Clustering of Applications with Noise) [3] is a clustering algorithm in whichan object belongs to a cluster if the neighborhood of a givenradius of that object contains at least a minimum number ofobjects. Objects that do not belong to any cluster are considered noise. The algorithm takes as parameters a radius (ϵ),the minimum number of objects to form a cluster (MinPts),and a distance function. In outlier detection we may considernoise objects as outliers, while objects belonging to a clusterare considered inliers. DBSCAN is a labeling algorithm, butwe can obtain outlier scores from outlier labels by giving ascore of 0 to inliers and a score of 1 to outliers.OUTLIER DETECTION STEPThis section describes the functionality and implementation of theOutlier Detection step. The main goal of the step was to integrateunsupervised outlier detection into PDI.2.1FunctionalityThe Outlier Detection step offers four outlier detection algorithmsand an outlier ensemble for performing unsupervised outlier detection in multivariate data, both numerical and categorical. Morethan one algorithm can be selected for each step execution. If thisis the case, users may also choose to run the outlier ensemble.2.1.1 Input Data. The input data to the Outlier Detection step isreceived from other steps in a transformation. Users may selectany number of attributes (more commonly referred to as fields inPDI) from the input data. The step supports PDI types Integer andNumber, corresponding to Java types Long and Double, respectively.The only categorical data type supported is PDI type String, corresponding to the Java type of the same name. Attributes in theinput data that are not of the supported data types are not listedfor selection by the users. The step handles categorical attributesby encoding their values as numerical values. For that purpose,two encodings are available: Inverse Document Frequency (IDF) and1-of-n. These are common encodings and were chosen because theydo not require any parameterization by the users.2
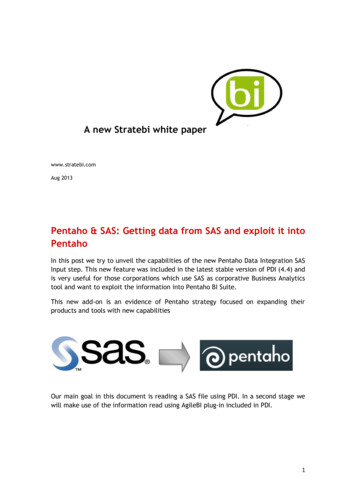
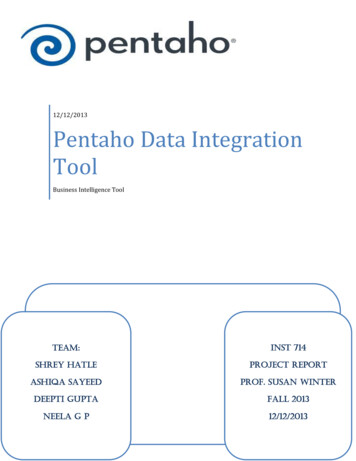
(4) ABOD (Angle-Based Outlier Detection) [8] compares theangles between pairs of distance vectors to other objects todiscern between objects similar to other objects and outliers.If most other objects are located in similar directions, theangles to most pairs of objects will be small and the objectwill be considered an outlier. On the contrary, if many otherobjects are located in varying directions, the angles will differlargely and the object will be considered an inlier. ABODis an alternative to algorithms that uses distances, and isparticularly useful for high-dimensionality data sets. A majoradvantage of ABOD is that users are not required to specifyany parameters. We include an option to run an approximateversion of this algorithm, known as FastABOD, which onlyconsiders the k nearest neighbors of an object o, instead ofthe whole data set.We decided to mostly include distance-based algorithms since thenotion of distance is something most users are familiarized with.We think it would be more difficult for most users to understandparameters of other techniques that require knowledge of moreadvanced mathematical concepts. We made an exception to thisrule by including ABOD. The class implementing the StepDataInterface will contain result sets, temporary data, database connections etc; The class implementing the StepMetaInterface will holdand serialize step settings, and report changes made to therow stream, e.g., a step may have added or removed fieldsfrom the row; The class implementing the StepDialogInterface will beresponsible for the step dialog.The Step module contains a step (BaseStep) which already implements these interfaces and that new steps can extend.2.1.4 Outlier Ensemble. Outlier ensembles are used to combine algorithm results in the expectation that the combined results will bemore robust. For this reason, we decided to include an outlier ensemble in the Outlier Detection step. The outlier ensemble available inthe step performs a weighted arithmetic mean of the outlier scoresof the selected algorithms. It requires that two or more algorithmshave been selected.2.2Figure 3: Architecture of a PDI step. Represented only arethe 4 interfaces that every PDI step must implement.The Outlier Detection step is composed of two main modules.The Step module contains the four classes that implement thefour interfaces required to create a step: OutlierDetectionStep,OutlierDetectionStepData, OutlierDetectionStepMeta, andOutlierDetectionStepDialog. These classes will use the classesin the Outlier Detection module, which contains all the modules thatare necessary to handle with data and perform the actual detectionof outliers. The Outlier Detection module is depicted in Figure 4.ArchitectureA PDI step performs a specific data processing task on a stream ofdata rows. Each data row is composed of data and metadata, suchas the data type of a field. The life cycle of a PDI step is depictedin Figure 2. The life cycle consists of three stages: Initialization,Row Processing, and Cleanup. The Initialization stage starts whena transformation is preparing to start execution. During initialization we can perform one-time initialization tasks, such as openingfiles or establishing database connections. Once the transformationstarts execution, the step enters the Row Processing stage, where itprocesses every row until no more rows are left in the input. Oncethe transformation is complete, the Cleanup stage starts, so thatallocated resources can be deallocated.Figure 2: The 3 stages of a PDI step life cycle: Initialization,Row Processing, and Cleanup.Figure 4: Outlier Detection module.The Field Meta module holds metadata such as the name anddata type of each field selected for detection, as well as the selectedcategorical field encodings for categorical fields. The AlgorithmMeta module holds algorithm metadata such as the algorithm parameters, their threshold value, and whether the algorithm is selected for running. The Ensemble Meta module is similar to theIn Figure 3 we depict the architecture of a PDI step. Within theStep module we represent the four interfaces that every step mustimplement: The class implementing the StepInterface will be responsible for the step life cycle;3
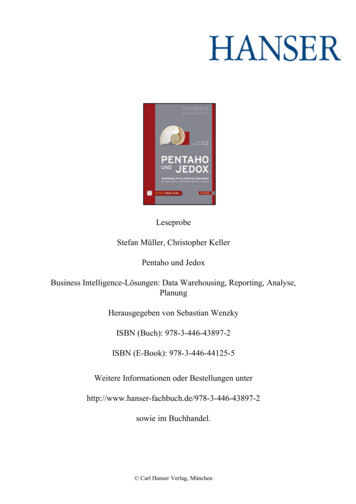
Algorithm Meta module, but instead holds ensemble parametervalues, such as which algorithms are selected and what are theirweights. The Categorical Field Encoding module contains theseveral categorical field encodings to transform categorical valuesinto numerical values. The Row Storage module holds data rows intheir original format, an Object array (Object[]). The Data module holds data rows in a more convenient format for processing,such as Double vectors. The Distance Function module containsthe distance functions that the Algorithm module uses to calculatedistances between objects. The Result module holds the outputof algorithms and ensembles, i.e., labels and scores for each datarecord. The Algorithm module contains the algorithms used foroutlier detection. The Ensemble module contains ensembles forcombining algorithm results.All of these modules were designed for extension. They containinterfaces that define contracts for new classes, so they can be usedas any of the existing classes is. In this way it should be easy to add,for example, new algorithms, new ensembles, and new distancefunctions.2.3The Algorithms tab contains all the algorithms available in thestep. We can see in Figure 6 that each algorithm has its own groupwith all the algorithm-related parameters. Users must check the Runalgorithm? box if they wish to use the algorithm in the detection.Implementation2.3.1 User Interface. The Outlier Detection step user interface (ordialog) was developed with Eclipse SWT3 . SWT, or The StandardWidget Toolkit, is an open source widget toolkit for Java that offersaccess to the user interface facilities of the operating systems onwhich it is implemented. This is the standard widget toolkit in PDI.The interface was designed around the three main concepts of thestep: data, algorithms, and the ensemble. To that end, we organizedthe dialog into three tabs: Fields, Algorithms, and Ensemble. Besidethe step name, only the Output scores? option is not in a tab, becauseit applies to both the algorithms and the ensemble.In the Fields tab users can select which input fields to use in thedetection and which encoding to use for categorical fields. Figure 5depicts the contents of this tab.Figure 6: Outlier Detection step Algorithms tab.The remaining tab is the Ensemble tab, which is depicted inFigure 7. Users have to check the Run ensemble? box to run theoutlier ensemble.Figure 7: Outlier Detection step Ensemble tab.2.3.2 Domain Logic. In the Outlier Detection step the class responsible for the step life cycle is the OutlierDetection class. TheOutlierDetection class is responsible for collecting all input datarows, converting them to a more suitable format for processing,performing the outlier detection on the data, and passing the resultson to the next steps. The actual outlier detection is performed bythe ELKI software library [12]. ELKI is an open source data miningsoftware written in Java, focusing on unsupervised methods inFigure 5: Outlier Detection step Fields tab.3 https://www.eclipse.org/swt/4
cluster analysis and outlier detection. It provides a large collectionof outlier detection algorithms from several techniques.Input data rows arrive as Object arrays (Object[]) and arestored in a RowStorage object, which stores input data rows intheir original format. They are then converted from RowStorageformat to Database format. The Database class is part of the Datamodule and stores input data rows in DoubleVector objects. TheDoubleVector class is also part of the Data module and internallystores input data rows in ELKI DoubleVector format. Storing thedata in an external library format avoids unnecessary conversionswhen passing the data to the external library algorithms. Storingthe data in RowStorage format also avoids unnecessary conversions later, since the input data will be added to the output of thestep in their original format. We use more memory to save CPUtime. When converting data from RowStorage format to Databaseformat we also perform the encoding of the categorical fields. Thissaves another pass from the whole data just to perform the encoding.When the data conversion is done, we may pass the data onto each one of the selected algorithms. The algorithms have theirown classes in the Algorithm module: DBOutliers, LOF, DBSCANand ABOD. These classes are basically adapter classes for the classesin the external library. When the algorithm’s run method is called,it calls the run method of the same algorithm in the external library.The run method returns a Result object containing the scores andlabels for that algorithm. If the outlier ensemble was selected, theResult objects will serve as input to the outlier ensemble. Theoutlier ensemble also returns a Result object. All the collectedresults are then converted to RowStorage and are concatenated tothe input fields, to serve as output of the step.3of freedom in DET are know as visual roles. A visual role specifies,for example, the number of fields that can be mapped to it and whatare their data types. A View implements the actual rendering usingthe chosen technologies (HTML, CSS, Javascript, SVG, etc.) andhandles user interaction by dispatching actions on the associatedmodel, such as drilling-down and showing tooltips.The companion data visualizations are Scatterplot and ParallelCoordinates. Scatterplot can be seen in Figure 8. This visualizationhas three visual roles: Horizontal Axis, Vertical Axis, and OutlierLabel. An outlier label is encoded as color; inliers are shown ingreen, while outliers are shown in red. The Parallel Coordinates canbe seen in Figure 9. This visualization has two visual roles: Axes,and Outlier Label. An outlier label is encoded as color; inliers areshown in green, while outliers are shown in red.Figure 8: The Scatterplot companion data visualization.COMPANION DATA VISUALIZATIONSIn this section we analyze the companion data visualizations to theOutlier Detection step.3.1FunctionalityThe main goal of the companion data visualizations is to providea convenient way for visualizing the results of the Outlier Detection step, so that users can easily assess the quality of the outlierdetection results. As we saw in Section 2.1.2, the output of theOutlier Detection step is a table that always consists of the inputfields selected for detection and the outlier labels for each one ofthe selected algorithms (and possibly the ensemble); the outlierscores of the selected algorithms and the ensemble are optional.The companion data visualizations allow users to select an outlierlabel from the Outlier Detection step results and visualize the label value assigned to each data record. These visualizations werespecifically included for supporting the Outlier Detection step andexpect that an outlier label is present in the data source.The Data Exploration Tool (DET) enables users to easily accessvisualizations of step data. A set of stock visualizations is includedcovering the most common chart types. Visualizations in DET adoptan Model-View-Controller (MVC) pattern. The Model identifies thevisualization and defines it in terms of its data requirements, suchas its visual degrees of freedom (spatial position, color, size, etc.)and any major options that affect its rendering. The visual degreesFigure 9: The Parallel Coordinates companion data visualization.User interaction is similar for both visualizations. When a userchooses a visualization, the visual roles are automatically filled in;the first outlier label found in the data source is mapped to the Outlier Label role and the input fields selected in the Outlier Detectionstep are mapped to the remaining roles, i.e., Horizontal Axis andVertical Axis on Scattterplot, and Axes on Parallel Coordinates. Ifmultiple outlier labels are present in the data source, as is the casein Figure 9, users can drag-and-drop any of them in the OutlierLabel role. This allows users to visualize results for all chosen algorithms on the same visualization, although not simultaneously.We chose to restrict users from editing the remaining visual rolesbecause all input fields present in the data source were used in the5
detection, i.e., if a user removed a field from one of those roles, theoutlier results would still refer to the set of all input fields, not thecurrent set of fields. A companion data visualization is only madeavailable to the users if their data requirements are satisfied, i.e.,the number and data type of input fields match the ones requiredby the visualization. This type of restrictions and automatic mapping of fields to visual roles is a new use case for the application.Users typically have to drag-and-drop fields on visual roles and areallowed to explore the data without restrictions.3.2For validating the present work, we conducted both formativeand summative usability tests. Formative usability tests were important for identifying some problems during the design phase. Weconcentrate on the summative usability tests, which evaluate thesuccess of the final product.In the formative tests a user suggested that the outlier ensemblecould be automatically selected when a second algorithm is selected,so we decided to use A/B testing to test two slightly different versions of the step: in version A the ensemble is not automaticallyselected, while in version B it is. Version B required some modifications to the user interface, which are illustrated in Figure 10. InFigure 10a we can see that in this version the Run ensemble? boxis in the Algorithms tab, since the ensemble can be automaticallyselected and if the box remained in the Ensemble tab, users mightnot realize that it was checked without having clicked on it. Thismeans that in this version the Ensemble tab contains only the ensemble parameters, and thus was renamed Ensemble parameters, aswe can see in Figure 10b.ImplementationThe Model and View are specified with the Pentaho VisualizationAPI 4 , which provides a unified way to visualize data across theHitachi Vantara products. The actual rendering of the data wasdone using two different technologies. The Scatterplot companiondata visualization was based on the Scatterplot visualization alreadyavailable in DET. This visualization uses the Community ChartsComponent (CCC)5 charting library, which is built on top of Protovis6 . The Parallel Coordinates companion data visualization usesthe D3.js7 library.3.3LimitationsTo automatically fill in the visual roles of the companion data visualizations we need a way to distinguish outlier labels - and outlierscores, which may be used in the tooltips - from the input data fieldsused in the detection. Since the data source does not contain anymetadata that allows us to make this distinction, we find outlier labels by simply comparing the names of the fields in the data sourcewith the hard coded names we give to the outlier label columnsin the output of the Outlier Detection step: ’DB-Outliers Label ’,’LOF Label ’, ’DBSCAN Label ’, and ’ABOD Label ’. We considerany fields in the data source whose name contains the suffix ’ Label ’ to be outlier labels. The same methodology is applied foroutlier scores; we consider any fields in the data source whosename contains the suffix ’ Score ’ to be outlier scores. Input fieldsare then the remaining fields found in the data source. This is farfrom ideal, since it may be the case that the name of some inputfield used in the detection may contain the suffixes we are waitingfor. If this is the case, an input field used in the detection would bewrongly labeled as an outlier label, or score, by the visualizationmodel, leading to incorrect models.4(a) Algorithms tab.(b) Ensemble parameters tab.Figure 10: Changes to the Dialog on version B of the OutlierDetection step.4.1Experimental ProtocolTwenty users participated in the tests. They were divided into twogroups, A and B, to test Outlier Detection step versions A and B,respectively. We initiated the tests by asking users some questionsregarding their age and gender, their familiarity with the conceptsof Outlier and Outlier detection (domain knowledge), and their levelof experience with PDI. Before performing the tasks users watcheda presentation on essential concepts of outlier detection, and also ademonstration video of the Outlier Detection step and the companion data visualizations. Users were asked to perform three tasks,which were designed so that users would have to use the step toselect both numerical and categorical fields, as well as all the algorithms available and the outlier ensemble. We also wanted the usersto visualize more than one algorithm in the visualizations. Duringthe tasks the observer collected three usability measures: (i) thenumber of errors committed while performing the task, (ii) the timespent performing the task, and (iii) the number of tasks successfully completed. Half the users performed the tasks in one order(1,2,3) and the other half in a different order (2,1,3), to guaranteethat the results are independent from the order in which the tasksUSABILITY EVALUATIONTests with users are important to measure the performance andsatisfaction of typical users performing typical tasks in the systemunder evaluation [4]. Performance measures include, for example,the time spent performing the task, the number of errors committedwhile performing the task, the time spent using help and documentation, the number of tasks successfully completed, etc. Satisfactiontypically involves interviewing the users or asking them to answersatisfaction questionnaires.4 er center/Visualization API5 munity-chart-components6 http://mbostock.github.io/protovis/7 https://d3js.org/6
4.3were performed. After performing the tasks users were asked somequestions about their satisfaction with the system under evaluation.For achieving this we used the System Usability Scale (S
Pentaho Data Integration (PDI) is a well-known data integration tool with an open source version, open to additions by the community. PDI currently lacks many data profiling function- alities. One of the missing data profiling functionalities that has been deemed relevant by PDI users is outlier detection.