Transcription
Integrating Approximate Duplicate Detection into PentahoData IntegrationSı́lvia Castro FernandesThesis to obtain the Master of Science Degree inInformation Systems and Computer EngineeringSupervisors: Prof. Helena Isabel de Jesus GalhardasProf. Daniel Jorge Viegas GonçalvesExamination CommitteeChairperson: Prof. Luı́s Manuel Antunes VeigaSupervisor: Prof. Helena Isabel de Jesus GalhardasMember of the Committee: Prof. Cláudia Martins AntunesNovember 2019
AcknowledgmentsFirst and foremost, I would like to thank my parents for their constant support and care, not just inthis phase of my life, but always. I also thank my sister for her constant encouragement and motivation.I thank my supervisors, Professor Helena Galhardas and Professor Daniel Gonçalves for their guidance, support and sharing of knowledge in the development of this work.I thank Hitachi Vantara for the opportunity to develop this work in such a supportive environmentand thank everyone that in some way contributed to its success. A special thank you to Marco Vala, forsupporting me and taking time to discuss ideas, allowing me to see things from a different perspective.Thank you to Márcio Santos for always being available to talk about ideas and problems as theyappeared, even when having to deal with situations that would arise in his own work.Finally, thank you to my friends that have been with me throughout this journey and have alwaysbeen there to listen and to help.
AbstractData has increasingly become a fundamental asset for the great majority of companies and it keepsbeing produced at a very high rate. This profusion leads to large volumes of data to be handled andthe characteristics of the data, like the names and types of the attributes, may not be known upfront.Data Profiling helps to overcome this problem, enabling to gather data about the data to be handled,allowing the people that have to explore large datasets to gain knowledge about the data they areworking with. Large datasets are prone to data quality problems that can have a negative impact on theresults of the analysis based on the data. Data profiling also plays an important role in identifying dataquality problems, for example by computing the number of missing values. The presence of approximateduplicate records is a data quality problem that arises commonly in a data integration context. Dataintegration consists in a set of processes that enable uniform access to different data sources. Dataprofiling is relevant in this context, enabling to learn characteristics of different datasets before integratingthem.Approximate duplicate records are records that, even if not being identical, represent the same realworld entity. If this problem is not detected, these records are processed as separate entities, influencingin a negative way the results of analysis performed on the data. For example, if a client is present in twodifferent data sources that are integrated, that client’s record may be duplicated in the final data sourceand the client will be treated as two different clients.Data integration tools can benefit from an approximate duplicate detection mechanism, but not alltools provide one. Pentaho Data Integration (PDI) is an open source data integration tool that was usedas a case study for the inclusion of approximate duplicate detection.To address this problem, we developed two PDI steps that allow the user to compute approximateduplicates. The Domain-Independent Duplicate Detection step computes approximate duplicates in adomain-independent way, allowing the user to obtain approximate duplicate groups without providingdomain-specific information. The Approximate Duplicate Detection step allows the user to specify whichfields should be used to compute similarity as well as the measures to compute similarity for the recordsof each field and the weight it should have in the overall similarity. Since approximate duplicate detectioncan raise efficiency issues if all records are compared to each other, both steps offer alternatives to thislarge number of comparisons. We also adapted one of the PDI visualizations to make it easier foriii
the user to interpret the results. Our solution was evaluated considering correctness, performance andusability. The steps yielded positive results regarding correctness, although the Approximate DuplicateDetection step output highly depends on the configurations performed by the user. Performance testsfor both steps proved they present better alternatives to the cartesian product. The usability of the stepswas validated by user tests, that were mainly successful, and the users were overall satisfied with thedeveloped work.KeywordsApproximate Duplicate Detection; Data Profiling; Data Quality; Pentaho Data Integrationiv
ResumoOs dados têm-se tornado um recurso fundamental para a generalidade das empresas e são produzidosa um ritmo muito elevado. Esta profusão leva à existência de grandes volumes de dados para seremprocessados e as suas caracterı́sticas, como os nomes e tipos dos atributos, podem não ser logo conhecidos. Data Profiling ajuda a superar este problema, através da recolha de dados acerca dos dadosque vão ser processados, permitindo às pessoas que têm de explorar grandes conjuntos de dadosadquirir conhecimento acerca dos dados com que estão a trabalhar. Conjuntos de dados grandes sãopropensos a problemas de qualidade, que podem ter um impacto negativo nos resultados de análisesaos dados.Data profiling desempenha, igualmente, um papel importante na identificação de problemas de qualidade de dados, por exemplo calculando o número de valores em falta. A presença de registos duplicados aproximados é um problema de qualidade de dados que surge normalmente num contexto deintegração de dados. Integração de dados consiste num conjunto de processos que permite a inclusãode dados de diferentes proveniências. Data profiling é relevante neste contexto, permitindo que sedescubram caracterı́sticas de diferentes conjuntos de dados antes de estes serem integrados.Registos duplicados aproximados são registos que, podendo não ser iguais, representam a mesmaentidade real. Se este problema não for detetado, estes registos serão processados como entidadesdiferentes, podendo influenciar negativamente os resultados de análises feitas aos dados. Por exemplo,se um cliente estiver presente em dois conjuntos de dados que são integrados, o registo correspondentea esse cliente poderá estar duplicado no conjunto de dados resultante e o cliente será tratado comodois clientes diferentes.As ferramentas de integração de dados podem beneficiar de um mecanismo de deteção de duplicados aproximados, mas nem todas as ferramentas oferecem este recurso. O Pentaho Data Integration(PDI) é uma ferramenta open source de integração de dados que foi usada como caso de estudo paraa inclusão de deteção de duplicados aproximados.Para abordar este problema, desenvolvemos dois steps de PDI que permitem ao utilizador calcularduplicados aproximados. O step Domain-Duplicate Detection calcula duplicados aproximados independentemente do domı́nio, permitindo ao utilizador obter grupos de duplicados aproximados sem fornecerinformação especı́fica a um domı́nio. O step Approximate Duplicate Detection permite ao utilizador esv
pecificar que campos devem ser usados para calcular a semelhança, assim como que medidas usarpara calcular a semelhança entre os registos de cada campo e o peso que essa semelhança deve terna semelhança total. Uma vez que a deteção de duplicados aproximados pode levantar problemas deeficiência se todos os registos forem comparados entre si, os steps desenvolvidos oferecem alternativasa este número elevado de comparações. Também adaptámos uma das visualizações disponı́veis noPDI para facilitar a interpretação dos resultados dos steps pelos utilizadores.A nossa solução foi avaliada em termos de correção, desempenho e usabilidade. Os steps produziram resultados positivos relativamente à correção, embora os resultados do step Approximate DuplicateDetection sejam bastante dependentes das configurações feitas pelo utilizador. Os testes de desempenho provaram que os dois steps apresentam melhores alternativas ao produto cartesiano. A usabilidade dos steps foi validada com testes de utilizadores, que foram maioritariamente bem-sucedidos,tendo os utilizadores ficados, no geral, satisfeitos com o trabalho desenvolvido.Palavras ChaveDeteção de Duplicados Aproximados; Data Profiling; Qualidade de Dados; Pentaho Data Integration;vi
Contents1 Introduction11.1 Problem . . . . . . . . . . . . . . . . . . . . . . . . . . . . . . . . . . . . . . . . . . . . . .31.2 Objectives . . . . . . . . . . . . . . . . . . . . . . . . . . . . . . . . . . . . . . . . . . . . .41.3 Contributions . . . . . . . . . . . . . . . . . . . . . . . . . . . . . . . . . . . . . . . . . . .51.4 Document Outline . . . . . . . . . . . . . . . . . . . . . . . . . . . . . . . . . . . . . . . .52 Background72.1 Data Profiling . . . . . . . . . . . . . . . . . . . . . . . . . . . . . . . . . . . . . . . . . . .92.1.1 Single-Column Profiling Tasks . . . . . . . . . . . . . . . . . . . . . . . . . . . . .112.1.2 Multi-Column Profiling Tasks . . . . . . . . . . . . . . . . . . . . . . . . . . . . . .122.1.3 Dependencies . . . . . . . . . . . . . . . . . . . . . . . . . . . . . . . . . . . . . .122.2 Approximate Duplicate Detection . . . . . . . . . . . . . . . . . . . . . . . . . . . . . . . .132.2.1 String Matching Techniques . . . . . . . . . . . . . . . . . . . . . . . . . . . . . . .142.2.2 Record Matching Techniques . . . . . . . . . . . . . . . . . . . . . . . . . . . . . .152.2.3 Scalability . . . . . . . . . . . . . . . . . . . . . . . . . . . . . . . . . . . . . . . . .162.2.3.1An efficient domain-independent algorithm for detecting approximatelyduplicate database records . . . . . . . . . . . . . . . . . . . . . . . . . .2.3 Data Visualization Techniques. . . . . . . . . . . . . . . . . . . . . . . . . . . . . . . . .3 Related Work1718213.1 Commercial Data Profiling Tools . . . . . . . . . . . . . . . . . . . . . . . . . . . . . . . .233.1.1 Pentaho Data Integration . . . . . . . . . . . . . . . . . . . . . . . . . . . . . . . .243.2 Research Data Profiling Tools . . . . . . . . . . . . . . . . . . . . . . . . . . . . . . . . . .264 Approximate Duplicate Detection Steps294.1 PDI Step Architecture . . . . . . . . . . . . . . . . . . . . . . . . . . . . . . . . . . . . . .314.2 Domain-Independent Duplicate Detection . . . . . . . . . . . . . . . . . . . . . . . . . . .324.2.1 Algorithm . . . . . . . . . . . . . . . . . . . . . . . . . . . . . . . . . . . . . . . . .324.2.2 Modifications to the Algorithm . . . . . . . . . . . . . . . . . . . . . . . . . . . . . .344.2.3 Step Architecture . . . . . . . . . . . . . . . . . . . . . . . . . . . . . . . . . . . . .36vii
4.2.4 Step Logic . . . . . . . . . . . . . . . . . . . . . . . . . . . . . . . . . . . . . . . .364.2.5 Step UI . . . . . . . . . . . . . . . . . . . . . . . . . . . . . . . . . . . . . . . . . .374.3 Approximate Duplicate Detection Step . . . . . . . . . . . . . . . . . . . . . . . . . . . . .384.3.1 Implemented Strategies . . . . . . . . . . . . . . . . . . . . . . . . . . . . . . . . .384.3.2 Step Architecture . . . . . . . . . . . . . . . . . . . . . . . . . . . . . . . . . . . . .404.3.3 Step Logic . . . . . . . . . . . . . . . . . . . . . . . . . . . . . . . . . . . . . . . .414.3.4 Step UI . . . . . . . . . . . . . . . . . . . . . . . . . . . . . . . . . . . . . . . . . .424.4 Visualization . . . . . . . . . . . . . . . . . . . . . . . . . . . . . . . . . . . . . . . . . . .435 Validation475.1 Datasets . . . . . . . . . . . . . . . . . . . . . . . . . . . . . . . . . . . . . . . . . . . . . .495.2 Correctness . . . . . . . . . . . . . . . . . . . . . . . . . . . . . . . . . . . . . . . . . . . .505.2.1 Domain-Independent Duplicate Detection step correctness . . . . . . . . . . . . .505.2.2 Approximate Duplicate Detection step correctness . . . . . . . . . . . . . . . . . .525.2.3 Discussion . . . . . . . . . . . . . . . . . . . . . . . . . . . . . . . . . . . . . . . .555.3 Performance . . . . . . . . . . . . . . . . . . . . . . . . . . . . . . . . . . . . . . . . . . .555.3.1 Domain-Independent Duplicate Detection step performance . . . . . . . . . . . . .565.3.2 Approximate Duplicate Detection step performance. . . . . . . . . . . . . . . . .575.3.3 Discussion . . . . . . . . . . . . . . . . . . . . . . . . . . . . . . . . . . . . . . . .585.4 Usability . . . . . . . . . . . . . . . . . . . . . . . . . . . . . . . . . . . . . . . . . . . . . .605.4.1 Formative Tests. . . . . . . . . . . . . . . . . . . . . . . . . . . . . . . . . . . . .605.4.2 Summative Tests . . . . . . . . . . . . . . . . . . . . . . . . . . . . . . . . . . . . .625.4.2.1Experimental Protocol . . . . . . . . . . . . . . . . . . . . . . . . . . . . .625.4.2.2Results . . . . . . . . . . . . . . . . . . . . . . . . . . . . . . . . . . . . .635.4.3 Discussion . . . . . . . . . . . . . . . . . . . . . . . . . . . . . . . . . . . . . . . .686 Conclusion716.1 Limitations and Future Work . . . . . . . . . . . . . . . . . . . . . . . . . . . . . . . . . . .73A Basic Statistics Step81B Summative Tests Plan85C Usability Questionnaire91viii
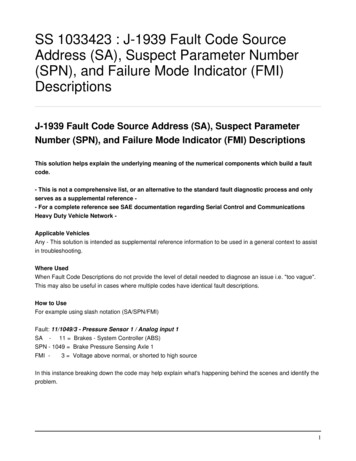
List of Figures1.1 A PDI transformation to detect approximate duplicate records . . . . . . . . . . . . . . . .42.1 Classification of data profiling tasks. . . . . . . . . . . . . . . . . . . . . . . . . . . . . . .102.2 Visualization Techniques . . . . . . . . . . . . . . . . . . . . . . . . . . . . . . . . . . . . .203.1 The DET workspace . . . . . . . . . . . . . . . . . . . . . . . . . . . . . . . . . . . . . . .263.2 Approximate duplicate record clusters on Profiler . . . . . . . . . . . . . . . . . . . . . . .284.1 A PDI step life cycle . . . . . . . . . . . . . . . . . . . . . . . . . . . . . . . . . . . . . . .324.2 Domain-independent algorihm flow chart. . . . . . . . . . . . . . . . . . . . . . . . . . .334.3 Flow chart of the domain-independent algorithm with the implemented modifications . . .354.4 Domain-Independent Duplicate Detection step architecture . . . . . . . . . . . . . . . . .364.5 Domain-Independent Duplicate Detection step UI . . . . . . . . . . . . . . . . . . . . . . .384.6 Flow chart of the Approximate Duplicate Detection step processing . . . . . . . . . . . . .394.7 Approximate Duplicate Detection step architecture . . . . . . . . . . . . . . . . . . . . . .414.8 Approximate Duplicate Detection step UI . . . . . . . . . . . . . . . . . . . . . . . . . . . .434.9 Original Flat Table visualization . . . . . . . . . . . . . . . . . . . . . . . . . . . . . . . . .444.10 Modified Flat Table visualization . . . . . . . . . . . . . . . . . . . . . . . . . . . . . . . . .455.1 F1-score evolution for different datasets . . . . . . . . . . . . . . . . . . . . . . . . . . . .525.2 Average execution time per number of records for the Domain-Independent DuplicateDetection step . . . . . . . . . . . . . . . . . . . . . . . . . . . . . . . . . . . . . . . . . .575.3 Execution time for increasing number of approximate duplicates per record for the DomainIndependent Duplicate Detection step . . . . . . . . . . . . . . . . . . . . . . . . . . . . .575.4 Execution times for the Approximate Duplicate Detection step performing the cartesianproduct . . . . . . . . . . . . . . . . . . . . . . . . . . . . . . . . . . . . . . . . . . . . . .585.5 Execution times for the Approximate Duplicate Detection step partitioning the data by oneattribute . . . . . . . . . . . . . . . . . . . . . . . . . . . . . . . . . . . . . . . . . . . . . .ix59
5.6 Execution time for increasing number of approximate duplicates per record for the Approximate Duplicate Detection step with different sized datasets . . . . . . . . . . . . . . .595.7 The tested UI for the Domain-Independent Duplicate Detection step . . . . . . . . . . . .605.8 The tested UI for the Approximate Duplicate Detection step . . . . . . . . . . . . . . . . .615.9 Distribution of the users’ familiarity with PDI and the approximate duplicate detection domain 645.10 Questionnaire answers for the Domain-Independent Duplicate Detection step . . . . . . .665.11 Questionnaire answers for the Approximate Duplicate Detection step . . . . . . . . . . . .675.12 Questionnaire answers for the Table visualization . . . . . . . . . . . . . . . . . . . . . . .67A.1 Basic Statistics Step User Interface . . . . . . . . . . . . . . . . . . . . . . . . . . . . . . .83x
List of Tables2.1 Example dataset 1 . . . . . . . . . . . . . . . . . . . . . . . . . . . . . . . . . . . . . . . .102.2 Example dataset 2 . . . . . . . . . . . . . . . . . . . . . . . . . . . . . . . . . . . . . . . .113.1 Commercial data profiling tools and their data profiling functionality . . . . . . . . . . . . .233.2 Research data profiling tools and their data profiling functionality . . . . . . . . . . . . . .265.1 Precision and recall for the implementation of the algorithm without modifications . . . . .505.2 Precision and recall for the implementation of the algorithm with the Union operation verification . . . . . . . . . . . . . . . . . . . . . . . . . . . . . . . . . . . . . . . . . . . . . . .515.3 Precision and recall for the implementation of the algorithm with the Union operation verification and without resetting the group of unmatched records . . . . . . . . . . . . . . . .515.4 Precision, recall and F1-score for the Approximate Duplicate Detection step with therestaurants dataset. . . . . . . . . . . . . . . . . . . . . . . . . . . . . . . . . . . . . . . .535.5 Precision, recall and F1-score for the Approximate Duplicate Detection step with theCORA dataset. . . . . . . . . . . . . . . . . . . . . . . . . . . . . . . . . . . . . . . . . . .535.6 Precision, recall and F1-score for the Approximate Duplicate Detection step with theFEBRL datasets. . . . . . . . . . . . . . . . . . . . . . . . . . . . . . . . . . . . . . . . . .545.7 Execution time for different similarity thresholds and increasingly larger datasets for theDomain-Independent Duplicate Detection step . . . . . . . . . . . . . . . . . . . . . . . .565.8 Task results . . . . . . . . . . . . . . . . . . . . . . . . . . . . . . . . . . . . . . . . . . . .645.9 Average values for the task results . . . . . . . . . . . . . . . . . . . . . . . . . . . . . . .65A.1 Statistics and their supported data types . . . . . . . . . . . . . . . . . . . . . . . . . . . .82xi
xii
1IntroductionContents1.1 Problem . . . . . . . . . . . . . . . . . . . . . . . . . . . . . . . . . . . . . . . . . . . . .31.2 Objectives . . . . . . . . . . . . . . . . . . . . . . . . . . . . . . . . . . . . . . . . . . .41.3 Contributions. . . . . . . . . . . . . . . . . . . . . . . . . . . . . . . . . . . . . . . . .51.4 Document Outline . . . . . . . . . . . . . . . . . . . . . . . . . . . . . . . . . . . . . . .51
2
Data has increasingly become a fundamental asset for the great majority of companies, being themIT related or not. Big volumes of data must be handled and, sometimes, the people responsible forprocessing the data may have close to no information about the dataset. These large datasets usuallypresent data quality problems, like missing or inconsistent data. Therefore, it is important to measure thequality of the data we are dealing with. Evaluating the quality of a dataset is relevant because decisionswill be made based on that data and if it is not clean and consistent, those decisions will not be reliable.To improve data quality, it is essential to know all the characteristics of our dataset, for example howmany tables there are, the names of the tables and the names of the attributes or the number of nullvalues for an attribute. Hence, it is important to collect data about the data, designated metadata, whichmay include the names and types of the attributes, but also properties of the data like the number ofnull records, value distributions or dependencies between attributes. Data profiling [1] is the activity thatencloses a set of processes to obtain metadata regarding the dataset that is being handled.Data profiling has several applications, one of them being data integration. Data integration [2] isdefined as the set of techniques that enable a uniform access to a set of autonomous and heterogeneousdata sources through a common schema, enabling to query that common schema in order to get resultsfrom the various datasets simultaneously. Data integration is prone to encounter data quality problems,in particular, the occurrence of approximate duplicate records, meaning records that may not be identicalbut represent the same real-world entity. For example, if a company buys another company and theircustomer databases are integrated, the same customer may be present in both databases but with adifferent representation. We want to detect these records to prevent keeping and processing them asdifferent entities.1.1ProblemThere are several data integration tools in the market, such as Informatica Data Quality1 , Talend DataProfiler2 and Pentaho Data Integration (PDI)3 , but not all provide data profiling capabilities that areimportant to study the quality of a dataset.In particular, PDI is an open source tool that has limited data profiling functionality, consisting ofsimple statistics for numeric fields, like the mean value and percentiles, and data type recognition. PDIis an Extract, Transform and Load (ETL) tool that enables to integrate different types of data sources,apply some operations on the data, like sorting or merging data, and then save the results in a specifiedformat. These operations are represented by steps. Steps are connected by hops. Transformations area set of steps and hops. An example of a PDI transformation is shown on Figure 1.1. This transformation1 informatica-data-quality.html2 https://www.talend.com/resources/l-data-profiler3 n.html3
enables the detection of approximate duplicate records. It joins the data from two tables, performing acartesian product of the data. Then, attribute similarity is calculated between records and a formula tospecify how the similarities should be added is defined. Finally, the rows that do not satisfy the ruledefined in the previous step are filtered out.We use PDI as a case study for addressing the limitations of data integration tools in terms of dataprofiling functionality. It is also an opportunity to address the client needs for data profiling that wereidentified by Pentaho.Figure 1.1: A PDI transformation to detect approximate duplicate recordsAs mentioned above, approximate duplicate detection is an important task to ensure data qualitywhen integrating different data sources. This makes it a relevant task to be supported by data integrationtools such as PDI. It is possible to create a workflow to detect approximate duplicate records in PDI, asrepresented in Figure 1.1. However, performing approximate duplicate detection with this transformationhas several limitations: i) since we perform a cartesian product of the data, this will raise efficiencyproblems, specially for large datasets; ii) it may not be intuitive for a user that is not familiar with PDI tobuild a transformation to perform this task, requiring that the users are familiarized with a range of stepsand their configurations; iii) it offers limited functionality since we can only define simple rules to statehow two records should be considered approximate duplicates.1.2ObjectivesThe main objective of this work is to extend PDI’s capabilities to support data profiling, focusing on theimplementation of a flexible and efficient mechanism to detect approximate duplicate records.As presented in Section 1.1, it is already possible to build PDI transformations to detect approximateduplicates. Our goal is to design and implement PDI steps for approximate duplicate detection that offeralternatives to the cartesian product to deal with large datasets more efficiently and that are easy to useeven for users that are not very familiar with PDI or the approximate duplicate detection domain. Anotherobjective is to create a visualization that facilitates the interpretation of the results.4
1.3ContributionsWith the work in this thesis, we created two approximate duplicate detection steps and adapted one visualization to help interpret the results, hence giving the users more possibilities to compute approximateduplicate records.The first step to be developed, the Domain-Independent Duplicate Detection step, enables the userto compute approximate duplicate groups without the need to provide domain-specific information regarding the dataset. The other step, the Approximate Duplicate Detection step, allows to assign weightsand specific measures to compute the similarity between records of specified fields in the dataset, thatwill be used for computing approximate duplicate groups. Both steps provide alternatives to performinga cartesian product of the data.A Table visualization that already existed in PDI was modified to make it easier for users to visualizegroups of records.The steps were evaluated for correctness and performance, and user tests were performed to evaluate usability. The visualization was also submitted to user testing.1.4Document OutlineThis thesis is organized as follows.In Chapter 2, we provide the main concepts regarding data profiling and approximate duplicate detection, as well as a description of data visualization techniques used in a data quality context.In Chapter 3, we detail relevant work that has been performed in the data profiling area, analysingtools that support data profiling, both commercial and research, and comparing them based on theirsupport for data profiling tasks. We give special detail to PDI since this is the tool we are working with.In Chapter 4, we describe a PDI step architecture and the work done to integrate new ways ofperforming approximate duplicate detection, as well as the modifications made to the visualization.In Chapter 5, we evaluate the solution described in Chapter 4 regarding correctness, performanceand usability.In Chapter 6, we conclude the thesis, summarizing the implemented solution as well as its limitationsand we discuss possible future work.5
6
2BackgroundContents2.1 Data Profiling . . . . . . . . . . . . . . . . . . . . . . . . . . . . . . . . . . . . . . . . . .92.2 Approximate Duplicate Detection . . . . . . . . . . . . . . . . . . . . . . . . . . . . . . 132.3 Data Visualization Techniques . . . . . . . . . . . . . . . . . . . . . . . . . . . . . . . . 187
8
In this chapter, we give an overview of data profiling and explain its main tasks (Section 2.1). Then,we describe approximate duplicate detection (Section 2.2). Lastly, we give a brief overview of datavisualization techniques used in the context of data quality (Section 2.3).2.1Data ProfilingData profiling can be defined as the set of activities and processes for obtaining metadata from a givendataset [1]. It is an important activity for every IT professional that deals with data. The obtainedmetadata can go from simple statistics to complex dependencies that involve multiple columns.Relevant data profiling use cases include:1. Data Quality/Cleaning, where data profiling is used to measure the quality of data and to preparea cleaning process;2. Data Exploration, where data profiling allows us to understand how the data is structured andsome of its characteristics, like the number of distinct values;3. Database Management, since metadata is often part of the basic statistics a Database Management System (DBMS) gathers;4. Database Reverse Engineering, where we can use data profiling to identify attributes and relationsas well as domain semantics;5. Data Integration, where data profiling is used for schema matching (to help find correspondencesbetween elements, tables and attributes of two data sources);6. Big Data Analytics, where we can use data profiling to discover characteristics about the databefore starting to process the dataset.The typical data profiling procedure starts with the user specifying the data to be profiled and selecting the type of metadata to be generated. Then, a data profiling tool is chosen and it computes themetadata. The results are presented in a collection of tables, charts and other visualizations. Some discovered results can also be translated into rules or constraints to be used in a subsequent data cleaningstep.Data profiling imposes challenges such as: i) managing the input, meaning which profiling tasks toexecute on which parts of the data; ii) performing the computations, since the computational complexityof data profiling tasks depends on the size of data, which can become a problem when dealing with largedatasets; iii) managing the output, since we want to meaningfully interpret the data profiling results.9
Data profiling can be split into several tasks. Abedjan et al. [1] organize data profiling tasks forrelational data into categories that are arranged into three classes: single-column tasks, multi-columntasks and dependency detection tasks, as shown on Figure 2.1.Figure 2.1: Classification of data profiling tasks.We use the example provided in Tables 2.1 and 2.2 to illustrate the presented data profiling tasks.This example encloses two employee databases. Table 2.1 refers to a table with seven attributes wherean employee is identified by the EmpId attribute and Table 2.2 refers to a table with four attributes wherean employee is identified by the Id attribute.Table 2.1: Example dataset 1EmpId500501502503504505NameAlice Jo
Pentaho Data Integration (PDI) is an open source data integration tool that was used as a case study for the inclusion of approximate duplicate detection. To address this problem, we developed two PDI steps that allow the user to compute approximate duplicates. The Domain-Independent Duplicate Detection step computes approximate duplicates in a
![Duplicate Poker Guide[1] - Weblogs at Harvard](/img/66/duplicate-poker-guide1.jpg)