Transcription
A new Stratebi white paperwww.stratebi.comAug 2013Pentaho & SAS: Getting data from SAS and exploit it intoPentahoIn this post we try to unveil the capabilities of the new Pentaho Data Integration SASInput step. This new feature was included in the latest stable version of PDI (4.4) andis very useful for those corporations which use SAS as corporative Business Analyticstool and want to exploit the information into Pentaho BI Suite.This new add-on is an evidence of Pentaho strategy focused on expanding theirproducts and tools with new capabilitiesOur main goal in this document is reading a SAS file using PDI. In a second stage wewill make use of the information read using AgileBI plug-in included in PDI.1
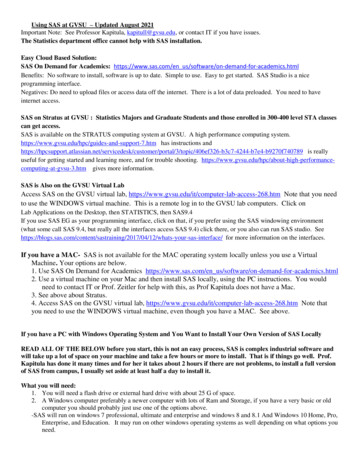
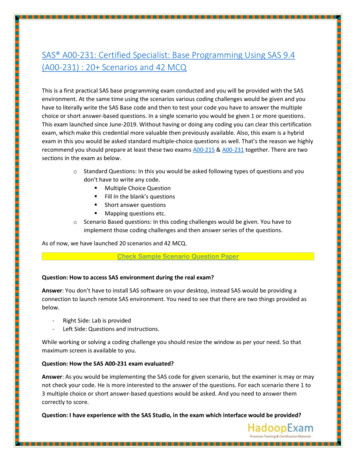
We are going to use as sample data the results of “Estimating and modelling relativesurvival using SAS” research carried out by Paul Dickman on 2004. Dickman’s studyincludes Finnish patients diagnosed with colon carcinoma between 1975 and ://biostat3.net/download/sas/readme.pdfSample data contains:-Age at diagnosisDate of diagnosisDate of exitMonth of diagnosisSexClinical stage at diagnosisAnatomical subsite of tumourSurvival time in completed monthsSurvival time in completed yearsDue to the fact that we are working at data level this new feature is available atransformation step. Below is a screenshot with the new SAS Input step.2
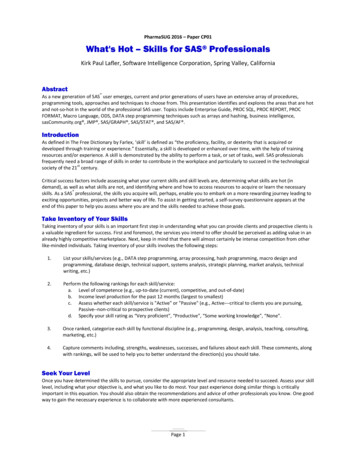
Below are listed the Pentaho Data Integration components used in this document: Get File Names: This step is used to indicate the path and name of SAS sourcefile.3
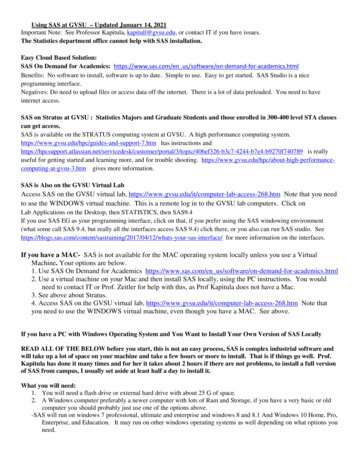
SAS Input: At the initial stage we should click on Get Fields button to retrievethe name and properties of the fields included in the SAS file. Then if weconsider it necessary we could change the properties identified by PDI.4
Select values: In this step we filter the fields from the stream. Table output: Finally we save the sample data into a MySQL table. If thetable doesn’t exist PDI provides a SQL button which creates an autogenerated SQL code ready to create the table.5
Once we have data stored in a table, we will easily visualize them using PDI. At thetop right there is a Perspective selection toolbar. Up to now during the ETL designprocess the perspective selected was Data Integration option.By selecting Model option we could observe at a glance the data of our model in anOLAP view (Analysis tab), besides it is also available the option of building a reportwith a wizard (Reporting tab).Analysis perspectiveReporting perspective6
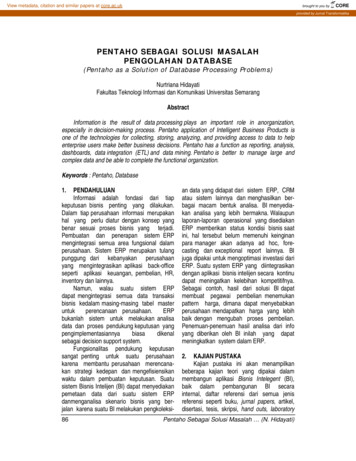
First we will assign a Model Name to our model and define a Datasource. Our dataorigin will be the MySQL table previously defined.Next, having selected the Analysis scene we start designing a multidimensionalstructure. It is necessary to define at least one measure and one dimension to makeuse of the information in an OLAP view.We define average age measure (media edad) with an aggregation function ofaverage. We select the field saved into the database table named age, as is evidentwith this indicator we could analyze the average age of the population.In a similar way we proceed to create a dimension containing the sex of eachpatient. This dimension will only include one hierarchy and one level called sex andthe table field is also named sex in the database.7
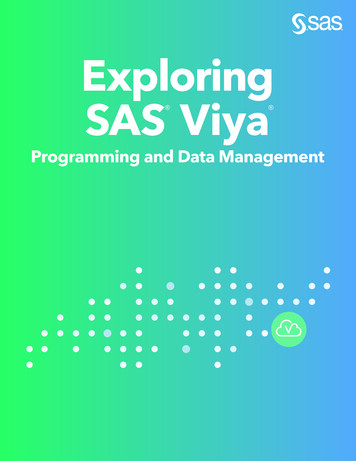
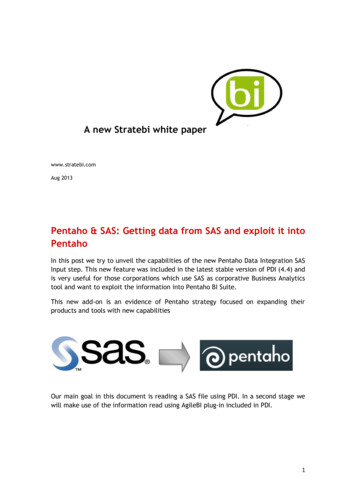
In order to visualize the OLAP structure we have developed we should only click onGo button to launch Visualize perspective.Situated on this perspective we could drag and drop into rows and columns themeasures and dimensions we have created in the previous stage. At the top right ofthe tool exists a View as toolbar to switch between table and chart format.Table formatChart format8
Then, we move to define a reporting metadata structure. At first, it is required thecreation of a category and select the fields that we want to have available in furtherstages. These are the fields chosen: Age (edad) age field in databaseClinical stage at diagnosis (fase) stage field in databaseSurvival time in completed years (tiempo superviviencia) surv yy field indatabaseIn order to gain knowledge of the metadata we have just generated, we selectReport Wizard and click on Go button. Automatically we will be directed to Visualizeperspective, here we have to choose a template.9
Next, we select the fields we want to show in the report. We choose age (edad),clinical stage at diagnosis (fase) and the average of survival time in completed years(tiempo supervivencia) sorted in ascending order by clinical stage and patient age.10
Then, we design the layout of the report. Our main objective is to show the resultsgrouped by clinical stage and patient age.After that we could change format properties such as alignment, width, formatstrings 11
Finally, we have our report finished in less than 5 minutes. It is possible to edit thereport by pushing Report Wizard button located in the Visualization Propertiespalette located at the right side of the tool.This powerful tool allows us to save the metadata structure previously generatedwith .xmi extension available to reuse it in future.12
Pentaho & SAS: Getting data from SAS and exploit it into Pentaho In this post we try to unveil the capabilities of the new Pentaho Data Integration SAS Input step. This new feature was included in the latest stable version of PDI (4.4) and is very useful for those corporations which use SAS as corporative Business Analytics tool and want to .