Transcription
UC IrvineUC Irvine Previously Published WorksTitleContrast timing optimization of a two-volume dynamic CT pulmonary rg/uc/item/2tr280nwJournalScientific reports, 12(1)ISSN2045-2322AuthorsZhao, YixiaoHubbard, LoganMalkasian, Shantet al.Publication ht InformationThis work is made available under the terms of a Creative Commons Attribution License,availalbe at https://creativecommons.org/licenses/by/4.0/Peer reviewedeScholarship.orgPowered by the California Digital LibraryUniversity of California
www.nature.com/scientificreportsOPENContrast timing optimizationof a two‑volume dynamic CTpulmonary perfusion techniqueYixiao Zhao, Logan Hubbard, Shant Malkasian, Pablo Abbona & Sabee Molloi*The purpose of this study is to develop and validate an optimal timing protocol for a lowradiation-dose CT pulmonary perfusion technique using only two volume scans. A total of 24 swine(48.5 14.3 kg) underwent contrast-enhanced dynamic CT. Multiple contrast injections were madeunder different pulmonary perfusion conditions, resulting in a total of 141 complete pulmonaryarterial input functions (AIFs). Using all the AIF curves, an optimal contrast timing protocol wasdeveloped for a first-pass, two-volume dynamic CT perfusion technique (one at the base and theother at the peak of AIF curve). A subset of swine was used to validate the prospective two-volumepulmonary perfusion technique. The prospective two-volume perfusion measurements werequantitatively compared to the previously validated retrospective perfusion measurements witht-test, linear regression, and Bland–Altman analysis. As a result, the pulmonary artery time-to-peakTT(TPA) was related to one-half of the contrast injection duration ( 2Inj ) by TPA 1.01 2Inj 1.01 (r 0.95).The prospective two-volume perfusion measurements (PPRO) were related to the retrospectivemeasurements (PRETRO) by PPRO 0.87PRETRO 0.56 (r 0.88). The CT dose index and size-specific doseestimate of the two-volume CT technique were estimated to be 28.4 and 47.0 mGy, respectively. Theoptimal timing protocol can enable an accurate, low-radiation-dose two-volume dynamic CT perfusiontechnique.Computed tomography (CT) has enabled the non-invasive quantification of pulmonary perfusion allowingfor the assessment of pulmonary embolism and pulmonary h ypertension1–5. Existing dynamic CT perfusiontechniques require the entire contrast pass curve over many cardiac cycles for perfusion measurement, resultingin high radiation dose2,3,6–8. Moreover, the pulmonary perfusion measured by such techniques is known to beunderestimated due to the use of small tissue volumes for measurement9,10. Although dual-energy CT iodinemap is also used to depict pulmonary perfusion defects, it has limited contrast-to-noise ratio and cannot provide absolute pulmonary blood flow measurement 11–14. Hence, an accurate, low-dose dynamic CT perfusiontechnique is necessary for improved physiological assessment of pulmonary disease.Fortunately, previous studies have demonstrated that accurate cardiac and pulmonary perfusion measurementis feasible with a first-pass analysis (FPA) technique using only two volume scans9,10,15: one at the base (V1) andone at the peak (V2) of the arterial input function (AIF). Nevertheless, these prior validations required the entireAIF curve and retrospectively down-sampled to two volume scans for blood flow measurement. Hence, a timingprotocol for the true prospective implementation of two-volume FPA technique remains necessary, where suchprotocol can also account for different hemodynamic conditions and cardiac o utputs16,17.Thus, the purpose of this study is to develop an optimal timing protocol for the prospective two-volume FPAdynamic CT pulmonary perfusion technique. The central hypothesis is that the time interval between the twovolume scans can be pre-determined using the contrast injection parameters and an empirical time constant.Finally, using the proposed timing protocol, the accuracy of the two-volume prospective FPA dynamic CT perfusion technique was assessed and compared to the previously validated retrospective FPA perfusion technique15.MethodsEthical statement and ARRIVE guideline. All experiments were performed in accordance with theARRIVE guidelines. The study was approved by the Institutional Animal Care and Use Committee (IACUC, Protocol Number: AUP-18-191) at University of Irvine, California. A total of 24 male Yorkshire swine (48.5 14.3 kg)were used with 154 contrast injections, where thirteen were excluded due to injection failures and high injecDepartment of Radiological Sciences, Medical Sciences I, B‑140, University of California, Irvine, Irvine, CA 92697,USA. *email: symolloi@uci.eduScientific Reports (2022) 12:8212 123456789)
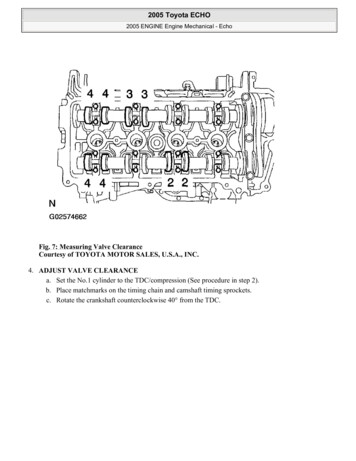
www.nature.com/scientificreports/Figure 1. Flowchart of the study. A total of 141 successful contrast injections were used in the Aim1 study ininvestigate the optimal acquisition time of the maximal contrast enhancement in pulmonary artery. A total of 60pulmonary CT acquisitions were used in the prospective two-volume perfusion validation study.tion rates. For aim 1, a total of 141 successful contrast injections were used to retrospectively develop an optimal timing protocol for the two-volume pulmonary perfusion technique. Specifically, the time-to-peak delaybetween the baseline and the peak time of the pulmonary arterial enhancement curve was predicted based onthe contrast injection duration and a dispersion time constant. For aim 2, prospective two-volume pulmonaryperfusion technique was simulated in a subset of fourteen swine with 60 contrast injections using the predictedtime-to-peak, where the remaining 81 injections were excluded as they were originally acquired as part of acardiac perfusion study with heart scan window (Fig. 1). The accuracy of the two-volume prospective techniquewas compared to the previously validated retrospective perfusion measurement15. All experimental data wasprospectively acquired by all authors between March 2016 and December 2017 and was retrospectively analyzedbetween June 2018 and July 2019. Y.Z., L.H. and Sh.M. conducted the data analysis, and a radiologist with morethan 15 years of clinical experience (P.A.) conducted the surgical and interventional procedures. The data thatsupport the findings of this study are available from the corresponding author, SM, upon reasonable request.S.M., has previously received grants from Canon America Medical Systems. The remaining authors have nothing to disclose.Animal preparation. All 24 swine were premedicated with Telazol (4.4 mg/kg), Ketamine (2.2 mg/kg) andXylazine (2.2 mg/kg) then intubated (Mallinckrodt, tube 6.0–8.0 mm, Covidien, Mansfield, MA). Anesthesiawas maintained with 1.5–2.5% Isoflurane (Baxter, Deerfield, IL) in oxygen via mechanical ventilation (Surgivet,Norwell, MA, and Highland Medical Equipment, Temecula, CA). Two femoral venous and one femoral arterial introducer sheaths (5-Fr AVANTIR, Cordis Corporation, Miami Lakes, FL) were placed for intravenouscontrast medium injection, fluid administration, and arterial pressure monitoring, respectively. An introducersheath and Swan-Ganz catheter were then placed into a distal pulmonary arterial branch, via the jugular vein,under fluoroscopic guidance for the eventual induction of balloon occlusion. The cardiac output was varied byproducing balloon occlusion in the left caudal lobe at different locations of the pulmonary artery. On average sixpulmonary perfusion studies were performed during each experiment. At the conclusion of each experiment, allanimals were euthanized with saturated KCI.CT imaging protocol.Contrast material (Isovue 370, Bracco Diagnostics, Princeton, NJ) was injected followed by a saline chaser (Empower CTA, Acist Medical Systems, Eden Prairie, MN). Multiple contrast injectionswere made for each animal and different injection rates and volumes were used as shown in Table 1. ECG-gateddynamic scanning was then performed with a 320-slice CT scanner (Aquilion One, Canon America MedicalSystems, Tustin, CA) for approximately 30 cardiac cycles during a ventilator-controlled inspiratory breath hold.The following scan parameters were used: tube voltage, 100 kVp; tube current, 200 mA; detector collimation,320 0.5 mm; volume scanning mode; gantry rotation time, 0.35 s; slice thickness, 0.5 mm; scan field-of-view,240–400 mm; voxel raster, 512 512; and a FC07 soft tissue reconstruction kernel with AIDR3D iterative reconstruction. A 20-minute time delay was used between all acquisitions to allow for adequate contrast materialrecirculation and redistribution.Scientific Reports Vol:.(1234567890)(2022) 12:8212 https://doi.org/10.1038/s41598-022-12016-82
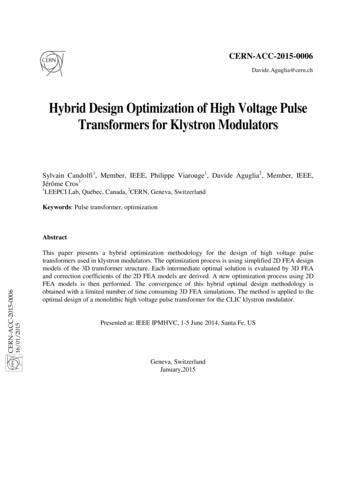
www.nature.com/scientificreports/Injection protocolsIodine dose per body weight (ml/kg)Saline chaser (ml/kg)Injection rate (ml/s)Protocol A10.55Protocol B0.50.255Table 1. Contrast injection protocols.Figure 2. Prospective imaging protocol and the corresponding arterial input functions. Top, imaging protocol.Tinj is the contrast injection duration, TD is the scanner-specific transition delay (2 s), and TP is the pre-definedtime-to-peak delay. Bottom, right ventricle (RV) and pulmonary artery (PA) arterial input functions (AIF). tV1and tV2 are the acquisition time of the first volume scan (V1) and the second volume scan (V2). The baselinevolumes used to emulate the bolus-tracking are shown in blue circles.Aim 1—time‑to‑peak delay estimation. In this study, we investigated the possibility of relating one-halfthe contrast bolus injection time (T Inj /2) and the time-to-peak delay (T P ) of the AIF (Fig. 2). Such a relationwas derived using the known contrast injection duration and the time-to-peak delay from the AIF, as describedin Eq. 1. An empirically derived dispersion delay ( Dx ) time constant was also introduced to describe the degreeof the contrast bolus mixing. Such a factor is proportional to the physical distance between the contrast injectionsite and vessel of interest used for the AIF generation (Eq. 1)TP α T inj Dx2(1)where α is the coefficient of the relation between one-half the injection time (T Inj /2) and the time-to-peak (T P ),Dx is the dispersion delay time constant.Data pre‑processing. The images from each contrast-enhanced CT acquisition were first registered usinga non-rigid algorithm18. Regions-of-interest (circular region with a diameter of 10 mm) were placed in theright ventricle, pulmonary artery, and descending aorta to generate arterial input functions (AIFs, Fig. 2). Next,a gamma-variate fitting (LSQCurveFit; Matlab 2013a, MathWorks) was performed on each dataset to generate smooth continuous AIF curves. Next, the 3D lung parenchyma was semi-automatically segmented using astandard commercial software (ViTAL Images, Lung CT, Pulmonary Analysis Workflow; Canon Medical Systems) and was used for the whole-lung FPA perfusion measurement. Further, 3D-segmentted binary masks ofapproximately 800–1400 mm3 were generated to measure regional perfusion. In summary, nine segments wereassessed for each animal, including one segment for the left cranial lobe, left lingula lobe, right cranial lobe, rightmiddle lobe, and accessory lobe; two segments for the left and right caudal lobes.Optimal retrospective protocol. Using the continuous AIF curve by the gamma variate fitting, the optimal acquisition timing for the baseline volume scan (V1) was defined as the peak of the second derivative,Scientific Reports (2022) 12:8212 123456789)
www.nature.com/scientificreports/Figure 3. Two-volume FPA perfusion protocol. The integrated contrast enhancement change ( Mc / t) withinthe lung compartment is measured by the tissue time attenuation curve (TAC, blue line). The average inputconcentration (Cin) is estimated from the pulmonary arterial input function (AIF, black line) at V1 and V2. Tpis the time-to-peak delay.indicating the AIF curve starts to rise (Fig. 2). The optimal acquisition timing for the second volume scan (V2)was then defined as the true peak of the gamma variate fit. The time-to-peak delay between V1 and V2 was thencomputed and then averaged over multiple acquisitions in each animal. The average time-to-peak delay wasrelated to one-half of the contrast injection time through regression analysis for both pulmonary artery anddescending aorta.Aim 2—prospective protocol simulation. Bolus-tracking (SureStart, Aquilion One, Canon MedicalSystems, Tustin, CA) was simulated for the prospective acquisition of the first volume scan (V1) at the base of thepulmonary artery AIF. It should be noted that there is a scanner transition dependent time delay (TD) betweenbolus-tracking and the acquisition of the first volume scan, which is less than 2 s for most scanners17. Hence, inorder to acquire V1 close to the baseline enhancement of the pulmonary artery, bolus tracking was done in theright ventricle (RV) instead of the pulmonary artery to trigger earlier and partially compensate for the scannertransition delay (Fig. 2). Further, in order to define the baseline enhancement of the blood pool, a minimum ofthree pre-contrast images were used to emulate bolus-tracking. Multiple offset thresholds above the baseline,e.g. 40, 60, 80, 100, 120 and 140 HU, were compared to optimize the acquisition of V1. In addition, the secondvolume scan (V2) was automatically chosen using the predicted time-to-peak delay that was defined in Eq. 1.Hence, the prospective timing protocol simulation is summarized in Eqs. 2 and 3 as:tV 1 t trigger TD(2)tV 2 tV 1 TP(3)where t V 1 and t V 2 are the acquisition time of the V1 and V2, t trigger is the triggering time determined by bolustracking in RV, TD is the transition delay between the trigger of bolus-tracking and the acquisition of V1, andT P is the predicted time-to-peak between the trigger and the peak of the AIF (Fig. 2). For clinical application,baseline (V1) and peak enhancement (V2) volume scans can be automatically acquired with predetermineddelay times in a single protocol. The delay time for acquisition of V1 is a scanner dependent transition delay time(TD), which is less than 2 s for most scanners. The delay time for acquisition of V2 is calculated using contrastinjection time.Two‑volume FPA CT perfusion measurement. First-pass analysis has previously been used for bloodflow measurement19,20. Assuming no contrast leakage over the measurement period ([t V 1 , tV 2 ]), the whole-lobecompartment is used to calculate the integrated contrast mass change in the perfusion bed ( M c/ t ) betweenV1 and V29,15. The average input contrast concentration (C in) of the pulmonary artery is also calculated betweenV1 and V2 (Fig. 3). Thus, the blood flow (Qave ) is represented by9,15:Qave 1 M cC in t(4)where Cin is the average input concentration, M c/ t is the rate of contrast mass change between tV 1 and tV 2,t tV 2 tV 1. Finally, the regional perfusion of each 3D-segment is calculated and compared between theScientific Reports Vol:.(1234567890)(2022) 12:8212 https://doi.org/10.1038/s41598-022-12016-84
www.nature.com/scientificreports/prospective and the reference retrospective two-volume pulmonary perfusion technique, where the retrospectivetwo-volume perfusion technique was previously validated against fluorescent m icrospheres15.Cardiac output estimation. Since the pulmonary circulation carries the entire cardiac output (CO) fromthe right ventricle to the supply the lung, CO can be approximately estimated by the total pulmonary blood flow21 (Eq. 6).Based on Eq. 4, the average contrast concentration change ( M c) within the entire compartment is proportional to the average pulmonary blood flow (Qave ), the contrast concentration change per voxel ( M x,y,z ) canbe used to define pulmonary blood flow on a voxel-by-voxel basis (Qx,y,z ) as:Qx,y,z QaveM x,y,zM c(5)Thus, the total pulmonary blood flow (Qpa), which is also the cardiac output (CO), is the summation of bloodflow into the segmented voxels in the lung tissue:nCO Qpa Qx,y,z(6)k 0Radiation dose.The CT dose index (CTDI32vol , mGy) and the dose-length product (DLP, mGy cm) wererecorded for each two-volume acquisition. Size-specific dose estimates (SSDE, mGy) were also calculated toaccount for the effective diameter of each swine22.Statistical approach. For the time-to-peak estimation, the empirical time-to-peak delays in the pulmo-nary artery and descending aorta were related to one-half the contrast injection time through linear regressionanalysis, where the root-mean-square-error (RMSE) and root-mean-square-deviation (RMSD) of the functionwere also calculated. The V2 acquisition time and contrast enhancement determined by the prospective protocolsimulation were then compared with the actual peak time and the actual peak enhancement using paired samplet-testing (SPSS, version 22, IBM, Armonk, NY). Finally, simulated prospective two-volume perfusion measurements were quantitatively compared to the corresponding retrospective perfusion measurements throughregression, Bland–Altman, RMSE, RMSD, and Lin’s concordance correlation coefficient (CCC).ResultsGeneral data and radiation dose exposure. A total of 24 swine with an average weight of 48.5 14.3 kg(25–91 kg) and an average heart rate of 89.5 15.0 bpm were used for this study. In total, 141 successful injections were included for the time-to-peak prediction study (Fig. 1). Overall, the contrast injection durationsranged from 2 to 15 s and the cardiac outputs ranged from 1.4 to 5.1 L/min. The average CTDI32vol and SSDEfor each dynamic perfusion CT acquisition were 258.2 and 427.3 mGy, respectively. For prospective perfusionmeasurement using only two volumes, the average CTDI32vol and SSDE were estimated to be 28.4 and 47.0 mGy,respectively.Aim 1—time‑to‑peak validation. The time-to-peak in the pulmonary artery ( TPA) and descendingaorta (TA) were related to one-half the contrast injection time by TPA 1.01TInj2 1.01(r 0.95, RMSE 0.45 s,T1.15 2Inj 1.81 (r 0.95, RMSE 0.82 s, RMSD 0.59 s), respectively (Fig. 4). TheRMSD 0.42 s) and TA intercepts correspond to organ-specific dispersion delay time constants ( Dx in Eq. 1).Aim 2—prospective protocol simulation. A total of 60 CT acquisitions from 14 swine were used for theprospective perfusion measurements with bolus-tracking simulation. For each of the triggering offsets, the pulmonary artery enhancement and acquisition time of the simulated volume scans were compared to the optimalvolume scans, as shown in Tables 2 and 3. To acquire V1 at a relatively low contrast enhancement, the triggeringoffset of 60HU in the RV was used in this prospective perfusion validation.Two‑volume FPA CT perfusion measurement. The perfusion assessments were based on a 9-segmentmodel with a total of 540 lung segments. The mean perfusion of the retrospective and the simulated prospective measurements were 8.43 4.54 ml/min/g and 7.84 4.47 ml/min/g (P 0.001), respectively. The simulatedprospective FPA perfusion (PPRO) were related to reference retrospective perfusion (PRETRO) measurements by PPRO 0.87PRETRO 0.56 (Pearson’s r 0.88, RMSD 0.85 ml/min/g, RMSE 2.29 ml/min/g), with a concordancecorrelation coefficient of 0.87 (Fig. 5a). The corresponding Bland–Altman analyses is also displayed in Fig. 5b.The linear regression results of perfusion measurements for individual lobes are shown in Table 4. There is noevident bias between lobes except for a larger error in the accessory lobe caused by the highly attenuating iodinein the vena cava. Representative examples of prospective two-volume FPA perfusion maps and the V2 image forone acquisition are shown in Fig. 6. Both the pulmonary arterial occlusion and the perfusion defect in the distalleft caudal lobe can be visualized by a single contrast injection.Scientific Reports (2022) 12:8212 123456789)
www.nature.com/scientificreports/Ideal Time-to-Peak (s)15TPA 1.01TInj/2 1.01TAorta 1.15TInj/2 1.81105Pulmonary: rPA 0.95RMSD 0.42s RMSE 0.45sAorta: rAorta 0.9500RMSD 0.59s RMSE 0.82s51015Half Injection Time (TInj/2) (s)Figure 4. Time-to-peak delays in the pulmonary artery and descending aorta. Gamma-fit ideal time-to-peakdelays were compared to the one-half injection time in all experimental animal data. Pulmonary arterial timeto-peak (black) and the aortic time-to-peak (red) are paralleled with different interceptions (dispersion factor).The blue dot line is the unity line. Gamma fit time-to-peak (TPA, TA) is defined as the time between the peak ofthe second derivative of the gamma fit and the true peak of the gamma fit, respectively. TInj: contrast injectiontime; RMSE: root-mean-square-error; RMSD: root-mean-square-deviation; r: Pearson correlation coefficient.V1V2Triggering offsets (HU)Time difference (s)RMSEP valueTime difference (s)RMSEP value400.61 0.610.86 0.05 0.61 0.981.16 0.05600.87 0.661.03 0.05 0.34 0.961.02 0.05801.05 0.661.24 0.05 0.17 0.900.910.2521001.20 0.691.37 0.05 0.03 0.850.850.9211201.38 0.721.56 0.050.16 0.830.841401.53 0.771.70 0.050.31 0.820.880.056 0.05Table 2. Simulated prospective acquisition time versus optimal acquisition time. The “Time Difference” showsthe time difference between each bolus-tracking simulation and the optimal acquisition timing. The optimalacquisition timing is obtained from the gamma variate fitting AIF curve, where V1 at the second derivativepeak of AIF and V2 at the AIF peak. RMSE root mean square error. If the p-value is 0.05 or lower, the resultis considered as significant difference.DiscussionIn this study, the time-to-peak delay of the pulmonary and aortic AIFs were evaluated in animals with a rangeof body weights (25–91 kg), contrast doses (20–100 mL), injection durations (2–15 s), and cardiac outputs(1.4–5.1 L/min). The results indicate that the injection duration is the most significant injection-related parameterimpacting the bolus time-to-peak, particularly in the case of short contrast injection duration. Furthermore, theregional perfusion results show good correlation between the simulated prospective FPA measurements and theoptimal retrospective FPA measurements. Such findings indicate that the proposed prospective timing protocolcan potentially be used for accurate, prospective, two-volume FPA perfusion measurement.Existing dynamic CT perfusion techniques, such as the maximum slope model and the deconvolutionmodel, require the entire contrast pass curve for perfusion measurement resulting in a high effective radiation dose3,7,23–27. Previous reports have shown that the reduction of temporal sampling frequency reduces the accuracies of these current techniques28. Although previous reports have shown that the FPA technique can accuratelymeasure the perfusion using only two volume scans as validated using microspheres9,15, the prospective acquisition of the two volume scans is challenging. With the knowledge of contrast timing information in advance,the prospective implementation of the two-volume perfusion technique can accurately measure the pulmonaryperfusion while substantially reducing the radiation dose. By reducing the total number of volume scans fromtwenty to two, such prospective perfusion technique also can significantly reduce breath-hold time for patientswith pulmonary disease, preventing the potential respiratory motion artifacts.Scientific Reports Vol:.(1234567890)(2022) 12:8212 https://doi.org/10.1038/s41598-022-12016-86
www.nature.com/scientificreports/CV1Triggering offsets (HU)CV2Enhancement (HU)RMSECV2–CV1Enhancement (HU)RMSEDifference ( HU)Optimal228.8 92.5–963.1 294.4–735.1 240.040340.1 151.9161.0923.1 302.877.8583.0 295.560389.1 173.4214.9914.6 311.296.4525.6 337.880422. 5 172.4237.7915.3 316.297.8493.6 332.9100446.3 183.2255.9914.9 319.998.3468.4 334.5120486. 3 187.4300.0900.0 332.5122.3413.5 357.5140514. 5 190.5325.3891.4 330.5134.6377.3 364.0Table 3. Simulated prospective enhancement versus optimal enhancement in the pulmonary artery. The“Optimal Enhancement” in the pulmonary artery is the simulated result from the gamma variate fitting curve.Specifically, CV1 was calculated as the average enhancement within the PA region at the time of the secondderivative peak, CV2 was the average enhancement within the PA region at the time of peak enhancement.The root-mean-square-error (RMSE) between each triggering protocol and the ideal enhancement was alsocalculated. The change in contrast enhancements ( HU) between C V1 and C V2 is shown in the last column. Pvalues in all comparisons are less than 0.001. Blood flow is measured based on HU. Therefore, it is best for CV1 to be as low as possible and CV2 to be as high as possible.302015PPRO- PRETRO(ml/min/g)PPRO (ml/min/g)2520PRRO 0.87PRETRO 0.56Pearson's r 0.88 CCC 0.87RMSD 0.85 ml/min/gRMSE 2.29 ml/min/g1510105Mean 1520PRETRO (ml/min/g)2530-200510152025Average Ppro and PRETRO(ml/min/g)(a)30(b)Figure 5. (a) Regression analysis comparing the result of simulated two-volume prospective perfusionmeasurements (PPRO) to the corresponding reference retrospective perfusion measurements (PRETRO). Eachdata point represents a 3D perfusion segment from the swine. For the retrospective assessment, the optimalV1 and V2 were selected at the base and peak of the AIF from the gamma fitting curve. For the prospectivemeasurement, bolus-tracking simulation was conducted in the right ventricle within triggering threshold at 60HU above the blood pool enhancement. (b) Bland–Altman analysis was performed with the limits of agreement.CCC: concordance correlation coefficient, RMSD: root-mean-square deviation, RMSE: root-mean-square error,SD: standard deviation.Bolus tracking is commonly used to detect the contrast arrival time within a region of interest in an inputartery. A fixed time delay is currently used to estimate the time to peak of the contrast bolus. In this study, we useda injection-specific time-to-peak estimation. Prior to recirculation phase of the contrast agent bolus passage, thegeometry of the arterial input function (AIF) is predominantly determined by the contrast bolus injection geometry and the bolus dispersion within the circulatory system, given a short contrast injection duration ( 15 s)17,29.Specifically, the initial approximate rectangular geometry of an undiluted contrast bolus injection will dilute anddisperse into a contrast pass curve, where the area under the curve remains conserved and the width of the curveremains proportional to the amount of the contrast volume injected at a fixed r ate30,31. Hence, despite contrastmixing and hemodynamic perturbation, the dispersion of the bolus primarily occurs at its temporal edges ortails; hence, the center of the AIF has the maximal contrast attenuation. As such, the time-to-peak delay fromthe AIF was pre-determined using one-half of contrast injection duration.Our results demonstrate that the injection duration can be used to predict the time-to-peak for differentinjection rates and volumes, and are therefore in agreement with a previous report indicating that the scanningdelay for the aortic peak is primarily affected by the injection duration17. To generalize our timing predictiontheory to clinical patients with different cardiac outputs, different levels of pulmonary arterial occlusions weregenerated in our swine model, resulting in a substantial decrease of cardiac outputs. Fortunately, the time-to-peakdelays under different scenarios were all closely related to one-half of the injection duration (Pearson’s r 0.95),indicating the robustness of the timing theory. Such results may also have important implications for optimal CTpulmonary angiography (CTPA), as the optimal time-to-peak delay can be predicted using the contrast injectionScientific Reports (2022) 12:8212 123456789)
www.nature.com/scientificreports/Segments (n)SlopeInterceptPearson rCCC RMSE (ml/min/g)RMSD (ml/min/g)P valueAll (540)0.87 (0.83, 0.90)0.56 (0.18, 0.93)0.88 (0.85, 0.89)0.87 (0.85, 0.89)2.290.85 0.001R Cranial (60)0.82 (0.66, 0.98)1.13 ( 0.42,2.68)0.81 (0.77, 0.83)0.80 (0.77, 0.83)2.230.830.051R Middle (60)0.77 (0.62, 0.93)0.91 ( 0.26,2.07)0.80 (0.77, 0.83)0.78 (0.75, 0.81)2.190.900.019R Caudal (120)0.91 (0.91, 1.00)0.49 ( 0.69,1.66)0.86 (0.83, 0.88)0.85 (0.82, 0.87)2.560.680.022AL (60)0.69 (0.53, 0.84)1.90 (0.65, 3.16)0.76 (0.72, 0.79)0.74 (0.71, 0.78)2.201.090.150L Cranial (60)0.84 (0.69, 0.99)0.87 ( 0.69,2.42)0.82 (0.81, 0.86)0.81 (0.78, 0.84)1.870.850.036L Lingula (60)0.80 (0.66, 0.93)0.63 ( 0.37,1.64)0.82 (0.79, 0.85)0.81 (0.78, 0.84)1.871.000.001L Caudal (120)0.84 (0.77, 0.91)0.50 ( 0.10,1.08)0.92 (0.90, 0.93)0.91 (0.89, 0.92)2.311.080.003Table 4. Regression of simulated two-volume prospective FPA perfusion versus retrospective FPA perfusion.Data in parentheses are 95% confidence intervals. P values less than 0.05 indicate significant difference. CCC:concordance correlation coefficient, RMSD: root-mean-square deviation, RMSE: root-mean-square error, AL:accessory lobe, R: right lung, L: left lung.CT Perfusion (ml/min/g)Simulated Prospective V2 imageFigure 6. Representative CT perfusion maps and the prospectively predicted V2 image. Top row: Axial,coronal, and 3D posterior views in the presence of balloon occlusions are shown. The color bar on the rightindicates the perfusion in the range from 0 to 20 ml/min/g. Bottom row: Axial, oblique-coronal CT angiographyusing maximum intensity projection reconstruction with 20 mm thickness and 3D pulmo
sheath and Swan-Ganz catheter were then placed into a distal pulmonary arterial branch, via the jugular vein, under uoroscopic guidance for the eventual induction of balloon occlusion. e cardiac output was varied by producing balloon occlusion in the le caudal lobe at dierent locations of the pulmonary artery. On average six