Transcription
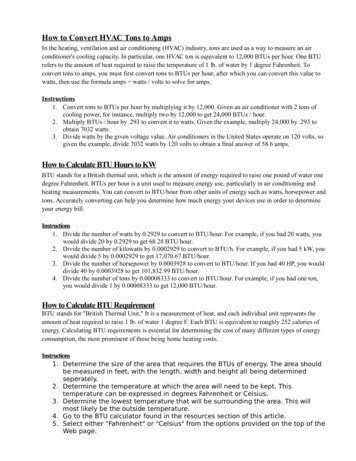
Table 25May 2022Table 25. Heating value of natural gas consumed, by state, 2020‐2022(Btu per cubic 1,0311,0211,038ColoradoConnecticutDelawareDistrict of NebraskaNevadaNew ,0441,0411,0221,0441,0571,0401,033New JerseyNew MexicoNew YorkNorth CarolinaNorth ennsylvaniaRhode 61,0321,0691,0301,0561,0361,029South CarolinaSouth ermontVirginiaWashingtonWest ,0391,0361,0381,0381,037StateSee footnotes at end of table.96U.S. Energy Information Administration Natural Gas MonthlyCreated on:5/24/2022 7:15:03 AM
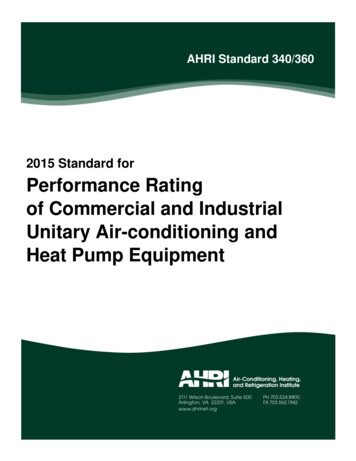
May 2022(Btu per cubic foot) – 0191,030ColoradoConnecticutDelawareDistrict of 1,0571,0611,033MissouriMontanaNebraskaNevadaNew ,0391,0291,0231,0471,0671,0371,028New JerseyNew MexicoNew YorkNorth CarolinaNorth ennsylvaniaRhode 61,0281,0691,0271,0561,0351,029South CarolinaSouth ermontVirginiaWashingtonWest ,0351,0351,0341,0351,034StateTable 25Table 25. Heating value of natural gas consumed, by state, 2020‐2022See footnotes at end of table.U.S. Energy Information Administration Natural Gas MonthlyCreated on:5/24/2022 7:15:31 AM97
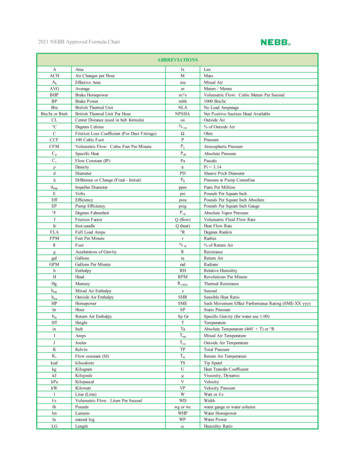
Table 25May 2022Table 25. Heating value of natural gas consumed, by state, 2020‐2022(Btu per cubic foot) – 41,0191,035ColoradoConnecticutDelawareDistrict of 1,0581,0561,028MissouriMontanaNebraskaNevadaNew ,0381,0321,0211,0461,0611,0451,035New JerseyNew MexicoNew YorkNorth CarolinaNorth ennsylvaniaRhode 81,0291,0721,0341,0521,0381,030South CarolinaSouth ermontVirginiaWashingtonWest ,0381,0411,0381,0371,039StateSee footnotes at end of table.98U.S. Energy Information Administration Natural Gas MonthlyCreated on:5/24/2022 7:16:01 AM
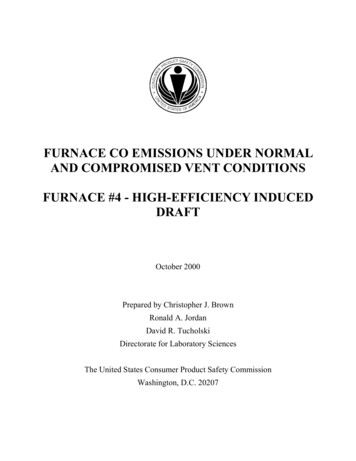
May 2022(Btu per cubic foot) – ,0181,035ColoradoConnecticutDelawareDistrict of 1,0581,0461,025MissouriMontanaNebraskaNevadaNew ,0301,0301,0241,0481,0641,0381,030New JerseyNew MexicoNew YorkNorth CarolinaNorth ennsylvaniaRhode 81,0291,0661,0301,0431,0371,030South CarolinaSouth ermontVirginiaWashingtonWest ,0351,0331,0321,0321,035StateTable 25Table 25. Heating value of natural gas consumed, by state, 2020‐2022See footnotes at end of table.U.S. Energy Information Administration Natural Gas MonthlyCreated on:5/24/2022 7:16:28 AM99
Table 25May 2022Table 25. Heating value of natural gas consumed, by state, 2020‐2022(Btu per cubic foot) – District of New ,0431,040New JerseyNew MexicoNew YorkNorth CarolinaNorth 11,071OhioOklahomaOregonPennsylvaniaRhode 71,031South CarolinaSouth est ,0391,0391,0391,039Notes: Geographic coverage is the 50 states and the District of Columbia. Heating value is the average number of British thermal units (Btu) per cubic foot of natural gasas reported on Form EIA‐857. See Appendix A, Explanatory Note 11, for further information.Source: U.S. Energy Information Administration (EIA): Form EIA‐857, Monthly Report of Natural Gas Purchases and Deliveries to Consumers, and Form EIA‐923, PowerPlant Operations Report.100U.S. Energy Information Administration Natural Gas MonthlyCreated on:5/24/2022 7:16:56 AM
Table 25. Heating value of natural gas consumed, by state, 2020‐2022 (Btu per cubic foot) State 2022 3‐Month YTD 2021 3‐Month YTD 2020 3‐Month YTD 2022 2021 March February January Total Alabama 1,028 1,028 1,028 1,029 1,026 1,029 1,030 Alaska 987 989 984 990 987 985 985